Sample Category Title
EUR/AUD Daily Outlook
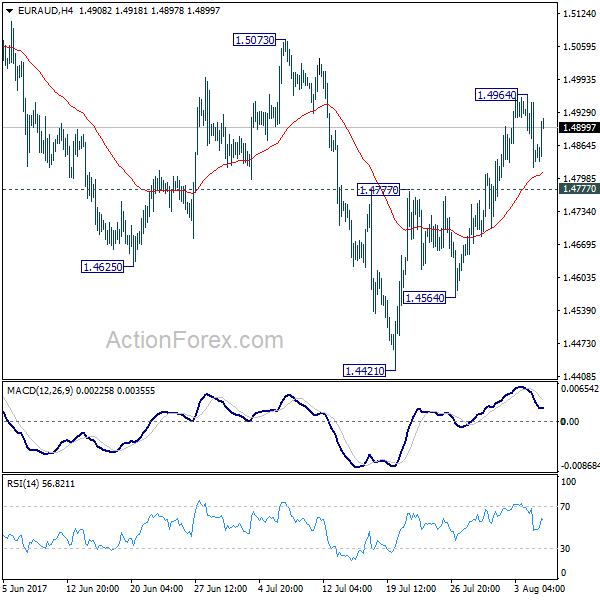
Daily Pivots: (S1) 1.4787; (P) 1.4876; (R1) 1.4931; More...
Intraday bias in EUR/AUD remains neutral for the moment. Outlook stays bullish as long as 1.4777 support holds and further rise is expected. As noted before, correction from 1.5226 should have completed with three waves down to 1.4421 already. Above 1.4964 will target 1.5073 resistance first. Break of 1.5073 will likely resume the rise from 1.3624 and target 61.8% projection of 1.3624 to 1.5226 from 1.4421 at 1.5411 next. However, firm break of 1.4777 will dampen this bullish view and turn bias to the downside for 1.4564 support. Break will extend the correction from 1.5226 through 1.4421.
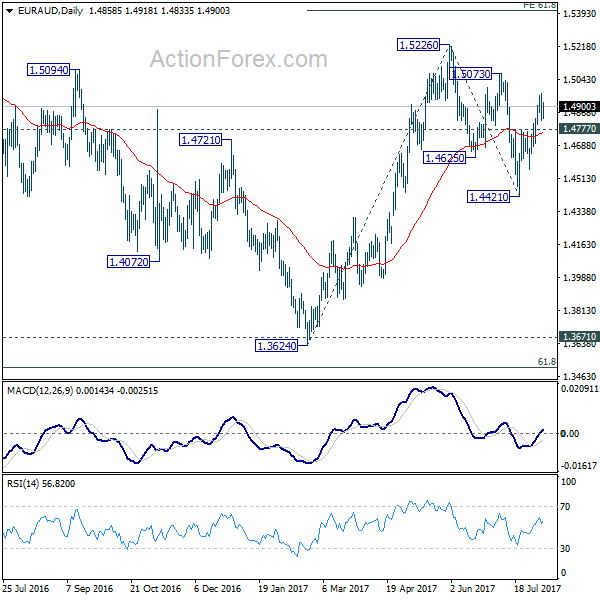
In the bigger picture, we're holding on to the view that corrective decline from 1.6587 medium term has completed at 1.3624. Rise from 1.3624 is expected to resume to retest 1.6587. The corrective structure of the fall from 1.5226 is affirming this view. Above 1.5226 will target a test on 1.6587 key resistance. However, another decline will dampen our view and would drag EUR/AUD lower to retest key support zone around 1.3624.
USD/CAD: Employment Change
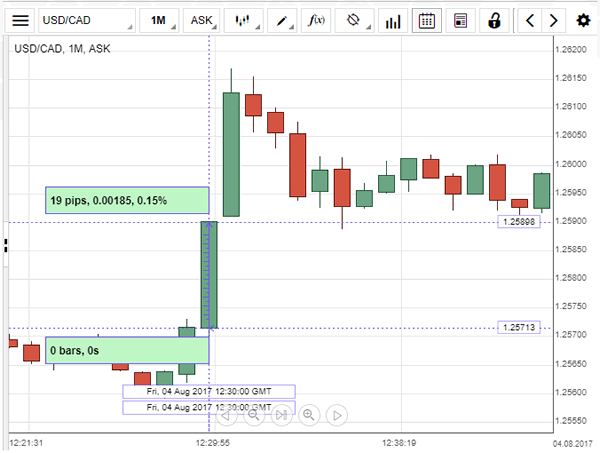
The USD/CAD currency pair extended gains, as the data painted a darker picture for Canada's jobs market. The Loonie depreciated against the US Dollar by 0.15% to hit the 1.2589 mark just after the release was published. Statistics Canada reported that the country's labour market added 10.9K jobs in July, falling below expectations for a gain of 13.1K new positions. However, the unemployment rate fell to 6.3%, while economists anticipated an unchanged reading of 6.5%. The surprisingly lower unemployment supported the Bank of Canada's intention for one more rate hike in October. Though, additionally reported trade figures, which were weaker than expected, forced to wait for more signs of sustainable economic expansion.
EUR/CHF Daily Outlook
Daily Pivots: (S1) 1.1394; (P) 1.1465; (R1) 1.1519; More...
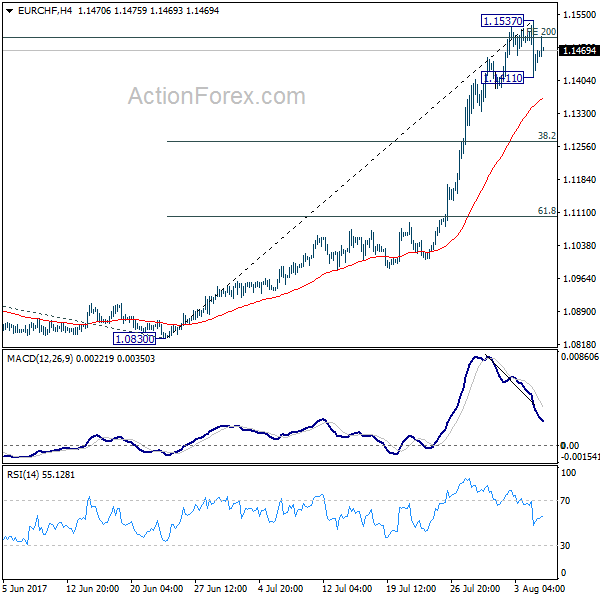
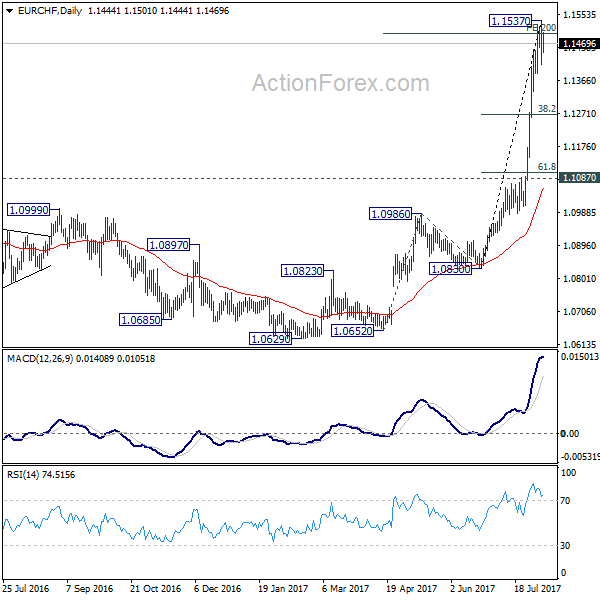
Intraday bias in EUR/CHF is turned neutral with today's recovery. But still, a short term top should be formed at 1.1537 on bearish divergence condition in 4 hour MACD, after hitting a key projection level. More corrective trading and deeper fall is expected in near term. Below 1.1411 will target 4 hour 55 EMA (now at 1.1365) and below. But downside should be contained by 38.2% retracement of 1.0830 to 1.1537 at 1.1267 and bring rebound.
In the bigger picture, sustained break of 1.1198 key resistance confirms resumption of the long term rise from SNB spike low back in 2015. In this case, EUR/CHF would eventually head back to prior SNB imposed floor at 1.2000. For now, this will be the favored case as long as 1.1087 resistance turned support holds.
NZD/ZSD Reverses Gains, Germany’s Industrial Production Drops
NZD drops as inflation outlook weakens
The News Zealand dollar tumbled on Monday after a survey showed businesses expect inflation to move south soon. On-year inflation expectations slid to 1.77%y/y from 1.92% three months ago, while two-year ahead inflation expectations fell to 2.09%, down from 2.17% previous reading. As a result, the Kiwi dropped 0.45% against the US dollar to 0.7375, the lowest level since July 20th.
The sharp debasement of the New Zealand dollar of the last couple of days is mainly due to two points. First the last US jobs report - released on Friday - gave an upbeat assessment of the world’s largest economy and relaunched speculations about a more hawkish Federal Reserve. The probabilities of a rate hike in December - extracted from the Fed funds futures - jumped from 37.4% to almost 45%. This is not much but enough to give the greenback a slight boost.
Secondly, the decline in inflation expectations will likely pleased the Reserve Bank of New Zealand, which is expected to review its monetary policy next Wednesday (no change expected), in its fight against a strong Kiwi. The RBNZ will likely emphasize the risk to inflation of a strong NZD and add that a tighter monetary policy would just make things worse.
Finally, one could also mentioned the extreme in non-commercial positioning. Total net speculative Kiwi speculative position rose to 63.5% of total open interest (future only) last week, increasing the odds of a downside correction as an unwinding of long position is more than likely.
Germany: Industrial production fell unexpectedly
Markets did not expect it, German industrial production has surprisingly strongly declined in June to -1.1% (monthly performance) while markets estimated the data to increase around 0.2%. However the overall annualized performance remains positive at 2.4%. It is nonetheless the biggest decline in 6 months.
The Eurodollar has barely moved amid the release of this data and the pair keeps on trading slightly above its opening level around 1.18. Seasonality may also be responsible as historically there always a decline in German industrial production growth during the summer, yet it often happens in July or August and not so early. Indeed construction tends to slow during those months.
The decline in Industrial production is now putting a stop to a strong first quarter in the Eurozone. FX markets are not concerned by this pullback and markets does not seem to worry about German Q2 GDP data that should be released next week. For the time being, a weak industrial production is only seen as a retracement after strong momentum since the start of the year. Markets may be overly optimistic about the German economy and the euro rally may soon fades in case of confirming soft data.
Forex Technical Analysis: EUR/USD, USD/JPY, GBP/USD
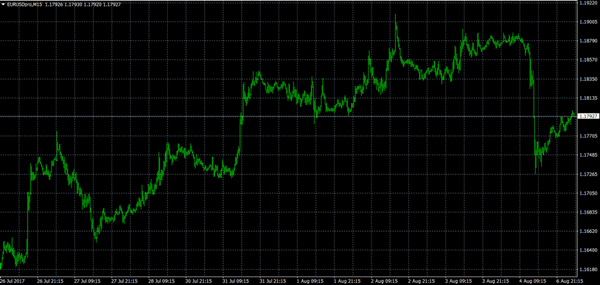
EUR/USD
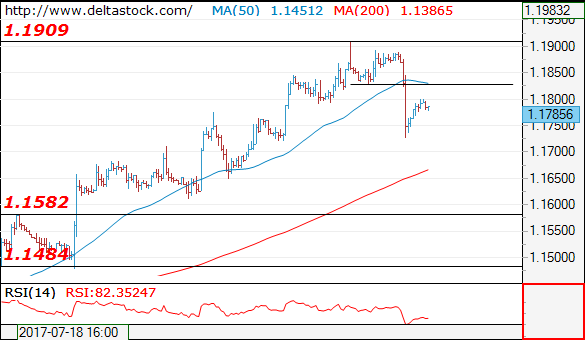
Current level - 1.1785
The recent peak at 1.1909 shows a reversal of the whole rise from 1.1310 and the bias is bearish, for a slide towards 1.1650 and probably 1.1850 support zone. Initial intraday resistance lies at 1.1825.
| Resistance | Support | ||
| intraday | intraweek | intraday | intraweek |
| 1.1825 | 1.2000 | 1.1650 | 1.1580 |
| 1.1909 | 1.2240 | 1.1580 | 1.1480 |
USD/JPY
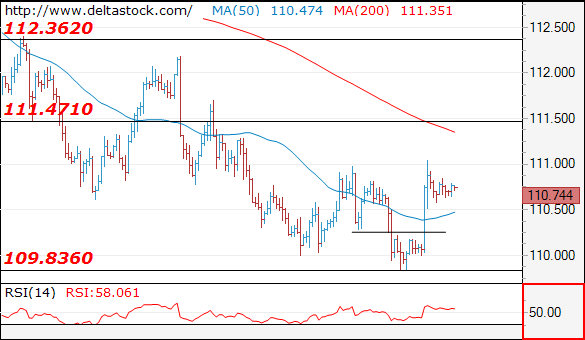
Current level - 110.74
The outlook is positive above 110.20 support, for a break through 111.00 area, towards 112.20 zone.
| Resistance | Support | ||
| intraday | intraweek | intraday | intraweek |
| 111.00 | 112.20 | 110.20 | 109.80 |
| 111.50 | 114.50 | 109.80 | 108.10 |
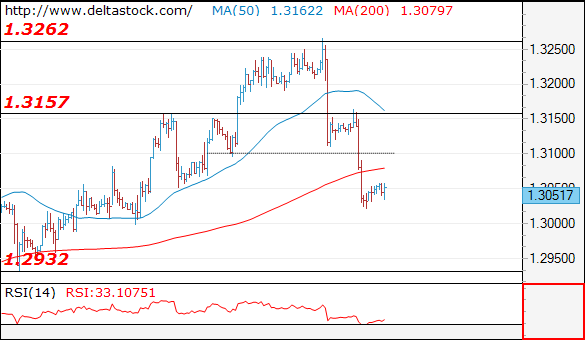
GBP/USD
Current level - 1.3057
The bias here remains bearish, for a slide towards 1.2930 zone. Key hurdle on the upside is projected at 1.3100.
| Resistance | Support | ||
| intraday | intraweek | intraday | intraweek |
| 1.3100 | 1.3260 | 1.3000 | 1.2930 |
| 1.3170 | 1.3500 | 1.2930 | 1.2810 |
Strong Jobs Data And Comments On Tax Reform Lift The Dollar
The greenback rebounded on Friday, following the release of the US employment report for July and subsequently, some comments on tax reform from the Director of the US National Economic Council, Gary Cohn. Kicking off with the jobs data, nonfarm payrolls rose by 209k, more than the consensus of 183k. The unemployment rate ticked down, while average hourly earnings accelerated in monthly terms, both in line with expectations.
The second and biggest leg higher in USD came after Cohn said that the US administration aims to reduce the corporate tax rate to around 23%. He added that the new plan will include incentives for US corporations to repatriate cash held abroad. If such a plan materializes, a repatriation would likely provide a significant boost to USD in the longer-term, as corporations would need to convert billions held in foreign currencies back to dollars.
Nonetheless for now, despite Cohn's remarks and strong jobs data, we are not ready to call for a reversal in the dollar yet. Even though the market reacted to Cohn's comments, any tax-reform plan is still months away from being announced and implemented, at the least. On the data front, both investors and the Fed are aware that the labor market is robust and thus, further improvement in that sector is unlikely to lift materially the probability for another hike by year end. Indeed, the implied probability for another hike in 2017 stayed more or less unchanged at around 50% in the aftermath of these data. In our view, a strong rebound in inflation is needed before rate-hike bets rise materially and help the dollar change its fortune. In this respect, CPI data due out on Friday will probably attract attention, though the consensus is for another set of lackluster prints.
EUR/USD tumbled on Friday in the aftermath of the US jobs data and Cohn's comments. The rate fell back below 1.1830 (R1), but hit 1.1725 (S1) and started to recover. The rate continues to trade above the short-term uptrend line taken from the low of the 22nd of June and thus, we consider the near-term picture to still be positive. We would treat Friday's slide as a corrective phase and we expect the bulls to continue erasing these losses. We believe that they may challenge the 1.1830 (R1) line as a resistance soon. A clear break above that level could set the stage for another test near the 1.1900 (R2) territory.
Oil producers meet to discuss compliance with cuts
Today, oil traders will probably turn their sights to Abu Dhabi, where OPEC and non-OPEC officials will meet to discuss why some countries are falling behind in their pledges to cut production as agreed in May. Any signals that the cartel may take a harder line on members not complying with their quotas, or that OPEC could take other steps to boost compliance, may help oil prices to trade higher.
WTI traded north on Friday, despite the dollar's strength on the US employment report and Cohn's remarks. The price rebounded after it hit once again support near the 48.60 (S1) line, but the recovery stopped at 49.75 (R1). WTI continues to trade above the upper bound of the medium-term downside that contained the price action from the beginning of February until the 27th of July, which keeps the door open for further recovery. A break above the 50.35 (R2) obstacle would confirm a forthcoming higher high on the 4-hour chart and could open the way for the critical hurdle of 51.50 (R3).
That said, we repeat for the umpteenth time that we are mindful on whether a healthy long-term uptrend can be established. Any future gains may be capped by the USD 51.50 – 55.00 range, where US producers may be tempted to increase production significantly.
As for the rest of today's highlights:
The only noteworthy indicator we get is Germany's industrial production for June. We also have two speakers on the agenda: St. Louis Fed President James Bullard and Minneapolis Fed President Neel Kashkari.
As for the rest of the week:
On Tuesday, China's trade balance for July is out while on Wednesday, we get the nation's CPI and PPI data for the same month. On Thursday, during the early Asian morning, the RBNZ will announce its policy decision. We believe that policymakers could deliver a more cautious narrative on the economy, and perhaps even issue a warning about the recent strength of NZD. Finally on Friday, we will get the highly-anticipated US CPI data for July.
EUR/USD
Support: 1.1725 (S1), 1.1655 (S2), 1.1615 (S3)
Resistance: 1.1830 (R1), 1.1900 (R2), 1.1980 (R3)
WTI
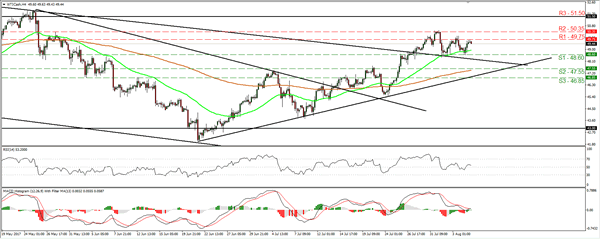
Support: 48.60 (S1), 47.55 (S2), 46.85 (S3)
Resistance: 49.75 (R1), 50.35 (R2), 51.50 (R3)
European Data Drive Headlines On Monday
A steady stream of economic data will make its way through the financial markets on Monday, with European releases expected to make the most noise.
Action begins at 06:00 GMT with German industrial production figures. Germany’s factory output is forecast to climb 0.3% in June, after rising 1.2% the previous month.
At 07:15 GMT, the Swiss government will release the monthly consumer price index (CPI), the most closely-watched barometer of inflation. CPI is forecast to decline 0.3% in July, which translates into a year-over-year gain of 0.3%.
Attention shifts to sentiment data at 08:30 GMT with report on Eurozone investor confidence. The Sentix consumer confidence index is expected to fall to 27.8 in August from 28.3 the previous month.
In North America, the Federal Reserve will release its monthly labor market conditions index at 14:00 GMT. On Friday, the Labor Department said US employers added 209,000 workers to payrolls in July, far exceeding forecasts calling for 180,000. The unemployment rate dipped to 4.3%, matching a 16-year low.
Later in the session, the Fed will also report on consumer credit change for the month of July.
In monetary policy, Federal Reserve Bank of Minneapolis President Neel Kashkari will deliver public remarks at 17:25 GMT. Kashkari is a voting member of this year’s Federal Open Market Committee (FOMC).
Solid jobs numbers lifted the US dollar to one-week highs on Friday. The dollar index (DXY) was last down 0.2% at 93.35.
EUR/USD
The euro regained momentum on Monday after declining sharply at the end of last week. The EUR/USD exchange rate advanced 0.2% to 1.1793. Prices face immediate support at 1.1735, which corresponds with the 38.2% Fibonacci retracement of the 2014-2017 decline. On the opposite side of the spectrum, immediate resistance is found at 1.1909, the high from 2 August.
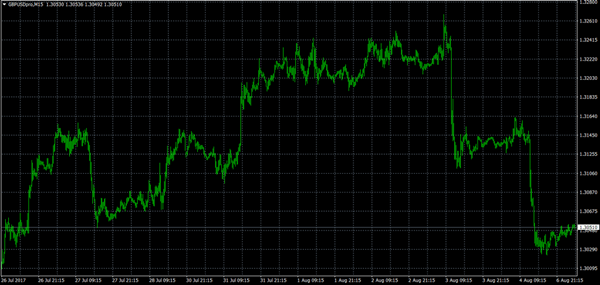
GBP/USD
The British pound was off to a stable start on Monday following sharp declines in each of the last two sessions. The GBP/USD exchange rate is well off yearly highs after the Bank of England (BOE) voted to keep interest rates on hold. Only two Monetary Policy Committee (MPC) members voted to raise interest rates, compared to three members who did the same back in June. Cable faces immediate support at the psychological 1.3000 level. A break below that region would expose 1.2930, which is the low from 20 July. On the other side of the ledger, the 2017 high of 1.3266 offers a major long-term resistance.
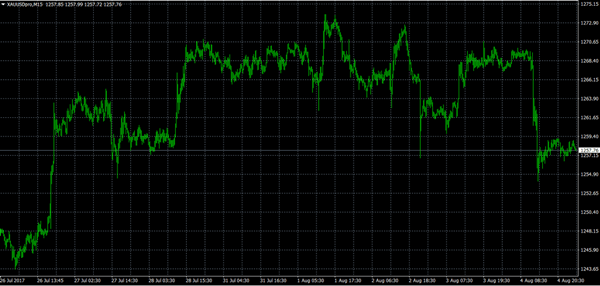
Gold
Gold prices took a nosedive on Friday, as a surging dollar pressured commodity prices. Bullion has declined in each of the last three sessions. The yellow metal remains rangebound, which means investors can expect prices to continue oscillating between $1,200 and $1,300 for the foreseeable future.
Bitcoin All-Time High!!
Bitcoin has surged above 3000. Hourly resistance is given at 3292 (06/08/20181 high) and hourly support lies very far at 2403 (26/07/2017 low). The road is wide open for further bullish move.
In the long-term, the digital currency has had an exponential growth. There are decent likelihood that the asset will consolidate above $1500. Long-term support is given at $1464 (04/05/2017 low).
Crude Oil Riding Symmetrical Triangle
Crude oil is trading mixed. Hourly support is given at 47.86 (26/07/2017 low). Strong resistance can be found at 50.41 (31/07/2017). Expected to break higher.
In the long-term, crude oil has recovered after its sharp decline last year. However, we consider that further weakness are very likely. Strong support lies at 35.24 (05/04/2016) while resistance can now be found at 55.24 (03/01/2017 high).
Silver Short-Term Bullish Momentum Is Fading
Silver's bullish pressures have faded after the commodity reached hourly resistance at 16.94 (02/08/2017 high). The commodity has broken hourly support at 16.25 (25/07/2017 low). Expected to continue pushing lower.
In the long-term, the death cross indicates that further downsides are very likely. Resistance is located at 25.11 (28/08/2013 high). Strong support can be found at 11.75 (20/04/2009).