Sample Category Title
Crude Oil Riding Symmetrical Triangle
Crude oil is trading mixed. Hourly support is given at 47.86 (26/07/2017 low). Strong resistance can be found at 50.41 (31/07/2017). Expected to break higher.
In the long-term, crude oil has recovered after its sharp decline last year. However, we consider that further weakness are very likely. Strong support lies at 35.24 (05/04/2016) while resistance can now be found at 55.24 (03/01/2017 high).
Silver Short-Term Bullish Momentum Is Fading
Silver's bullish pressures have faded after the commodity reached hourly resistance at 16.94 (02/08/2017 high). The commodity has broken hourly support at 16.25 (25/07/2017 low). Expected to continue pushing lower.
In the long-term, the death cross indicates that further downsides are very likely. Resistance is located at 25.11 (28/08/2013 high). Strong support can be found at 11.75 (20/04/2009).
EUR/USD Daily Outlook
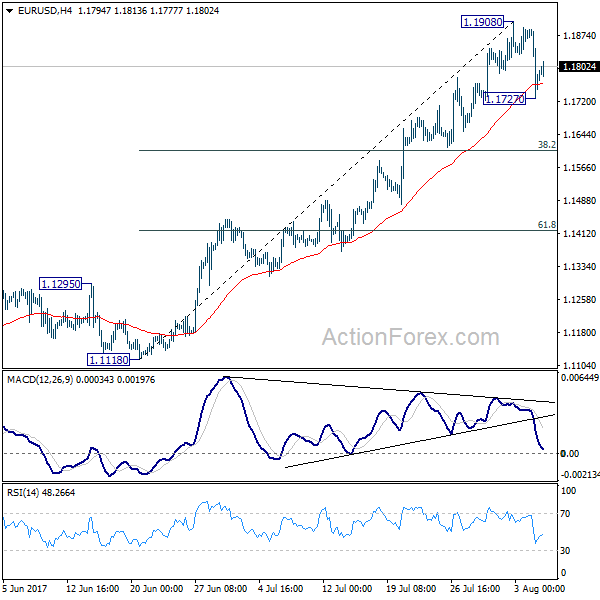
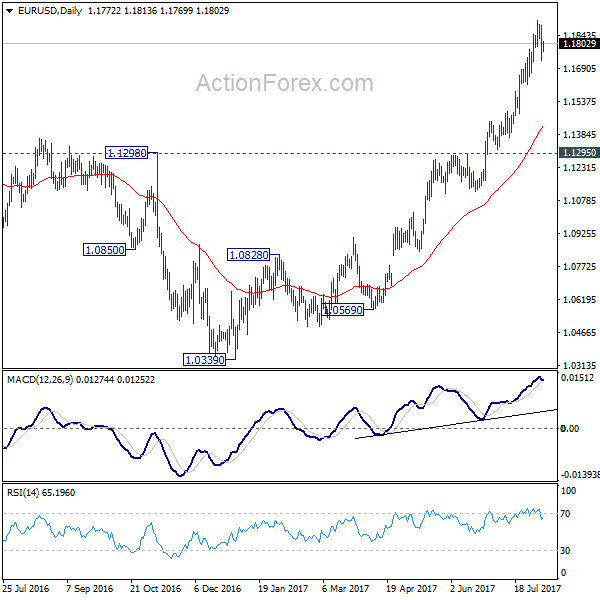
Daily Pivots: (S1) 1.1702; (P) 1.1796 (R1) 1.1863; More...
EUR/USD recovers after drawing support from 4 hour 55 EMA and intraday bias is turned neutral first. But after all, a short term top is formed at 1.1908 on divergence condition in 4 hour MACD. Deeper correction is expected as long as 1.1908 holds. Below 1.1727 minor support will turn bias to the downside for 38.2% retracement of 1.1119 to 1.1908 at 1.1606. We'd expect strong support there to bring rebound.
In the bigger picture, an important bottom was formed at 1.0339 on bullish convergence condition in weekly MACD. Sustained break of 55 month EMA (now at 1.1760) will pave the way to key fibonacci level at 38.2% retracement of 1.6039 (2008 high) to 1.0339 (2017 low) at 1.2516. While rise from 1.0339 is strong, there is no confirmation that it's developing into a long term up trend yet. Hence, we'll be cautious on strong resistance from 1.2516 to limit upside. But for now, medium term outlook will remain bullish as long as 1.1295 support holds, in case of pull back.
Gold Pushing Lower
Gold is consolidating lower. The commodity has broken support at 1254 (27/07/2017 low)/ Strong support is given at 1204 10/07/2017 high). Hourly resistance is given at 1274 (01/08/2017 high). Expected to see further bearish pressures.
In the long-term, the technical structure suggests that there is a growing upside momentum. A break of 1392 (17/03/2014) is necessary ton confirm it, A major support can be found at 1045 (05/02/2010 low)
EUR/CHF Profit-Taking
EUR/CHF's buying pressures are fading and selling pressures arise. Hourly support is located at a distance at 1.1412 (04/08/2017 low). Expected to show further downside pressures towards 1.1400.
In the longer term, the technical structure has reversed. Resistance at 1.1200 (04/02/2015 high) has been broken. Yet,the ECB's QE programme is likely to cause persistent selling pressures on the euro, which should weigh on EUR/CHF. Supports can be found at 1.0184 (28/01/2015 low) and 1.0082 (27/01/2015 low).
EUR/GBP Bullish Pressures Persist
EUR/GBP is trading around its highest levels of the year. The pair keeps on pushing higher. Hourly resistance lies at 0.9054 (04/08/2017 high). Hourly support is given at a distance at 0.8742 (16/06/2017 low). Downside risks are nonetheless important.
In the long-term, the pair has largely recovered from recent lows in 2015. The technical structure suggests a growing upside momentum. The pair is trading above from its 200 DMA. Strong resistance can be found at 0.9500 psychological level.
GBP/USD Daily Outlook
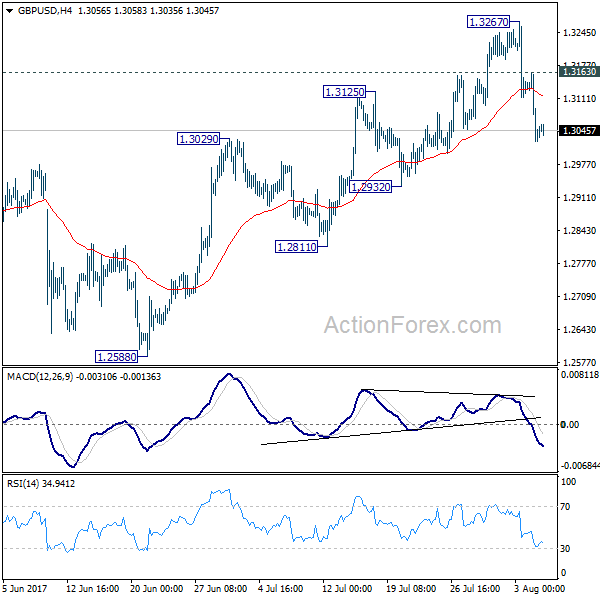
Daily Pivots: (S1) 1.2983; (P) 1.3073; (R1) 1.3124; More...
Intraday GBP/USD remains on the downside for 1.2932 support. Price actions from 1.1946 are viewed as a corrective pattern, no change is this view. Such correction could have completed at 1.3267 already. Break of 1.2932 will affirm this bearish case and target 1.2588 key near term support for confirmation. On the upside, however, above 1.3163 minor resistance will turn bias back to the upside for 1.3267 instead.
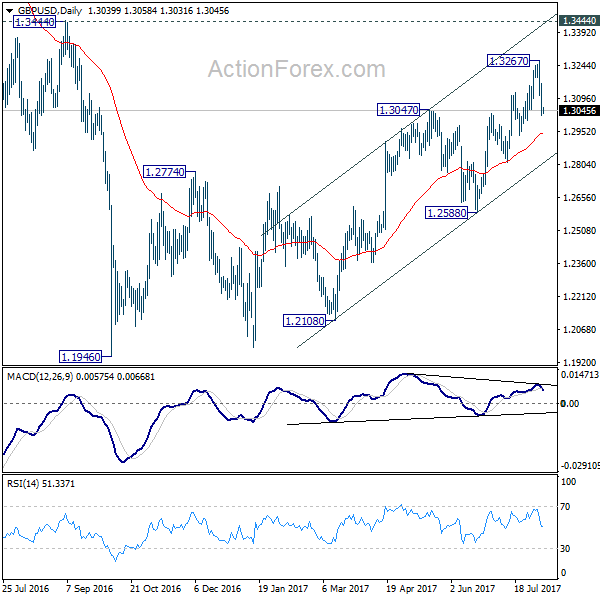
In the bigger picture, overall, price actions from 1.1946 medium term low are seen as a corrective pattern that is still in progress. While further upside is expected, larger outlook remains bearish as long as 1.3444 key resistance holds. Down trend from 1.7190 (2014 high) is expected to resume later after the correction completes. And break of 1.2588 will indicate that such down trend is resuming.
AUD/USD Selling Pressures Continue To Increase
AUD/USD's short-term technical structure is bearish. Hourly resistance is given at 0.8066 (27/07/2017 high) while hourly support can be found at 0.7875 (21/07/2017 low). Expected to show further consolidation.
In the long-term, we are waiting for further signs that the current downtrend is ending. Key supports stand at 0.6009 (31/10/2008 low) . A break of the key resistance at 0.8295 (15/01/2015 high) is needed to invalidate our long-term bearish view.
USD/CAD Short-Term Bullish Momentum Continues
USD/CAD's short-term bullish momentum continues. Hourly resistance is given at 1.2619 (03/08/2017) while support can be found at 1.2414 (27/07/2017 low). Expected to show continued consolidation above 1.2400.
In the longer term, the pair has broken longterm support that can be found at 1.2461 (16/03/2015 low) before bouncing back. Strong resistance is given at 1.4690 (22/01/2016 high). The pair should head further lower
USD/CHF Testing Strong Resistance
USD/CHF's bullish momentum continues. Hourly support can be found at 0.9631 (01/08/2017 low). Strong resistance is given at 0.9771 (15/06/2017 high) is on target. Expected to to show further strengthening.
In the long-term, the pair is still trading in range since 2011 despite some turmoil when the SNB unpegged the CHF. Key support can be found 0.8986 (30/01/2015 low). The technical structure favours nonetheless a long term bullish bias since the unpeg in January 2015.