Sample Category Title
After Math of US NFP & What To Do Now
Fed Won't Change Their Stance
How Dollar Can Find Life
Factors Not Factored
Looking Ahead
How To Trade Gold After US NFP
The US NFP data was released and in the initial reaction the dollar moved higher, Treasuries fell and the equity markets loved the news. The US non-farm employment number came ahead of the expectations with the reading of 209K while the forecast was for 182K. At 180K the market forecast for July's NFP is in line with the six-month (180k) and 12-month (187k) moving averages, with variations anticipated to fall within the 125K-220K range. Hiring gains have been slow but steady in the past months. The unemployment rate dropped to 4.3 percent from previous reading of 4.4 percent.
Statistics show a tendency for July payrolls to be slightly underrated, leading to a combined miss of about 12K in the past 10 years. The print for July 2016 was a miss as high as 75K. The end of the school year causes a substantial loss of jobs, which in its turn means that seasonal adjustments for July tend to have a negative impact. This normally equals a 1.3 million jobs lost, which is less than the most impactful seasonal adjustment of the year taking place in January.
Fed Won't Change Their Stance
Overall you can say that there was nothing in this data which was extraordinary. The Fed chairwoman does not have any reason to pop any Champaign bottle yet. I think the data gives her no reason to change her current stance on the monetary policy and hence the equity market is in love with today's news- at least for now.
How Dollar Can Find Life
For the dollar index to stem its losses, we need the wage growth to continue to tick higher. As long as wages remain at the current levels, I wouldn't be surprised if the estimated increase for 2H GDP growth (2.6%) relative to 1H (1.9%) led to more hirings in the near term. That would help the major denominator for the dollar, the GDP growth, to improve.
Factors Not Factored
The question if the equity market is overvalued or overbought would require a separate article to explain the logic but in summary as long as the headline economic numbers do not upset the apple cart, I think there is more room to run for this equity market.
Pretty much all markets especially the forex and equity markets are shrugging off any concerns about Donald Trump's policy agenda or paying any attention to the Special counsel Robert Muller's probe into Russia's interfering in the 2016 election. These risks are not even baked in the gold price either.
Looking Ahead
Today's number has shown that halfway through 2017 the economy is in a stable condition but not enough to produce the kind of growth which we need. Going forward, traders will be focusing on two key data – the average hourly earnings and the household income creation. If we are to see a rise in GDP in 2H we need the increase of household income to materialize faster. The data however is currently pointing to a different direction. Based on the 2Q GDP results it is consumers who made the largest contribution to growth. Therefore, we expect the wage and salary gains to remain a key indicator for economic growth in the second half of 2017.
How To Trade Gold After US NFP
Investors had one focus today which is what will be the impact of the US non-farm payroll data on the Fed interest rate hike. When it comes to the US NFP number, only an extreme reading on either side would have impacted the Fed's stance. So far, the odds are low that we are going to see another rate hike this year and this has stimulated the rally for the gold price. We are up nearly 10.6% so far this year and this is despite the fact that we have seen a few interest rate hikes this year. What really matters is the economic data and if it confirms that the economy is not facing any major threat, we think that the Fed would resume their gradual interest rate hike.
Technical Analysis
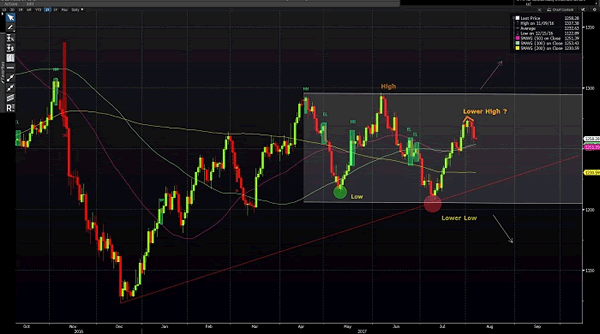
The uptrend is strong as the price is trading above the 100 and 200 day moving average – a clear signal for a strong uptrend. Moreover, we are consolidating in a sideway pattern. However, something which we need to watch out for is that we have formed a lower low and perhaps in a process of forming a lower high (as shown on the chart). A break below the 200-day moving average would signal that the game is about to change and the break of the upward trend line would validate that we may have another lower low.
EUR/USD Analysis: Breaches Patterns
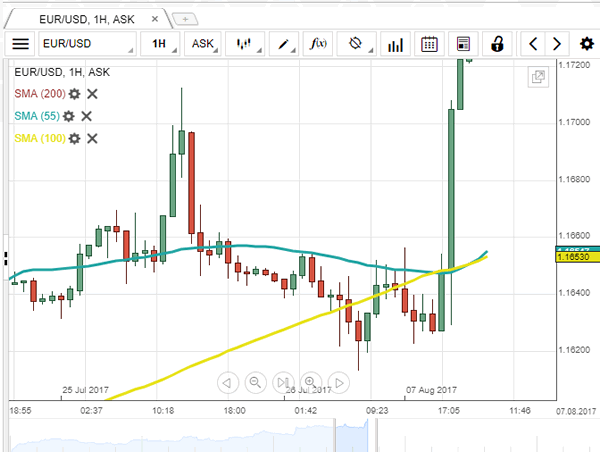
Following the massive plunge mid-Friday, EUR/USD breached two patterns simultaneously, namely, an ascending wedge and a longer-term channel up. The pair halted near the 200-hour SMA circa 1.1770— a level which has managed to provide support this morning, as well. It seems that the rate is starting to recover losses, thus approaching a resistance cluster formed by the 55– and 100-hour SMAs. In general, the pair is expected to make a retracement from the bottom channel boundary in the 1.1840/60 area that should be realised within the upcoming 24 hours. Technical indicators suggest that the Euro may remain relatively stable against the Greenback, thus entering a consolidation period between the aforementioned resistance cluster and the 200-hour SMA.
GBP/USD Analysis: Calm After Fundamentals
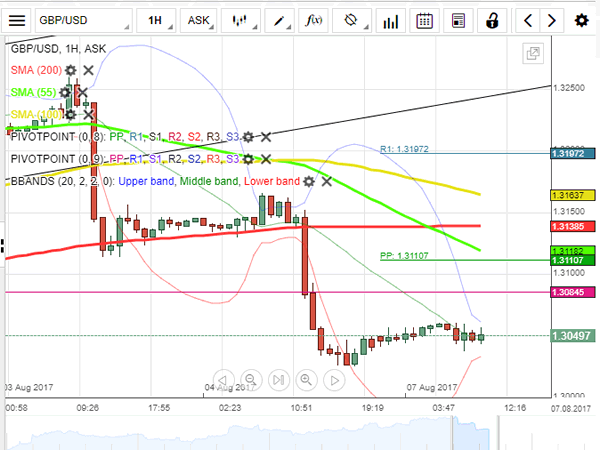
The GBP/USD currency pair started Friday's session rather calmly, being supported by the 200-hour SMA near 1.32. This lack of movement, however, changed at 1230GMT when solid fundamentals from the US altered market sentiment in favour of Dollar bulls. Thus, the Pound ended the previous trading week slightly above the 1.3020 mark and remained in the same range this morning, as well. The aforementioned plunge set the pair in the strongly bearish territory; thus, it is expected that the Pound tries to recover some losses and approach the monthly PP or a resistance cluster formed by the 55– and 200-hour SMAs circa 1.3150. Meanwhile, the lack of market shakers today may likewise keep the pair relatively still, thus resulting in the Pound fluctuating around the 20-hour SMA.
USD/JPY Analysis: Reaches 111.00 In Wake Of Fundamentals
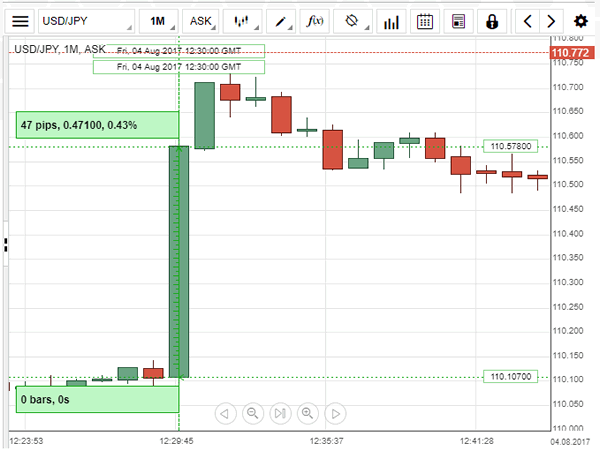
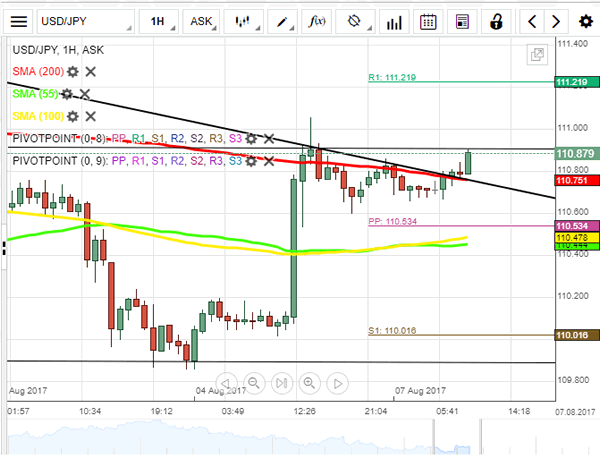
Friday morning was characterised by a lack of distinctive movement for the USD/JPY pair, as the rate remained in a relatively small range. Nevertheless, strong US employment data mid-session put an upward pressure on the Dollar that resulted in a 65-pip jump against the Yen. The rate halted at the 200-hour SMA and remained stranded below the given line on Monday morning, as well. Technical indicators suggest that the rate should trade lower within the next 24 hours. This prediction is in line with a channel down pattern which has bounded the US Dollar since early July. No market shakers are expected in this session; thus, the most likely trading range for the given pair is between the 200-, 55– and 100-hour SMAs in the 110.80/40 area.
XAU/USD Analysis: Falls Below 200-Hour SMA
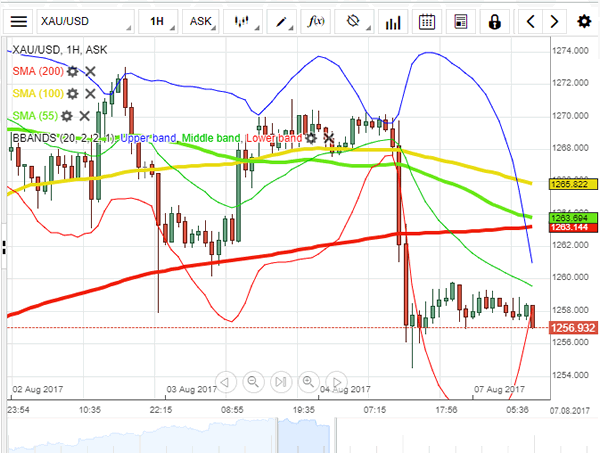
XAU/USD was not an exception for the strong appreciation of the US Dollar in the wake of solid employment data. As a result, the yellow metal fell below the 200-hour SMA into the bearish territory. Subsequently, the pair entered a consolidation period on Monday morning, thus fluctuating near the 1,257.80 mark. The given move has pushed the rate outside a minor channel down which was formed as a wave south in a senior ascending channel. Technical indicators signal to a potential near-term recovery that should push Gold back in the junior channel. Likewise, it is likely that it edges as high as the weekly PP at 1,262.80 and stops near the 200– and 55-hour SMAs. From the downside, the pair is supported by the weekly S1 at 1,251.28.
GBP/JPY Daily Outlook
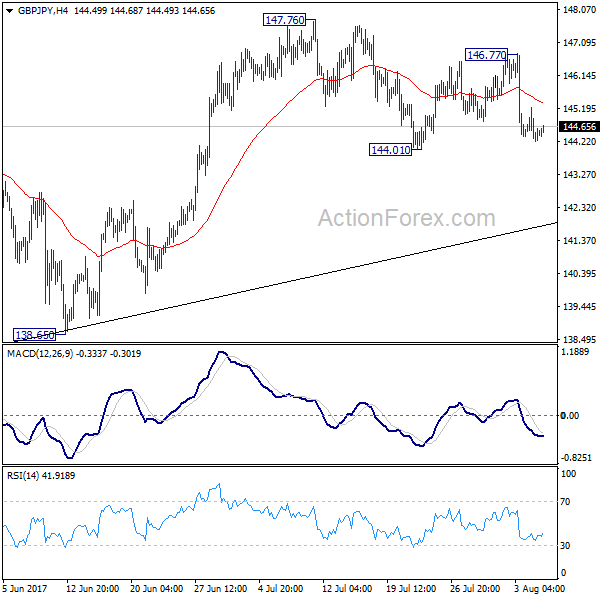
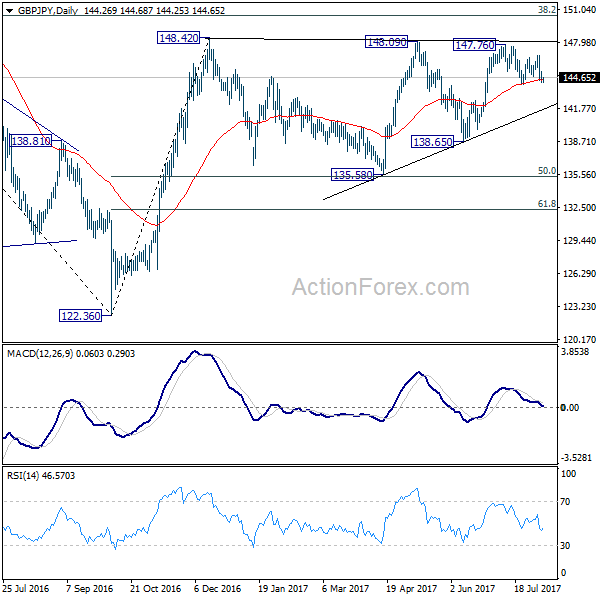
Daily Pivots: (S1) 143.92; (P) 144.57; (R1) 144.92; More
Intraday bias in GBP/JPY remains neutral with focus on 114.01 support. Break will turn bias to the downside for trend line support (now at 141.78). Further break there will target 135.58/138.65 support zone. However, above 146.77 will turn bias to the upside. Further break of 147.76/148.42 key resistance zone will resume larger rebound from 122.36. However, above 146.77 will turn bias to the upside. Further break of 147.76/148.42 key resistance zone will resume larger rebound from 122.36.
In the bigger picture, rise from medium term bottom at 122.36 is expected to continue to 38.2% retracement of 196.85 to 122.36 at 150.43. Decisive break there will carry long term bullish implications and pave the way to 61.8% retracement at 167.78. In case the sideway pattern from 148.42 extends, we'd be looking for strong support from 135.58 and 50% retracement of 122.36 to 148.42 at 135.39 to contain downside.
EUR/JPY Daily Outlook
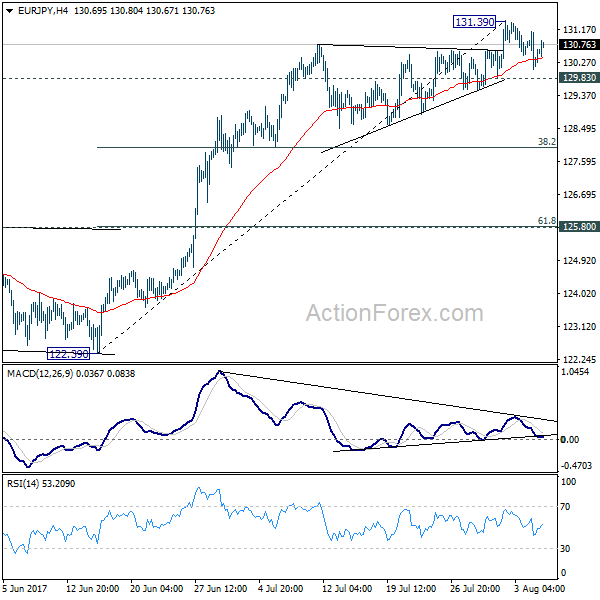
Daily Pivots: (S1) 129.86; (P) 130.49; (R1) 130.88; More...
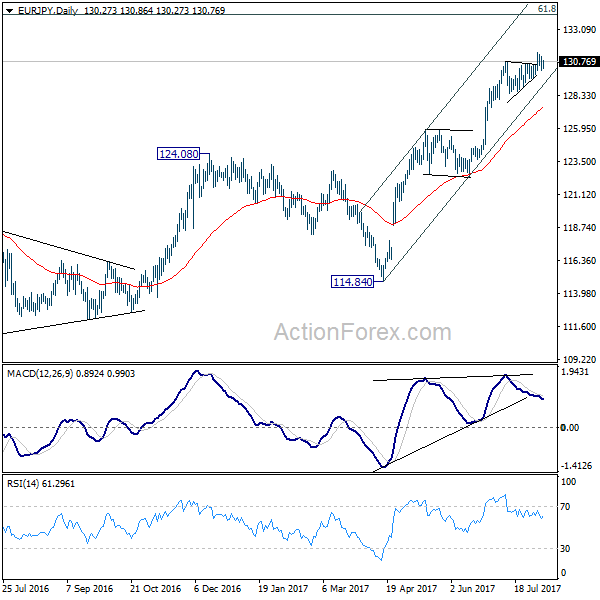
Intraday bias in EUR?JPY remains neutral for the moment. A short term top is in place at 131.39 on bearish divergence condition in 4 hour MACD. Break of 129.83 will confirm and turn bias to the downside for 38.2% retracement of 122.39 to 131.39 at 127.95. But we'd expect strong support from there to contain downside and bring rebound. On the upside, break of 131.39 is needed to confirm rise resumption. Otherwise, more consolidative trading is expected with risk of another fall.
In the bigger picture, the down trend from 149.76 (2014 high) is completed at 109.03 (2016 low). Current rally from 109.03 should be at the same degree as the fall from 149.76 to 109.03. Further rise is expected to 61.8% retracement of 149.76 to 109.03 at 134.20. Sustained break there will pave the way to key long term resistance zone at 141.04/149.76. Medium term outlook will remain bullish as long as 124.08 resistance turned support holds.
EUR/GBP Daily Outlook
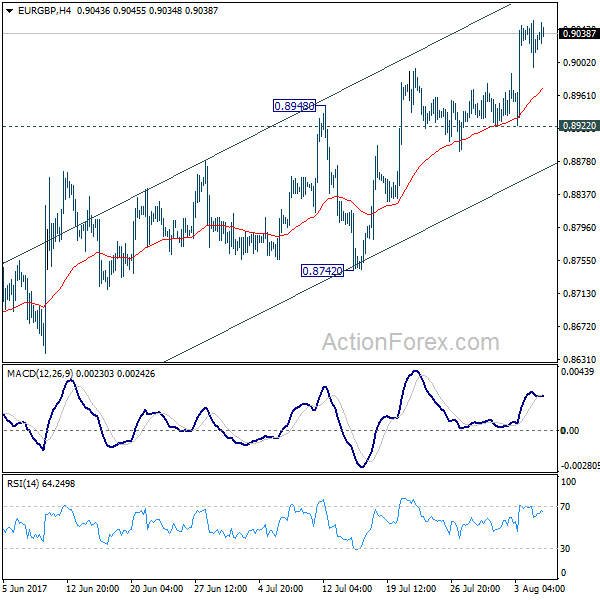
Daily Pivots: (S1) 0.8953; (P) 0.9001; (R1) 0.9079; More
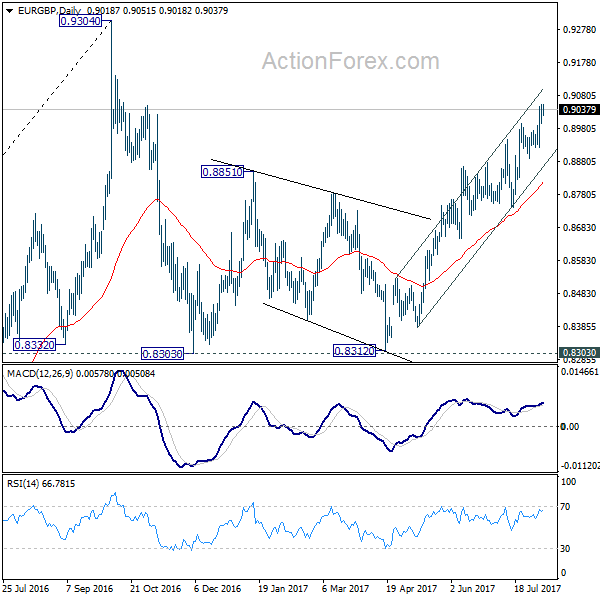
Intraday bias in EUR/GBP remains on the upside for further rally. Current rise from 0.8312 should extend towards 0.9304 key high. At this point, there is no clear sign of up trend resumption yet. Hence, we'll be cautious on strong resistance from 0.9304 to limit upside and bring another fall. Meanwhile break of 0.8922 support will indicate short term topping and turn bias to the downside for 0.8742 support.
In the bigger picture, price actions from 0.9304 are viewed as a medium term corrective pattern. It's uncertain whether it is finished yet. But in case of another fall, we'd expect strong support from 0.8116 cluster support (50% retracement of 0.6935 to 0.9304 at 0.8120) to contain downside and bring rebound. Whole up trend from 0.6935 is expected to resume after consolidation from 0.9304 completes.
NZD/USD: Inflation Expectations Q/Q
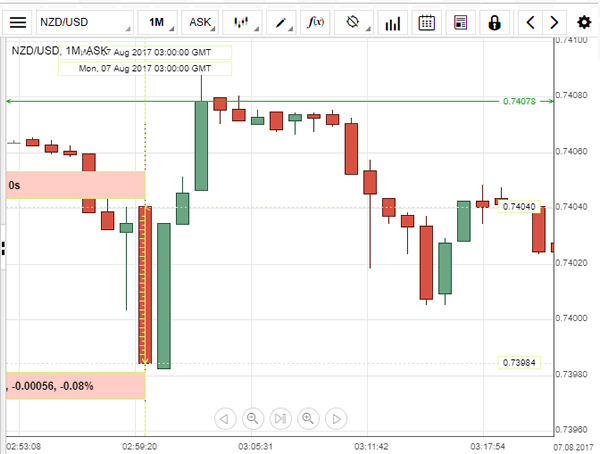
The NZD/USD exchange rate faced some volatility this morning, as Monday's survey showed diminished New Zealand inflation expectations in the Q3. After the release, the pair dropped to the 0.7397 level, then bounced back and edged higher to 0.7407 some minutes later. The survey revealed that two-year inflation forecasts edged lower to 2.1% from 2.2% previously, underscoring why the Reserve Bank of New Zealand remained committed to its simulative monetary policy. Moreover, the nation's Central Bank is largely expected to keep the key interest rate at a record-low level of 1.75% at its Wednesday's meeting, aiming to encourage the consumer prices inflation growth, which weakened more than anticipated in the Q2.
USD/JPY: Non-Farm Employment Change
The US Dollar strengthened significantly against the Yen after the stronger-than-expected non-farm payrolls report. After the release, the USD/JPY rose initially by 0.43%, or 50 base points, to be seen trading at 110.57. The Labour Department revealed that the US economy created 209K positions in July, surpassing forecasts for a 185K increase. In the meantime, the unemployment rate dropped to 4.3% from 4.4% in the reported period, matching expectations. Strong figures in conjunction with 0.3% wage growth, the strongest gain since February, provided good signs to expect better CPI and PPI reports this week. In this context, the Federal Reserve would be reassured that further policy normalisation is reasonable, keeping additional rate hikes on the table.