
Sample Category Title
Trade Idea: USD/CAD – Sell at 1.2770
USD/CAD - 1.2697
Recent wave: Only wave v of c has ended at 0.9407 and wave C of major A-B-C correction is underway with wave iii ended at 1.4690, wave v of C may bring one more marginal rise probably in 2018
Trend: Down
Original strategy :
Sell at 1.2770, Target: 1.2570, Stop: 1.2830
Position: -
Target: -
Stop: -
New strategy :
Sell at 1.2770, Target: 1.2570, Stop: 1.2830
Position: -
Target: -
Stop:-
As the greenback has continued moving higher after staging a strong rebound from 1.2414, adding credence to our view that wave iii has possibly ended at 1.2414 last month and consolidation with upside bias is seen for wave iv correction to extend gain to1.2745-50, however, reckon upside would be limited to 1.2771 (previous resistance as well as 38.2% Fibonacci retracement of wave iii) and bring retreat later, below 1.2625-30 would bring test of 1.2540-50, break there would suggest the rebound from 1.2414 has ended instead, bring further fall to 1.2490-00 but reckon support at 1.2451 would hold on first testing. We are keeping our count that wave v as well as wave (C) ended at 1.3794 and impulsive wave (i ii, i ii) is now unfolding with minor wave iii possibly ended at 1.2414, hence wave iv correction is underway.
In view of this, would be prudent to stand aside for now and look to sell on further subsequent rebound as 1.2771 resistance should limit upside. Above 1.2800-10 would defer and risk a stronger correction to 1.2850, however, still reckon upside would be limited to 1.2880-85 (50% Fibonacci retracement of wave iii) and bring retreat later next week.
To recap, wave B from 1.3066 is unfolding as an a-b-c and is sub-divided as a: 1.2192, b: 1.2716 and wave c is a 5-waver with i: 1.1983, ii: 1.2506, extended wave iii with minor iii at 1.0206, wave iv ended at 1.0781 and wave v as well as wave iii has ended at 0.9931, hence the subsequent choppy trading is the wave iv which is unfolding as (a)-(b)-(c) with (a) leg of iv ended at 1.0854, followed by (b) leg at 1.0108 and (c) leg as well as the wave iv ended at 1.0674. The wave v is sub-divided by minor wave (i): 0.9980, (ii): 1.0374, (iii): 0.9446, (iv): 0.9913 and (v) as well as v has possibly ended at 0.9407, therefore, consolidation with upside bias is seen for major correction, indicated target at 1.3700 and 1.4000 had been met and further gain to 1.4700 would be seen later.

DAX Drops on Soft German Industrial Production
The DAX index has started the week with losses. In the North American session, DAX is trading at 12,249.25, down 0.40% on the day. On the release front, German Industrial Orders disappointed with a decline of 1.1%, compared to the estimate of +0.2%. The Eurozone Sentix Investor Confidence slowed to 27.7, just shy of the forecast of 27.8 points.
Recent German numbers have been solid, so July's Industrial Production was a nasty surprise, posting a sharp decline of 1.1%. This marked the weakest reading this year. Still, German indicators continue to point to an expanding German economy. Retail Sales jumped 1.1%, its second-highest gain in 2017. Factory Orders gained 1.0%, while unemployment claims dropped 9 thousand – the employment indicator has declined every month in 2017, except one. Although manufacturing and services PMIs dipped in July, both are well over the 50-level, indicative of expansion. Are the strong German numbers too much of a good thing? Some analysts think so, and are cautioning that the German economy is in danger of overheating. The eurozone economy has also benefited from the robust German economy. Eurozone GDP gained 0.6% in the second quarter, up from 0.5% in the previous quarter. As well, Eurozone Retail Sales gained 0.5%, marking a 4-month high.
Last week's strong US payrolls report boosted the US dollar and raised the odds of a December rate hike, which are currently at 47%, up from 43% one week ago. With the Federal Reserve unlikely to raise rates before December, investor attention has shifted to the Fed's balance sheet, which stands at $4.2 trillion. Fed policymakers have broadly hinted at reducing purchases of bonds and securities starting in September, but San Francisco Fed President John Williams was more forthcoming about the Fed's plans, likely aimed at giving notice to the markets. In a speech on Wednesday, Williams said that the economy had "fully recovered" from the 2008 financial crisis and called on the Fed to start trimming the balance sheet "this fall". Williams added that the process would be gradual and would take four years to reduce the balance sheet to a "reasonable size". Other FOMC members have also come out in favor of the Fed starting to wind up its portfolio this fall.
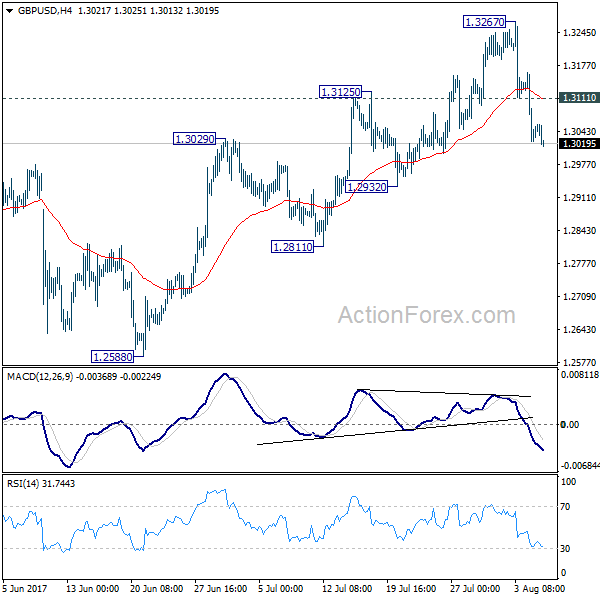
GBP/USD Mid-Day Outlook
Daily Pivots: (S1) 1.2983; (P) 1.3073; (R1) 1.3124; More...
GBP/USD's fall from 1.3267 continues today and intraday bias remains on the downside for 1.2932 support. Price actions from 1.1946 are viewed as a corrective pattern, no change is this view. Such correction could have completed at 1.3267 already. Break of 1.2932 will affirm this bearish case and target 1.2588 key near term support for confirmation. On the upside, however, above 1.3111 minor resistance will turn bias back to the upside for 1.3267 instead.
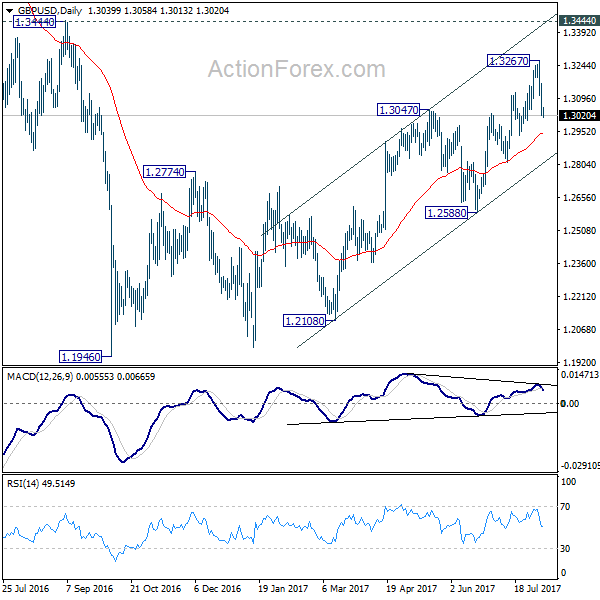
In the bigger picture, overall, price actions from 1.1946 medium term low are seen as a corrective pattern that is still in progress. While further upside is expected, larger outlook remains bearish as long as 1.3444 key resistance holds. Down trend from 1.7190 (2014 high) is expected to resume later after the correction completes. And break of 1.2588 will indicate that such down trend is resuming.
Dollar Trying to Regain Momentum, Canadian and Sterling Leading the Way Down
Dollar is trying to regain momentum against most major currencies entering into US session, except versus Euro and Swiss Franc USD/CAD takes the earlier today by breaking last week's high. GBP/USD follows closely by taking out last week's low. Meanwhile Euro is so far trading firm against others. In particular, EUR/GBP is also resuming last week's rally and breaches 0.9050. Commodity currencies are trading generally soft today. In other markets, gold continues to hover in tight range between 1260/5. WTI crude oil's sideway consolidation extends and dips below 49 handle. Oil will take some more time to consolidate before having another attempt on 50 handle.
Eurozone Sentix dipped to 27.7
Eurozone Sentix investor confidence dropped to 27.7 in August, down from 28.3, but beat expectation of 27.6. Meanwhile, expectations gauge dropped to 16.0, down from 19.8. Sentix noted in the statement "it is become increasingly clear that the economic momentum has passed its high point." And "expectations are falling around the globe, led by the United States where they dropped for a fifth straight time". Also, "German 'model student' has also dropped sharply, with the scandal surrounding the automotive industry killing the economic mood."
UK PM May denied GBP 36b divorce bill
In UK, it's reported that it's prepared to pay GBP 36b to EU to settle the so-called "divorce bill". But Prime Minister Theresa May's spokesman James Slack denied it and told reporters "I don't recognize the figure". Brexit Secretary David Davis also said that the sum was "news to me". Meanwhile, an EU official also declined to comment on the "rumor". The financial settlement is a key issue to solve before Brexit negotiation could move on to the next stage. Little progress has been made so far and it's doubtful whether talks on post Brexit trade agreement could behind in October. The third round of talks will be held in the week of August 28.
Also released from Europe, German industrial production dropped -1.1% mom in June, versus expectation of 0.2% mom rise. Swiss Foreign currency reserves rose to CHF 714b in July. Swiss CPI dropped -0.3% mom rose 0.3% yoy in July, in line with consensus. UK Halifax house prices rose 0.4% mom in July.
New Zealand inflation expectation eased
New Zealand Dollar trades notably lower today as RBNZ's survey showed inflation expectation eased. The survey showed that respondents expect 1.77% annual inflation in 1 year and 2.09% in 2 years. That's much lower than the survey result three months ago, at 1.92% in 1 year and 2.17% in 2 years. For growth, firms expected GDP to grow 2.7% in 1 year and 2.64% in 2 years, comparing to prior 2.81% and 2.58% respectively.
The data comes just head of RBNZ meeting this week on August 9, which is a major focus of the week. RBNZ is widely expected to stand pat and keep OCR unchanged at 1.75%. The central bank will likely maintain a dovish tone and keep its own forecast that rates would be on hold until September 2019.
GBP/USD Mid-Day Outlook
Daily Pivots: (S1) 1.2983; (P) 1.3073; (R1) 1.3124; More...
GBP/USD's fall from 1.3267 continues today and intraday bias remains on the downside for 1.2932 support. Price actions from 1.1946 are viewed as a corrective pattern, no change is this view. Such correction could have completed at 1.3267 already. Break of 1.2932 will affirm this bearish case and target 1.2588 key near term support for confirmation. On the upside, however, above 1.3111 minor resistance will turn bias back to the upside for 1.3267 instead.
In the bigger picture, overall, price actions from 1.1946 medium term low are seen as a corrective pattern that is still in progress. While further upside is expected, larger outlook remains bearish as long as 1.3444 key resistance holds. Down trend from 1.7190 (2014 high) is expected to resume later after the correction completes. And break of 1.2588 will indicate that such down trend is resuming.
Economic Indicators Update
| GMT | Ccy | Events | Actual | Forecast | Previous | Revised |
|---|---|---|---|---|---|---|
| 3:00 | NZD | RBNZ 2-Year Inflation Expectation Q3 | 2.10% | 1.90% | 2.20% | |
| 5:00 | JPY | Leading Index Jun P | 106.3 | 106.2 | 104.6 | |
| 6:00 | EUR | German Industrial Production M/M Jun | -1.10% | 0.20% | 1.20% | |
| 7:00 | CHF | Foreign Currency Reserves Jul | 714B | 693B | 694B | |
| 7:15 | CHF | CPI M/M Jul | -0.30% | -0.30% | -0.10% | |
| 7:15 | CHF | CPI Y/Y Jul | 0.30% | 0.30% | 0.20% | |
| 7:30 | GBP | Halifax Plc House Prices M/M Jul | 0.40% | 0.30% | -1.00% | -0.90% |
| 8:30 | EUR | Eurozone Sentix Investor Confidence Aug | 27.7 | 27.6 | 28.3 |
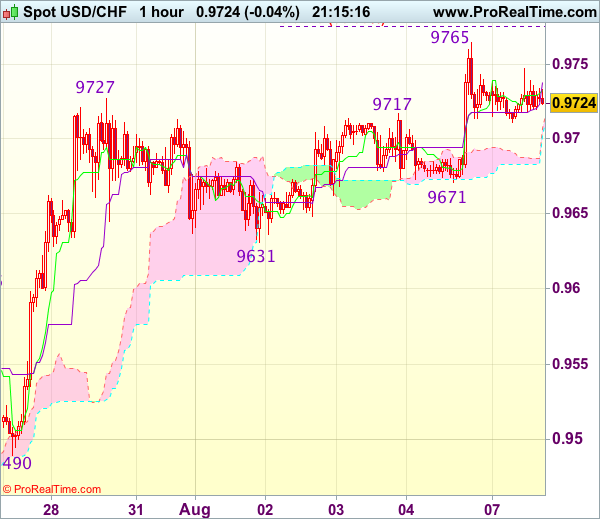
Trade Idea Update: USD/CHF – Buy at 0.9685
USD/CHF - 0.9726
Original strategy :
Buy at 0.9685, Target: 0.9785, Stop: 0.9650
Position : -
Target : -
Stop : -
New strategy :
Buy at 0.9685, Target: 0.9785, Stop: 0.9650
Position : -
Target : -
Stop : -
Although the greenback has retreated after rising to 0.9765 on Friday and consolidation below this level would be seen, reckon downside would be limited to support at 0.9671 and bring another rise later, above said resistance at 0.9765 would signal recent upmove is still in progress, then further gain to 0.9775 (50% projection of 0.9438-0.9727 measuring from 0.9631) and later 0.9800-10 (61.8% projection) would follow but reckon 0.9830-40 would hold from here, bring another retreat later.
In view of this, would not chase this rise here and would be prudent to buy dollar on pullback as 0.9680-85 should limit downside. Below 0.9671 support would defer and suggest top is possibly formed, risk test of support at 0.9631 but break there is needed to add credence to this view, bring retracement of recent rise to 0.9596 (previous resistance turned support).
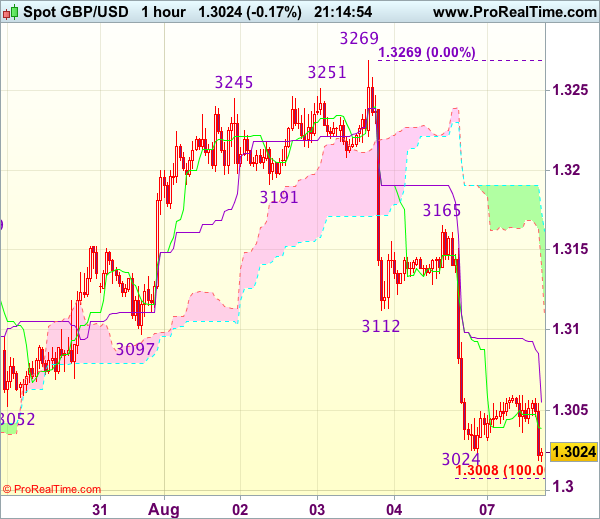
Trade Idea Update: GBP/USD – Sell at 1.3110
GBP/USD - 1.3020
Original strategy :
Sell at 1.3110, Target: 1.3010, Stop: 1.3145
Position : -
Target : -
Stop : -
New strategy :
Sell at 1.3110, Target: 1.3010, Stop: 1.3145
Position : -
Target : -
Stop : -
As cable has remained under pressure after last week’s selloff from 1.3269 top, adding credence to our bearish view for this fall to bring retracement of recent upmove, hence bearishness remains for further decline to 1.3005-10 (100% projection of 1.3269-1.3112 measuring from 1.3165) but a break below support at 1.2999 is needed to retain bearishness, then subsequent fall to 1.2986 (61.8% Fibonacci retracement of 1.2812-1.3269) and possibly 1.2955-60 would follow.
In view of this, we are looking to sell cable on recovery as previous support at 1.3112 should limit upside. Only break of 1.3165 is needed to signal low is formed instead, bring a stronger rebound to 1.3200 but upside should be limited to 1.3240-50 and price should falter below said resistance at 1.3269.
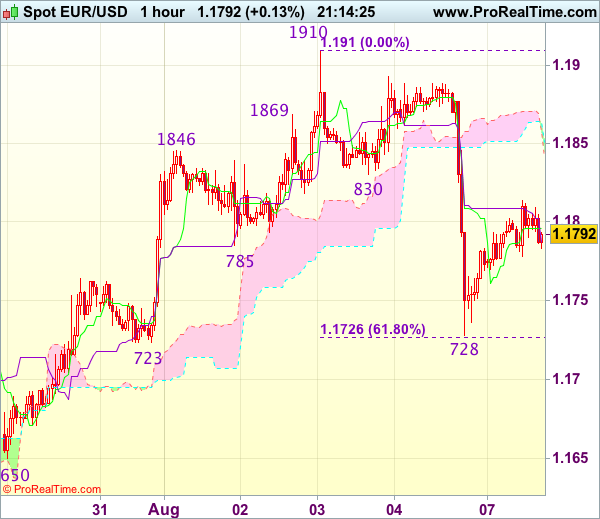
Trade Idea Update: EUR/USD – Sell at 1.1830
EUR/USD - 1.1788
Original strategy :
Sell at 1.1830, Target: 1.1730, Stop: 1.1865
Position : -
Target : -
Stop : -
New strategy :
Sell at 1.1830, Target: 1.1730, Stop: 1.1865
Position : -
Target : -
Stop : -
As the single currency found support at 1.1728 after dropping sharply on Friday, suggesting consolidation above this level would be seen and recovery to the Kijun-Sen (now t 1.1809) cannot be ruled out, however, reckon previous support at 1.1830 would limit upside and bring another decline later, below 1.1750 would bring test of 1.1723-28 (previous support as well as 61.8% Fibonacci retracement of 1.1613-1.1910), break there would add credence to our view that top has been formed at 1.1910 last week, bring further fall to 1.1700 but reckon support at 1.1650 would hold.
In view of this, we are looking to sell euro again on recovery as 1.1830 previous support should limit upside. Above the lower Kumo (now at 1.1854) would defer and risk a stronger rebound to 1.1870 but price should falter below said last week’s high at 1.1910, bring another decline later.
Trade Idea Update: USD/JPY – Buy at 110.45
USD/JPY - 110.85
Original strategy :
Buy at 110.45, Target: 111.45, Stop: 110.10
Position : -
Target : -
Stop : -
New strategy :
Buy at 110.45, Target: 111.45, Stop: 110.10
Position : -
Target : -
Stop : -
Friday’s rally above 110.98 resistance signals a temporary low has been formed at 109.85 last week and consolidation above this level would be seen with mild upside bias for this rebound to bring retracement of recent decline, hence gain to 111.29-30 (previous resistance and 61.8% Fibonacci retracement of 112.20-109.85) is likely, however, break there is needed to add credence to this view, bring retracement of recent decline to 111.50 but price should falter below another previous resistance at 111.71.
In view of this, we are looking to buy dollar on dips as 110.40-50 should limit downside and bring another rise later. Below 110.15-20 would defer but only break of 110.00 would signal the rebound from 109.85 has ended, bring retest of this level, below there would extend recent decline to 109.70 and later towards 109.50.

Canadian Dollar Under Pressure After US, Canadian Job Data
The Canadian dollar has started the week with slight losses, as USD/CAD is trading at 1.2680, up 0.25% on the day. Canadian banks are closed for a holiday and there are no major US events on the schedule, so traders can expect an uneventful day from the pair. On Tuesday, the US releases JOLTS Jobs Openings., which is expected to edge lower to 5.66 million.
The markets were glued to employment numbers on both sides of the border on Friday, and the US releases were considerably stronger than the Canadian numbers. The Canadian dollar had recorded five consecutive weekly gains, but that streak ended, as the loonie slipped 1.7% last week. US Nonfarm Payrolls came in at 209 thousand, easily beating the estimate of 182 thousand. The unemployment rate edged lower to 4.3%, but wage growth remains soft, and was unchanged at 0.3%. On the Canadian side, the economy added 10.9 thousand jobs in July, but this missed the estimate of 13.1 thousand, and was well below the June reading of 45.3 thousand. There was some positive news, however, as Canada's unemployment rate dropped from 6.5% to 6.3%, its lowest level since 2008.
The strong US payrolls report has boosted the odds of a December rate hike, which are currently at 47%, up from 43% one week ago. With the Federal Reserve unlikely to raise rates before December, investor attention has shifted to the Fed's balance sheet, which stands at $4.2 trillion. Fed policymakers have broadly hinted at reducing purchases of bonds and securities starting in September, but San Francisco Fed President John Williams was more forthcoming about the Fed's plans, likely aimed at giving notice to the markets. In a speech on Wednesday, Williams said that the economy had "fully recovered" from the 2008 financial crisis and called on the Fed to start trimming the balance sheet "this fall". Williams added that the process would be gradual and would take four years to reduce the balance sheet to a "reasonable size". Other FOMC members have also come out in favor of the Fed starting to wind up its portfolio this fall.
Fed Speakers In Focus After Friday’s Jobs Data
- Futures buoyed by jobs data;
- Fed speakers have their say as wage growth continues to drag;
- Oil lower ahead of producers meeting in Abu Dhabi.
US futures are pointing a little higher on Monday, with the spill over from the July jobs report perhaps providing a small boost to sentiment at the start of the week.
The jobs report was quite well received on Friday despite suffering the same pitfall that has plagued the US recovery for years, inadequate wage growth. With this still lacking, the inflation numbers are unlikely to dramatically improve and the number of those within the Federal Reserve that are uncomfortable with the pace of tightening could grow. Investors are already unconvinced that we'll see another rate hike this year and unless something changes on wages and inflation, I don't see that changing any time soon.
Two of the more dovish members of the Fed that have already voiced concerns about this will be appearing on Monday. Neel Kashkari and James Bullard are both scheduled to speak today and I would be surprised if their concerns will have been eased by Friday's numbers. That said, with only Kashkari being a voting member on the FOMC and a known dove, there may be little to take away from the comments, unless of course he either strikes and unlikely hawkish tone or suggests others are coming around to his way of thinking.
Oil is more than 1% lower so far today as oil producers taking part in the output cut meet in Abu Dhabi to discuss compliance issues that could threaten the deal. Compliance until now has actually been very strong, much stronger in fact than many anticipated, but the longer the cuts last, the more challenging it is likely to become, especially if oil prices don't recover to the levels that officials expected.
Still, while oil is down on the day, it's still trading near a two-month high and has actually stabilised around $50 a barrel in WTI and $52.50 in Brent for more than a week. I don't think we can read too much into these small intra-day moves but should compliance become a bigger issue, then prices could plummet once again.
This week is looking a little quieter on the economic data side, with most of the notable releases coming later on, including all-important US inflation figures for July. The labor market conditions index and consumer credit numbers for the US are the only pieces of data still to come today.