
Sample Category Title
Japan Posted A Less-Than-Expected Trade Surplus In June
For the 24 hours to 23:00 GMT, the USD marginally rose against the JPY and closed at 110.75.
In economic news, Japan’s flash leading economic index advanced to a level of 106.3 in June, surpassing market expectations of a rise to a level of 106.2. In the prior month, the index had registered a level of 104.6. Further, the nation’s flash coincident index recorded a rise to a level of 117.2 in June, meeting market consensus and after recording a level of 115.8 in the prior month.
In the Asian session, at GMT0300, the pair is trading at 110.6, with the USD trading 0.14% lower against the JPY from yesterday’s close.
Overnight data indicated that Japan registered a (BOP basis) trade surplus of ¥518.5 billion in June, following a deficit of ¥115.1 billion in the prior month, while markets were expecting the nation to post a surplus of ¥571.5 billion.
The pair is expected to find support at 110.47, and a fall through could take it to the next support level of 110.35. The pair is expected to find its first resistance at 110.82, and a rise through could take it to the next resistance level of 111.05.
The currency pair is trading above its 20 Hr moving average and showing convergence with its 50 Hr moving average.

Switzerland’s Consumer Prices Fell Further In July
For the 24 hours to 23:00 GMT, the USD rose 0.16% against the CHF and closed at 0.9734.
On the data front, Switzerland's consumer price index (CPI) fell 0.3% on a monthly basis in July, in line with market expectations. In the previous month, the CPI had registered a drop of 0.1%. Also, the nation's total sight deposits inched down to a level of CHF578.6 billion in the week ended 04 August, from CHF579.1 billion in the previous week.
In the Asian session, at GMT0300, the pair is trading at 0.9728, with the USD trading 0.06% lower against the CHF from yesterday's close.
The pair is expected to find support at 0.9710, and a fall through could take it to the next support level of 0.9693. The pair is expected to find its first resistance at 0.9746, and a rise through could take it to the next resistance level of 0.9765.
Ahead in the day, traders will focus on Switzerland's unemployment rate data for July.
The currency pair is showing convergence with its 20 Hr moving average and trading above its 50 Hr moving average.

Loonie Trading Higher, Ahead Of Canada’s Housing Starts Data
For the 24 hours to 23:00 GMT, the USD rose 0.38% against the CAD and closed at 1.2680.
In the Asian session, at GMT0300, the pair is trading at 1.2665, with the USD trading 0.12% lower against the CAD from yesterday's close.
The pair is expected to find support at 1.2625, and a fall through could take it to the next support level of 1.2585. The pair is expected to find its first resistance at 1.271, and a rise through could take it to the next resistance level of 1.2755.
Looking ahead, Canada's housing starts data for July, slated to release later in the day, will grab a lot of market attention.
The currency pair is showing convergence with its 20 Hr and 50 Hr moving averages.

Daily Technical Outlook And Review: EUR/USD, GBP/USD, AUD/USD, USD/JPY, USD/CAD, USD/CHF, DOW 30, GOLD
A note on lower timeframe confirming price action...
Waiting for lower timeframe confirmation is our main tool to confirm strength within higher timeframe zones, and has really been the key to our trading success. It takes a little time to understand the subtle nuances, however, as each trade is never the same, but once you master the rhythm so to speak, you will be saved from countless unnecessary losing trades. The following is a list of what we look for:
- A break/retest of supply or demand dependent on which way you're trading.
- A trendline break/retest.
- Buying/selling tails ... essentially we look for a cluster of very obvious spikes off of lower timeframe support and resistance levels within the higher timeframe zone.
- Candlestick patterns. We tend to only stick with pin bars and engulfing bars as these have proven to be the most effective.
We typically search for lower-timeframe confirmation between the M15 and H1 timeframes, since most of our higher-timeframe areas begin with the H4. Stops are usually placed 1-3 pips beyond confirming structures.
EUR/USD
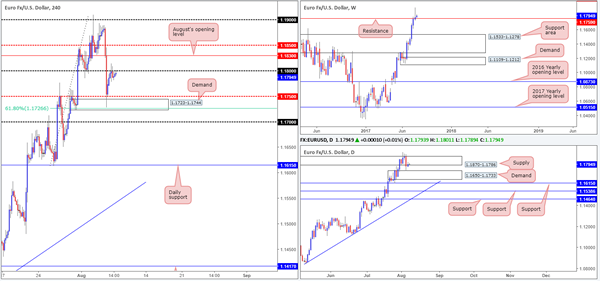
Recent action shows that the EUR/USD extended Monday's bounce from the H4 demand at 1.1723-1.1744 up to the 1.18 psychological band. As you can see, the bulls failed to sustain gains beyond this number, despite an earnest attempt seen going into the London open. Should the buyers succeed in bidding price higher today, they'll be faced with August's opening level marked at 1.1830, shadowed closely by the H4 mid-level number 1.1850.
Over on the weekly timeframe, we've yet to see any noteworthy response to last week's eye-catching selling wick that printed just above a resistance level coming in at 1.1759. The latest seen from the daily timeframe, however, reveals that price is now shaking hands with supply at 1.1870-1.1786, after bouncing from demand printed at 1.1650-1.1733.
Our suggestions: Given the lack of bearish intent seen so far at 1.18, as well as the noted daily supply suffering multiple upside breaks last week and weekly price trading above resistance, our desk feels it is not really a sellers' market right now, despite the weekly selling wick in view.
Regrettably, buying is also challenging at this time. Though we believe that 1.18 and the daily supply are fragile, it would be unwise for us to buy based on this theory. Waiting for the daily supply to be consumed before becoming a buyer is, in our opinion, the better path to take.
Data points to consider: No high-impacting news events scheduled on the docket today.
Levels to watch/live orders:
- Buys: Flat (stop loss: N/A).
- Sells: Flat (stop loss: N/A).
GBP/USD
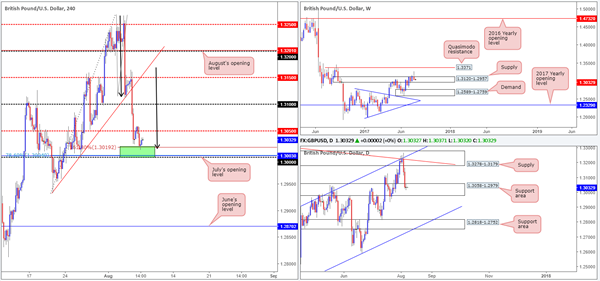
The latest coming out of the GBP/USD market shows H4 price to be crossing swords with an interesting buy zone marked in green at 1.30/1.3019. As we noted in Monday's report, this area is comprised of July's opening level at 1.3003, the large psychological boundary at 1.30, an AB=CD (black arrows) 161.8% Fib ext. at 1.3019, a 78.6% Fib retracement at 1.3004 which, collectively, is encased within a daily support area seen at 1.3058-1.2979.
Unfortunately, upon connecting with the said H4 buy zone, a H4 indecision candle printed forcing us to pass on the trade. As we explained yesterday, we were ideally looking for a full, or near-full bullish rotation candle before pulling the trigger.
Our suggestions: Technically speaking, the H4 candles will likely head for the nearby mid-level resistance at 1.3050 today. Thereafter, it will be difficult to judge direction since let's not forget that weekly price is currently trading from supply at 1.3120-1.2957.
Therefore, for those of you who ought the noted H4 buy zone, 1.3050 should be a level of interest. A break above could signal further buying up to 1.31, whereas a rejection could lead to H4 price challenging the 1.30 neighborhood and perhaps lower.
Data points to consider: No high-impacting news events scheduled on the docket today.
Levels to watch/live orders:
- Buys: Longs above 1.3050 are attractive.
- Sells: Flat (stop loss: N/A).
AUD/USD
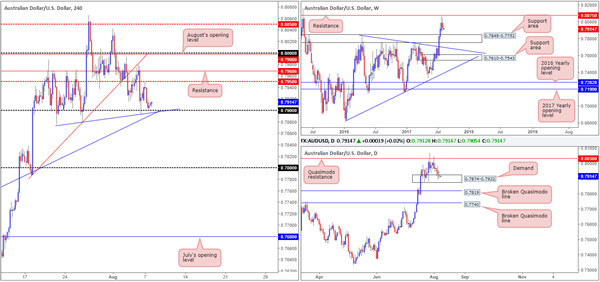
Kicking this morning's report off with a look at the weekly timeframe, we can see that since price came within a cat's whisker of connecting with resistance at 0.8075, the bears have made a notable stand. By the looks of things, further selling could be seen down to a support area coming in at 0.7849-0.7752. While this may be the case, down on the daily timeframe there is a slightly different picture being painted, as the unit is currently seen testing a demand base coming in at 0.7874-0.7922.Although there's been little bullish intent registered from here as of yet, we cannot rule out the possibility of an upside move being seen back up to the Quasimodo resistance level planted at 0.8030.
A closer look at price action on the H4 chart shines the spotlight on the 0.79 handle once again. This level has managed to withstand several bearish attacks, and now currently fuses with two trendline supports (0.7874/0.7635).
Our suggestions: A long at current price remains precarious. While this may seem bizarre given that there's a daily demand present and a reasonably attractive psychological support on the H4 timeframe, we have to keep in mind that weekly price is threatening to punch lower as well as a lack of enthusiasm being seen from the buyers on the daily timeframe at the moment. As a result, we've decided to remain flat for the time being.
Data points to consider: RBA Assist Gov. Kent speaks at 11.35pm GMT+1. Chinese trade balance – tentative schedule
Levels to watch/live orders:
- Buys: Flat (stop loss: N/A).
- Sells: Flat (stop loss: N/A).
USD/JPY
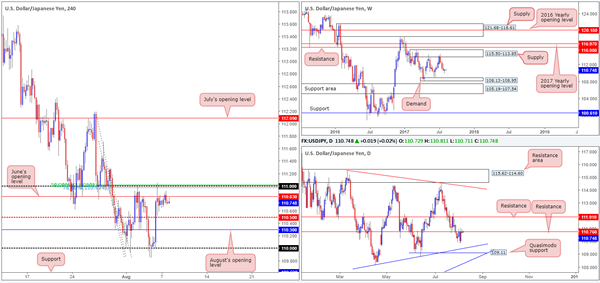
During the course of Monday's sessions, the H4 candles spent the majority of the day clinging to the underside of June's opening level at 110.83. As such, much of the following report will echo similar thoughts put forward in yesterday's analysis…
Since weekly price shook hands with supply at 115.50-113.85 five weeks ago, the market has been trading in the red. From our perspective, it looks as though price will continue to press lower until we reach a small demand base seen at 108.13-108.95. In conjunction with the weekly timeframe, the daily candles are currently seen kissing resistance penciled in at 110.76. This level, as you can see, has a strong history and therefore could hold the unit lower and clear the pathway south down to a Quasimodo support at 109.11 (converges closely with a trendline support taken from the low 108.13).
While June's opening level has managed to hold price action lower, the 111 handle seen directly above which houses a nice-looking H4 Fibonacci resistance cluster (50.0%/61.8%/78.6%) taken from the highs 112.19/111.71/111.28, is interesting.
Our suggestions: Put simply, we're looking for H4 price to tap 111 today and close back below June's opening level to short. The first take-profit target can be seen at the H4 mid-level support drawn from 110.50, which dependent on the size of the rejection candle from 111 (stops to be positioned above this candle), should give at least one times the risk down to 110.50, allowing you to move stops to breakeven and take partial profits.
Data points to consider: No high-impacting news events scheduled on the docket today.
Levels to watch/live orders:
- Buys: Flat (stop loss: N/A).
- Sells: 111 region ([wait for price to tap 111 and print a H4 close back below 110.83 before considering a short] stop loss: ideally beyond the candle's wick).
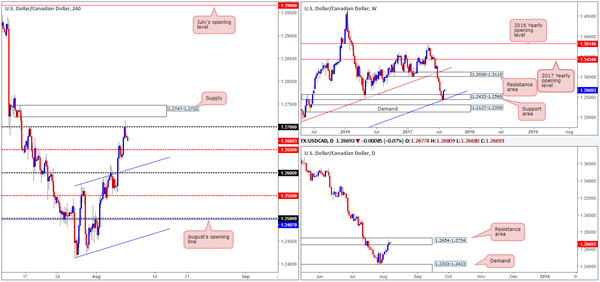
USD/CAD
Undeterred by the fact that daily price is currently trading from a resistance area seen at 1.2654-1.2734, the USD/CAD pushed higher on Monday, registering its sixth consecutive bullish candle! The strength behind this move, at least from a technical standpoint, is largely due to weekly price recently staging a stronger-than-expected bounce from the support area seen at 1.2433-1.2569.
The 1.27 handle seen drawn on the H4 timeframe suffered a minor breach going into yesterday's US open, missing the nearby H4 supply at 1.2747-1.2722 by only a few pips. As you can see, however, 1.27 managed to hold ground and remain intact going into the closing bell.
Our suggestions: To become buyers in this market, we would still prefer to see a clear break (close) above the current daily resistance area. Despite what the weekly timeframe suggests, buying into daily structure is a risk we're just not willing to take here.
Along similar lines, selling at current price is also not recommended. Not only do we have the nearby H4 mid-level support at 1.2650 to contend with, but we also have to compete with potential weekly buyers.
Technical elements are just too mixed at the moment, thus leaving us with little choice but to remain flat for now.
Data points to consider: No high-impacting news events scheduled on the docket today.
Levels to watch/live orders:
- Buys: Flat (stop loss: N/A).
- Sells: Flat (stop loss: N/A).
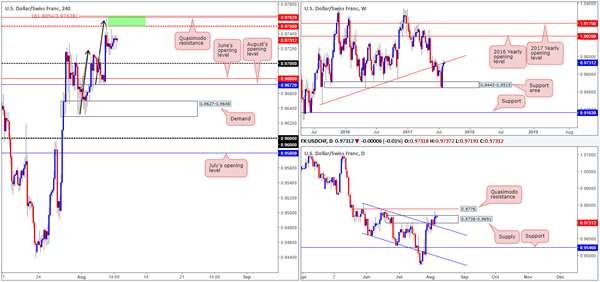
USD/CHF
USD/CHF prices are little changed this morning. The H4 candles spent the majority of Monday's segment consolidating inside a 35-pip range between the mid-level resistance at 0.9750 and the 0.97 handle. As we mentioned in yesterday's report, the after-effects of Friday's upbeat US job's report brought the pair to highs of 0.9763. Traders may have also noticed that the move connected with a H4 Quasimodo resistance level at 0.9762 and also a H4 AB=CD (black arrows) 161.8% Fib ext. at 0.9763.
The 0.9763/0.9750 region marked in green remains an area of interest to our desk for potential shorts this morning. This is largely due to the major weekly trendline resistance extended from the low 0.9257 seen in play at the moment. Our only concern is Friday's move above (whipsaw) daily supply at 0.9738-0.9691, which could lead to further buying up to a nearby daily Quasimodo resistance at 0.9776.
Our suggestions: The weekly trendline resistance, coupled with the noted H4 resistances in play, may force the US dollar to retest the 0.97 handle, and quite possibly June/August's opening levels at 0.9680/0.9672. We would be comfortable shorting this market if the unit retests the 0.9763/0.9750 region. Still, to be on the safe side, waiting for a H4 bearish candle to form from this area, preferably in the shape of a full, or near-full-bodied candle, is advised before pulling the trigger, since let's keep in mind that the daily Quasimodo resistance is positioned only 14 pips above the H4 sell green sell zone, hence a fakeout is possible.
Data points to consider: No high-impacting news events scheduled on the docket today.
Levels to watch/live orders:
- Buys: Flat (stop loss: N/A).
- Sells: 0.9763/0.9750 ([waiting for a H4 bearish candle to form, preferably either a full, or near-full-bodied candle, is advised] stop loss: ideally beyond the candle's wick).
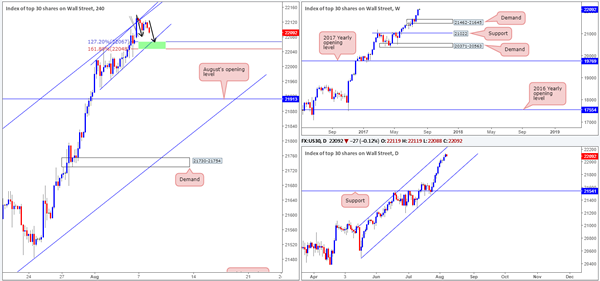
DOW 30
Of late, we've seen the US equity market ease off from two H4 converging ascending channel resistances. As highlighted in Monday's report, the first, the bigger of the two channels, can be extended from low/high 21273/21556. The second, the smaller version, can be drawn from low/high 21942/22019.
So, despite the index printing ten consecutive bull candles over the last two weeks, we may see the unit challenge the smaller neighboring channel support line today, which happens to converge with the potential AB=CD (black arrows) 127.2/161.8% Fib extensions marked in green at 22048/22067.
Our suggestions: With this market currently entrenched within an incredibly strong uptrend which shows little sign of decelerating, a buy from 22048/22067 is of interest to our desk this morning.
To avoid any fakeout through the buy zone, however, we would strongly recommend waiting for H4 price to chalk up a bullish candle in the shape of a full, or near-full-bodied candle. This, of course, will not guarantee a winning trade, but what it will do is show buyer intent from a high-probability buy zone.
Data points to consider: No high-impacting news events scheduled on the docket today.
Levels to watch/live orders:
- Buys: 22048/22067 ([waiting for a H4 bullish candle to form, preferably either a full, or near-full-bodied candle, is advised] stop loss: ideally beyond the candle's tail).
- Sells: Flat (stop loss: N/A).
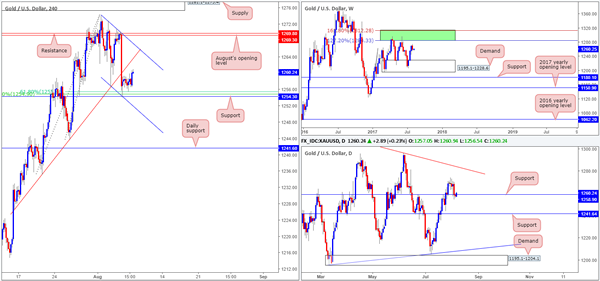
GOLD
The gold market was a relatively dull place to be on Monday. H4 price managed to remain afloat above the support level marked at 1254.3, which unties with a 61.8% Fib support at 1255.3 drawn from the low 1243.6, a 50.0% support value at 1254.9 extended from the low 1235.1 and a channel support taken from the low 1256.5. In recent hours the metal has extended north and now looks poised to challenge the neighboring channel resistance brought down from the high 1274.1.
A look at the daily chart shows price to be interacting with support at 1258.9. This – coupled with weekly price showing room for the metal to extend up to the green weekly resistance zone comprised of two Fibonacci extensions 161.8/127.2% at 1312.2/1284.3 taken from the low 1188.1, we believe the bulls will highly likely reach the aforementioned H4 channel resistance today.
Our suggestions: Unless a retest at the noted H4 support is seen, it is quite a difficult pair to buy at current price. Therefore, this is what we're ultimately looking for in this market today.
Levels to watch/live orders:
- Buys: 1254.3 region ([waiting for a H4 bullish candle to form, preferably either a full, or near-full-bodied candle, is advised] stop loss: ideally beyond the candle's tail).
- Sells: Flat (stop loss: N/A).
Daily Technical Analysis: EUR/USD Reaches Key POC Zone: Bearish Pullback Or Bullish Trend
Currency pair EUR/USD
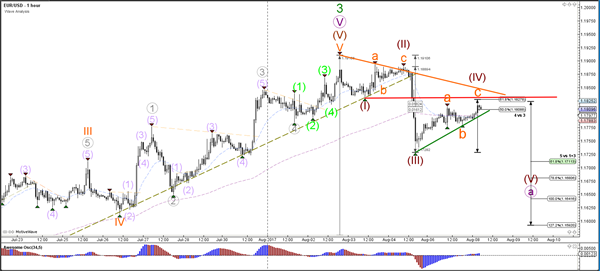
The bearish EUR/USD daily candle on Friday did have a bearish impact on Monday's price action and price is moving higher. There are, however, strong resistance trend lines (red/orange) present at 1.1825, which offers point of confluence (POC) that could turn price back down. The uptrend could still be alive if price manages to break above this POC zone and the previous top at 1.19.
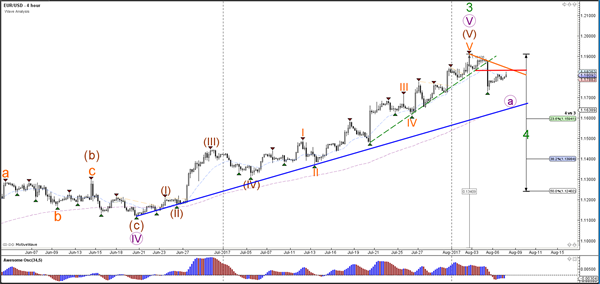
The EUR/USD could be building an ABC (orange) correction within wave 4 (brown). The bearish breakout below support (green) could indicate a wave 5 (brown) continuation to complete wave A (purple). The wave 4 is invalidated if price breaks above the 61.8% Fib and resistance line (red).
Currency pair USD/JPY
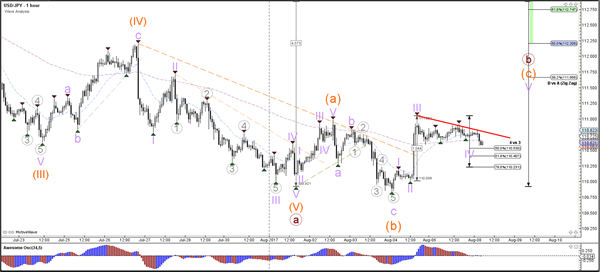
The USD/JPY is building an ABC (orange) zigzag within a larger ABC correction (brown).
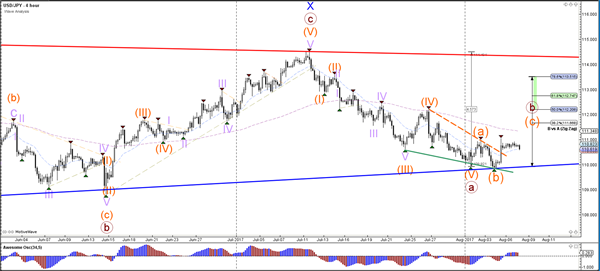
The USD/JPY is probably in a wave 4 (purple) as long as price stays above the top of wave 1 at 110.25. A more likely turning spot could be the 50% Fibonacci level of wave 4 vs 3.
Currency pair GBP/USD
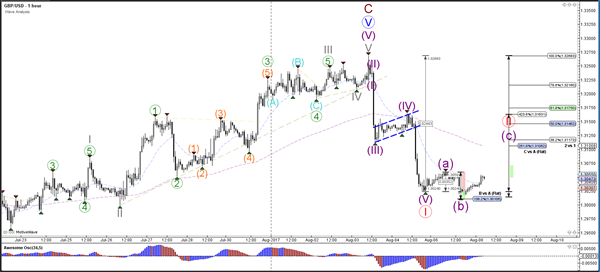
The GBP/USD could be in a bearish breakout via a wave 1-2 (red) after the Cable broke below the support trend line (dotted blue).
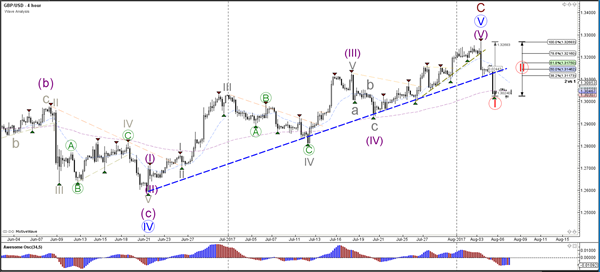
The GBP/USD seems to have completed 5 waves (purple) within wave 1 (red) and is now building a potential ABC (purple) within 2 (red).
Market Morning Briefing: A Very Quiet Day For All The Majors Going On
STOCKS
Dow (22118.42, +0.12%) has been inching up slowly towards initial resistance near 22200-22250 levels and could face slight dip from there. Overall near term trend is up.
Dax (12257.17, -0.33%) is likely to remain range bound within 12100-12400 levels for the coming sessions. Thereafter we prefer for a rise above 12400-12500 levels but would like to wait for further price confirmation. For now, sideways consolidation may continue in the near term.
Shanghai (3271.76, -0.23%) recovered sharply yesterday from levels near 3240. While the price remains above 3240, we can see a bounce to levels near 3300 again.
Nikkei (19992.17, -0.32%) has fallen from levels near 20100 which may act as a decent immediate resistance. Overall the broad 20200-19900 region may remain intact for the next 4-5 sessions at least.
Nifty (10057.40, -0.09%) could test 10000-9950 before again bouncing back towards current levels. Overall near term looks stable.
COMMODITIES
Neither Gold (1260) nor Silver (16.28) has moved at all in the last session with almost all the commodities, irrespective of the category, have taken a pause after sharp expansion of volatility in the last few days. Repeat - in case the Support at 1245 breaks for Gold, there will be a further dip to 1230 and 1210 levels respectively. Regarding Silver, as long as it trades below 16.50, the chances of further decline to 15.90 and then 15.660-30 look strong.
Copper (2.907) continues its consolidation in 2.85-2.92 but as discussed yesterday, it may soon resume the larger uptrend for the higher levels of 3.00-12. Immediate support comes at 2.78.
The net movement in Brent (52.17) and WTI (49.24) is almost nil in the last 24 hours. View remains unchanged. The bullish stance remains unchanged as long as Brent is trading above 48.70 and WTI above 45.50 levels on a weekly closing basis.
FOREX
A very quiet day for all the majors going on. Dollar Index (93.28) is stable but yet to rise above the resistance of 94.10-40 to negate the downside risks. Euro (1.1813) remains in a corrective phase as expected but as discussed yesterday, if the correction remains limited to 1.1600 levels, then the larger uptrend may resume after a few sessions.
Dollar-Yen (110.63) has barely moved as it keeps trading in the range of 109.30-111.10 and the wait for a breakout goes on which is expected to unfold a trending move.
Pound (1.3047) is consolidating at the lower levels after confirming a top at 1.3266 and the downside targets of 1.2950-30 remain unchanged.
Similar to Yen, Aussie (0.7919) continues its horizontal trading in the range of 0.7875-0.8050 with no particular directional preference but the larger uptrend may resume soon for the higher targets of 0.8100-70.
Dollar Rupee (63.80) enjoyed a corrective bounce to 63.80 yesterday but it may be short lived with sellers expected to return near 63.90-64.10.
INTEREST RATES
The US yields have come off slightly and could move down in the near term. The 5Yr (1.81%), 10Yr (2.26%) and the 30Yr (2.84%) may see some corrective fall in the coming sessions.
The UK-US 10Yr (-1.12%) is trading above support levels and could soon move up taking the Pound up with itself.
The German-US 10YR (-1.80%) has some more room on the downside and could come off along with Euro in the near term.
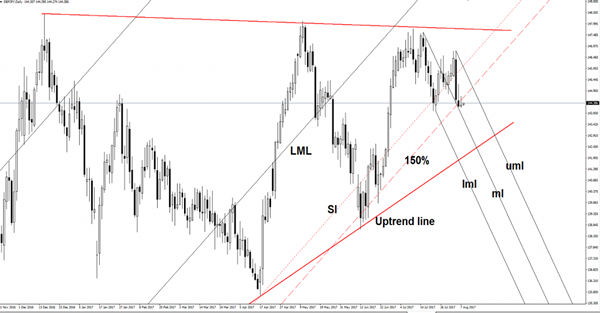
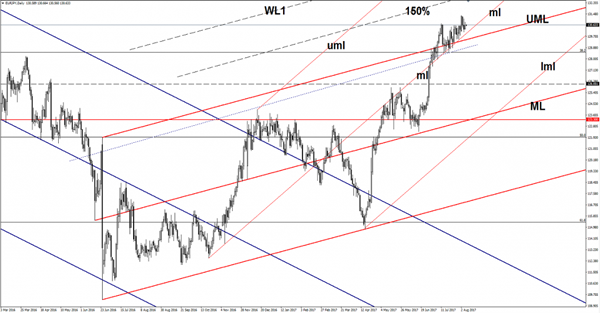
GBP/JPY On A Declining Path
The downside momentum was paused by the median line (ml) of the minor descending pitchfork. Now could come back to retest the upper median line (uml) before will drop much deeper. We may have a selling opportunity if will retest the broken 150% Fibonacci line (ascending dotted line), the next downside target will be at the uptrend line.
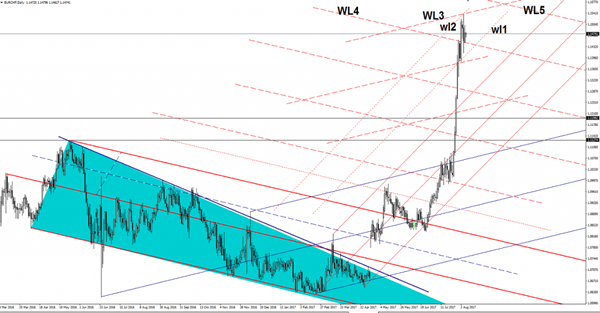
EUR/CHF Stabilized In The Green Zone
EUR/CHF increased on Monday and continues to stay in the buyer’s area. The rebound invalidated the Friday’s breakdown below the fourth warning line (WL4). However, the rate could still come down to test and retest the WL4 and the second warning line (wl2) of the minor ascending pitchfork.
The current drop was natural after the failure to reach the confluence are formed by the third warning line (WL3) of the major ascending pitchfork with the second warning line (wl2).
EUR/JPY Changed Little
Price posted some gains on Monday and maintains a bullish perspective because is located above some important dynamic support levels. Could come down to retest the support lines before will try to climb much higher.
EUR/JPY shows some exhaustion signs on the daily chart, but right now we don't have a reversal sign. We have a bearish divergence on the Daily chart, but is premature to say that we'll have another leg lower. Price could decrease again if the Nikkei stock index will decrease, today has jumped higher and is trading near the 20058 major static resistance.
JP225 is narrowing on the short term, a further increase towards the 20320 previous high will force the Yen to depreciate versus its rivals.
The Yen needs a bullish spark to be able to take the lead again, the Japanese Current Account could increase from 1.40T to 1.51T in June, while the Bank Lending could increase by 3.3%, matching the 3.3% growth in the former reading period. The Economy Watchers Sentiment could drop in the pessimism territory if will decrease from 50.0 points to 49.8 points.
You can see that has failed to stay much above the 130.76 previous high and now has come back down and could retest the median line (ml) of the minor ascending pitchfork. We have a bullish bias as long as it is trading above the median line (ml) and above the upper median line (UML) of the major ascending pitchfork, only a valid breakdown below these obstacles will open the door for a broader decrease.
Don’t Get Too Complacent, It’s Only Tuesday
Don't get too complacent; it's only Tuesday
The markets took Monday off after a frenzied NFP Friday. There remains a bit of confusion regarding Friday's dollar price action.However with EUR struggling to gain any momentum above 1.1800 overnight, it would suggest traders are still expecting a deeper USD correction, so the dollar bears are holding off for now.
The dollar remains tentatively bid post-NFP as dealers are likely more concerned with overcrowded dollar shorts that appear more brittle now than in anytime during the past 4-6 weeks
The data void overnight has certainly dampened enthusiasm in Forex markets. However, all eyes are looking towards Friday's US CPI print.Given the enormity of inflation metrics in the Fed's rates outlook, I suspect traders will be reluctant to commit big views before the event and even more so given August's sparse liquidity conditions
Equities continue to enjoy the 'Goldilocks Markets' as the Dow recorded its ninth straight record close. Certainly, investors are showing little concern for ' irrational exuberance.' but provided the Feds keep the money tap open, the party will rave on.
Fed Bullard rolled out this usual dovish rhetoric anguishing over the low-inflation environment while crediting the USD weakness entirely on EU economic growth and a hawkish ECB. Fed's Kashkari predictably waxed dovish on the low inflation low wage growth narrative. But investors could turn circumspect as the market prepares for the numerous possibilities around the US debt ceiling showdown.
Euro
No significant data to hang one's hat on today but dealers are setting sights on Draghi's highly anticipated speech at Jackson Hole. But given the two way USD risk due to a combination of thin August liquidity and crowded dollar short positioning makes for dangerous trading conditions. That said, I think the market is in agreement EUR strength should run further' which suggests that the EURO will remain bid on dips, little momentum in the markets which is clouding trader views.
That said, I think the market is in agreement EUR strength should run further implying the EURO will remain bid on dips, but little momentum in the market's traders views are clouded.
Australian and New Zealand Dollars
Both AUD and NZD are trading on the soft side following US NFP
The Kiwi has remained under pressure after New Zealand lowered their 2y Inflation expectations. But of course, the focus this week is on the RBNZ OCR on Wednesday. No policy shift is expected, but given the run of weak domestic data and a stronger local unit driven by a weaker US dollar, there is room for a dovish lean from the RBNZ in an attempt to influence the currency. The Kiwi's underperformance on the crosses would suggest this view also.
As for the Aussie, it's a very sparsely populated domestic macro calendar, so the market remains in wait and sees mode. But Low oil prices and a looming OPEC meeting continues to weigh massively on the Energy sector, and by proxy the commodity bloc.
Regional focus shifts to China trade figures due out later today
Japanese Yen
Extremely quiet trade and has barely budged over night. A sign that dealers are unwilling to engage and waiting for clearer signals.