Sample Category Title
Candlesticks and Ichimoku Trade Ideas Performance Update
4 positions were entered among all 4 currency pairs with total profit of 145 points and the positions are listed below:
2 Aug : USD/JPY - Short at 110.90, exited at 110.10 ( + 80 points)
2 Aug : EUR/USD - Short at 1.1850, exited at 1.1885 (- 35 points)
3 Aug : GBP/USD - Long at 1.3130, exited at 1.3130 ( 0 point)
3 Aug : EUR/USD - Short at 1.1880, exited at 1.1780 ( + 100 points)
| JPY EUR CHF GBP
Jan + 167 - 85 - 10 + 50
Feb + 200 +150 +93 - 59
Mar -23 -70 -23 - 35
Apr + 65 + 93 + 50 - 40
May - 65 - 35 + 100 -175
Jun -100 -10 - 10 +175
Jul + 85 - 35 - 8
Aug + 80 + 65 0
Sep
Oct
Nov
Dec
Y-T-D + 408 +68 +192 - 74
Trade Idea Wrap-up: USD/CHF – Buy at 0.9685
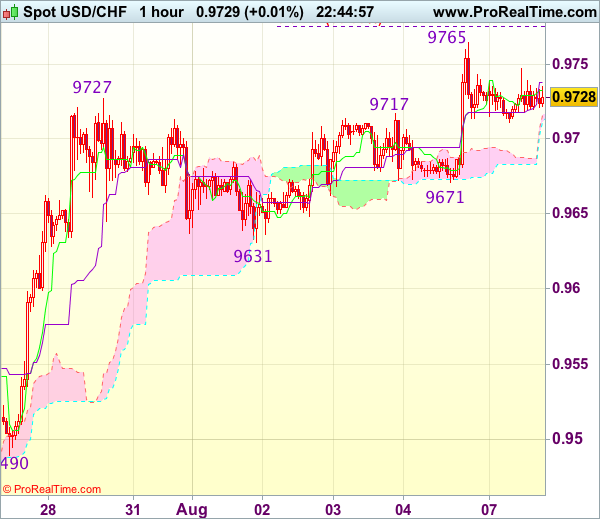
USD/CHF - 0.9725
Most recent candlesticks pattern : N/A
Trend : Near term up
Tenkan-Sen level : 0.9733
Kijun-Sen level : 0.9729
Ichimoku cloud top : 0.9718
Ichimoku cloud bottom : 0.9714
Original strategy :
Buy at 0.9685, Target: 0.9785, Stop: 0.9650
Position : -
Target : -
Stop : -
New strategy :
Buy at 0.9685, Target: 0.9785, Stop: 0.9650
Position : -
Target : -
Stop : -
Although the greenback has retreated after rising to 0.9765 on Friday and consolidation below this level would be seen, reckon downside would be limited to support at 0.9671 and bring another rise later, above said resistance at 0.9765 would signal recent upmove is still in progress, then further gain to 0.9775 (50% projection of 0.9438-0.9727 measuring from 0.9631) and later 0.9800-10 (61.8% projection) would follow but reckon 0.9830-40 would hold from here, bring another retreat later.
In view of this, would not chase this rise here and would be prudent to buy dollar on pullback as 0.9680-85 should limit downside. Below 0.9671 support would defer and suggest top is possibly formed, risk test of support at 0.9631 but break there is needed to add credence to this view, bring retracement of recent rise to 0.9596 (previous resistance turned support).
Trade Idea Wrap-up: GBP/USD – Sell at 1.3110
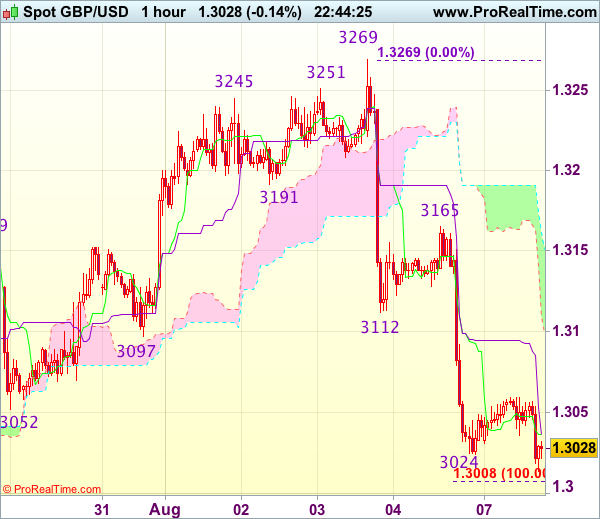
GBP/USD - 1.3023
Most recent candlesticks pattern : N/A
Trend : Near term down
Tenkan-Sen level : 1.3037
Kijun-Sen level : 1.3037
Ichimoku cloud top : 1.3162
Ichimoku cloud bottom : 1.3110
Original strategy :
Sell at 1.3110, Target: 1.3010, Stop: 1.3145
Position : -
Target : -
Stop : -
New strategy :
Sell at 1.3110, Target: 1.3010, Stop: 1.3145
Position : -
Target : -
Stop : -
As cable has remained under pressure after last week’s selloff from 1.3269 top, adding credence to our bearish view for this fall to bring retracement of recent upmove, hence bearishness remains for further decline to 1.3005-10 (100% projection of 1.3269-1.3112 measuring from 1.3165) but a break below support at 1.2999 is needed to retain bearishness, then subsequent fall to 1.2986 (61.8% Fibonacci retracement of 1.2812-1.3269) and possibly 1.2955-60 would follow.
In view of this, we are looking to sell cable on recovery as previous support at 1.3112 should limit upside. Only break of 1.3165 is needed to signal low is formed instead, bring a stronger rebound to 1.3200 but upside should be limited to 1.3240-50 and price should falter below said resistance at 1.3269.
Trade Idea Wrap-up: EUR/USD – Sell at 1.1830
EUR/USD - 1.1790
Most recent candlesticks pattern : N/A
Trend : Near term up
Tenkan-Sen level : 1.1796
Kijun-Sen level : 1.1771
Ichimoku cloud top : 1.1851
Ichimoku cloud bottom : 1.1841
Original strategy :
Sell at 1.1830, Target: 1.1730, Stop: 1.1865
Position : -
Target : -
Stop : -
New strategy :
Sell at 1.1830, Target: 1.1730, Stop: 1.1865
Position : -
Target : -
Stop : -
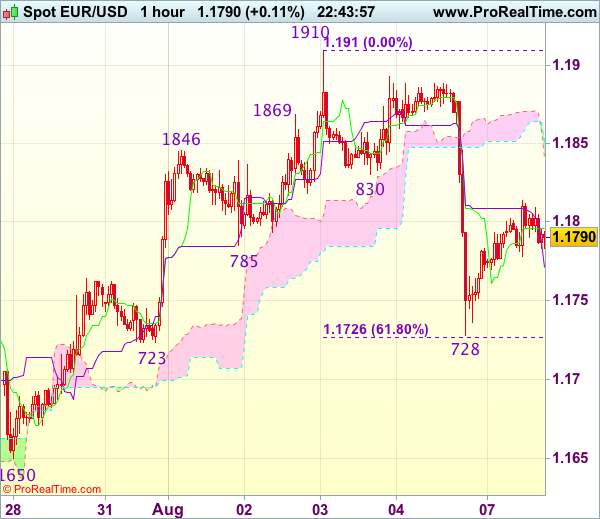
As the single currency found support at 1.1728 after dropping sharply on Friday, suggesting consolidation above this level would be seen and recovery to 1.1810-15 cannot be ruled out, however, reckon previous support at 1.1830 would limit upside and bring another decline later, below 1.1750 would bring test of 1.1723-28 (previous support as well as 61.8% Fibonacci retracement of 1.1613-1.1910), break there would add credence to our view that top has been formed at 1.1910 last week, bring further fall to 1.1700 but reckon support at 1.1650 would hold.
In view of this, we are looking to sell euro again on recovery as 1.1830 previous support should limit upside. Above the upper Kumo (now at 1.1851) would defer and risk a stronger rebound to 1.1870 but price should falter below said last week’s high at 1.1910, bring another decline later.
Trade Idea Wrap-up: USD/JPY – Buy at 110.45
USD/JPY - 110.71
Most recent candlesticks pattern : N/A
Trend : Near term down
Tenkan-Sen level : 110.79
Kijun-Sen level : 110.82
Ichimoku cloud top : 110.42
Ichimoku cloud bottom : 110.42
Original strategy :
Buy at 110.45, Target: 111.45, Stop: 110.10
Position : -
Target : -
Stop : -
New strategy :
Buy at 110.45, Target: 111.45, Stop: 110.10
Position : -
Target : -
Stop : -
Friday’s rally above 110.98 resistance signals a temporary low has been formed at 109.85 last week and consolidation above this level would be seen with mild upside bias for this rebound to bring retracement of recent decline, hence gain to 111.29-30 (previous resistance and 61.8% Fibonacci retracement of 112.20-109.85) is likely, however, break there is needed to add credence to this view, bring retracement of recent decline to 111.50 but price should falter below another previous resistance at 111.71.
In view of this, we are looking to buy dollar on dips as 110.40-50 should limit downside and bring another rise later. Below 110.15-20 would defer but only break of 110.00 would signal the rebound from 109.85 has ended, bring retest of this level, below there would extend recent decline to 109.70 and later towards 109.50.

Steady Global Economy
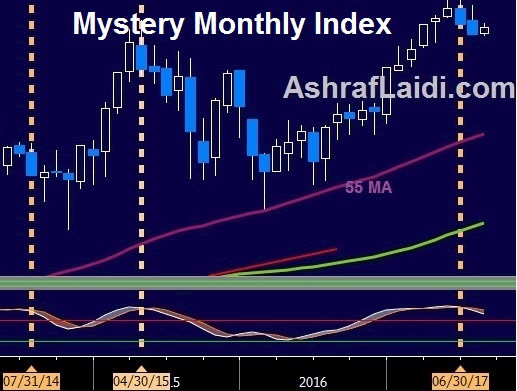
The twin upbeat jobs reports from the US and Canada on Friday underscored the momentum in the global economy and that shouldn't be lost in all the confusion about inflation. The US dollar was the top performer last week thanks to Friday's strong performance, while NZD, CAD and GBP were bunched up at the bottom of the pack. The RBNZ decision is on Wednesday, drawing attention to any fresh jawboning. It's a holiday in Australia and Canada to start the week. A new index trade with 3 supporting charts has been sent to the Premium subscribers. The chart below is the monthly chart of the instrument in question.
There is a temptation to lump together economic growth data and inflation. Historically, growth brings inflation and pushes interest rates higher. It's the backbone of economics 101. But that ignores the secular forces at work that are the real story. Globalization, automation, de-unionization and an excess of highly educated workers are deflationary drivers no matter if it's a recession or a growing economy. Central banks are slowly beginning to grasp it.
What's equally true is that many of those who are overly focused on inflation are missing the growth story. The US added another 209K jobs in July and Canada added 35K more full time jobs. There are jobs out there and it's a good environment for business.
Inflation and interest rates are a huge driver in the FX market but they're not the only driver. Growth is still a net positive and even if the US economy doesn't create any wage growth for 3 years, the dollar could still be the place to invest if growth is closer to 3% than 2%.
Commitments of Traders
Speculative net futures trader positions as of the close on Tuesday. Net short denoted by - long by +.
- EUR +83K vs +91K prior
- JPY -112K vs -121K prior
- GBP -29K vs -26K prior
- CHF -1K vs -2K prior
- AUD +61K vs +56K prior
- CAD +41K vs +27K prior
- NZD +35 vs +35K prior
The only sizeable shift was in the Canadian dollar and that combined with the lack of gains in the past week, make is wonder if the trade is overcrowded and due for a pullback. The US dollar side is a wildcard but if it can get any momentum, all the above currencies in a + position are vulnerable.
USD/JPY Mid-Day Outlook
Daily Pivots: (S1) 109.98; (P) 110.52; (R1) 111.19; More....
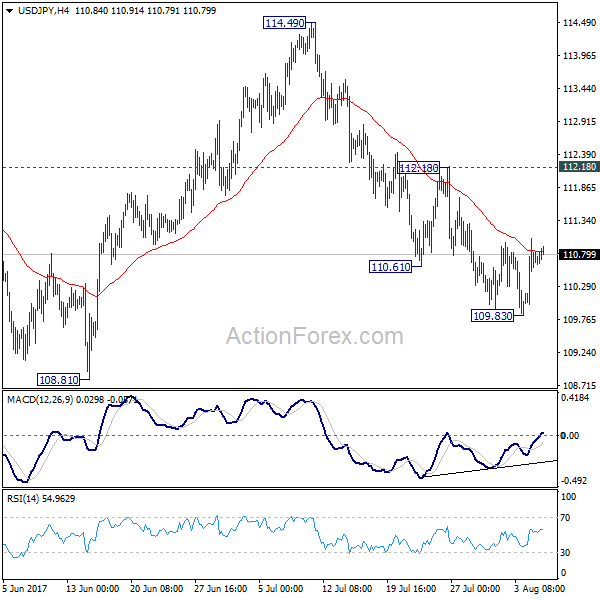
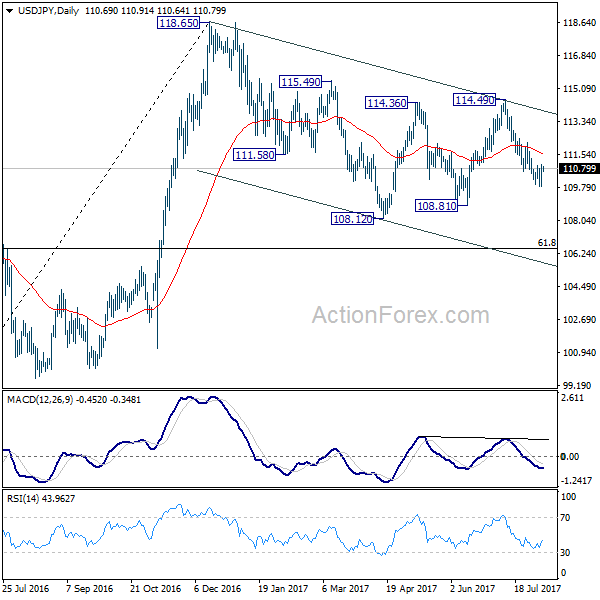
Intraday bias in USD/JPY remains neutral as consolidation from 109.83 temporary low might extends. Stronger rise cannot be ruled out. But still, near term outlook stays bearish as long as 112.18 resistance holds and deeper fall is expected. Break of 109.83 will target 108.81 support first. Break there will resume whole correction from 118.65 and target 61.8% retracement of 98.97 to 118.65 at 106.48. Nonetheless, break of 112.18 resistance will dampen our bearish view and turn focus back to 114.49 resistance instead.
In the bigger picture, the corrective structure of the fall from 118.65 suggests that rise from 98.97 is not completed yet. Break of 118.65 will target a test on 125.85 high. At this point, it's uncertain whether rise from 98.97 is resuming the long term up trend from 75.56, or it's a leg in the consolidation from 125.85. Hence, we'll be cautious on topping as it approaches 125.85. If fall from 118.65 extends lower, down side should be contained by 61.8% retracement of 98.97 to 118.65 at 106.48 and bring rebound.
Trade Idea: EUR/GBP – Sell at 0.9080
EUR/GBP - 0.9051
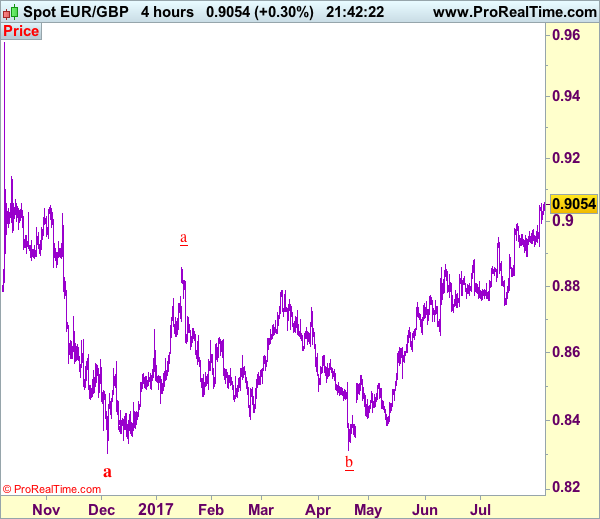
Recent wave: Major double three (A)-(B)-(C)-(X)-(A)-(B)-(C) is unfolding and 2nd (A) has possibly ended at 0.6936.
Trend: Near term up
New strategy :
Sell at 0.9080, Target: 0.8980, Stop: 0.9120
Position : -
Target : -
Stop : -
Although the single currency has risen again after brief retreat to 0.8995 and near term upside risk remains for recent upmove to extend gain to 0.9080, loss of near term upward momentum should prevent sharp move beyond 0.9100 and bring retreat later, below said support at 0.8995 would suggest top is possibly formed, bring test of 0.8965-70 but below 0.8945-50 is needed to add credence to this view, bring retracement of recent upmove towards support at 0.8922.
In view of this, would not chase this rise here and we are inclined to sell euro on next upmove. Above 0.9110-20 would risk gain to 0.9145-50, however, still reckon sharp move beyond there should not be repeated and upside should be limited to 0.9175-80, price should falter below 0.9100, bring correction later.
Our preferred count is that, after forming a major top at 0.9805 (wave V), (A)-(B)-(C) correction is unfolding with (A) leg ended at 0.8400 (A: 0.8637, B: 0.9491 and 5-waver C ended at 0.8400. Wave (B) has ended at 0.9413 and impulsive wave (C) has either ended at 0.8067 or may extend one more fall to 0.8000 before prospect of another rally. Current breach of indicated resistance at 0.9043 confirms our view that the (C) leg has ended and bring stronger rebound towards 0.9150/54, then towards 0.9240/50.
USD/CHF Mid-Day Outlook
Daily Pivots: (S1) 0.9677; (P) 0.9720; (R1) 0.9771; More...
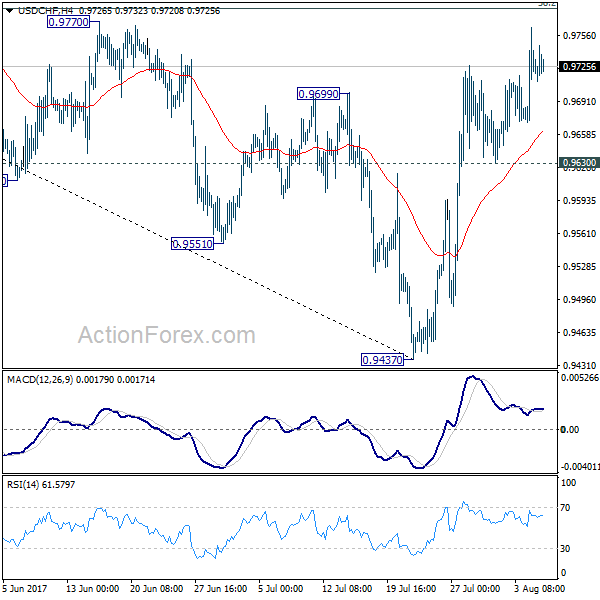
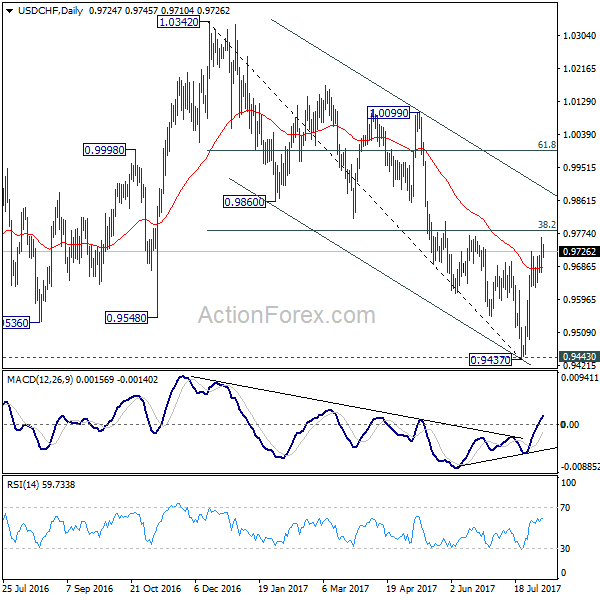
USD/CHF's rebound from 0.9437 is still in progress and intraday bias remains on the upside for 38.2% retracement of 1.0342 to 0.9437 at 0.9783 first. As noted before, prior break of 0.9699 resistance suggests near term reversal after defending 0.9443 key support. Break of 0.9783 will target channel resistance (now at 0.9887). On the downside, break of 0.9630 is needed to indicate completion of the rebound. Otherwise, outlook will stay cautiously bullish in case of retreat.
In the bigger picture, current development argues that USD/CHF has successfully defended 0.9443 key support level. And long term range trading in 0.9443/1.0342 is extending with another rise. At this point, there is no sign of an up trend yet. Hence, while further rise is expected in USD/CHF, we'll start to be cautious on loss of momentum above 61.8% retracement of 1.0342 to 0.9437 at 0.9996.
EUR/USD Mid-Day Outlook
Daily Pivots: (S1) 1.1702; (P) 1.1796 (R1) 1.1863; More...
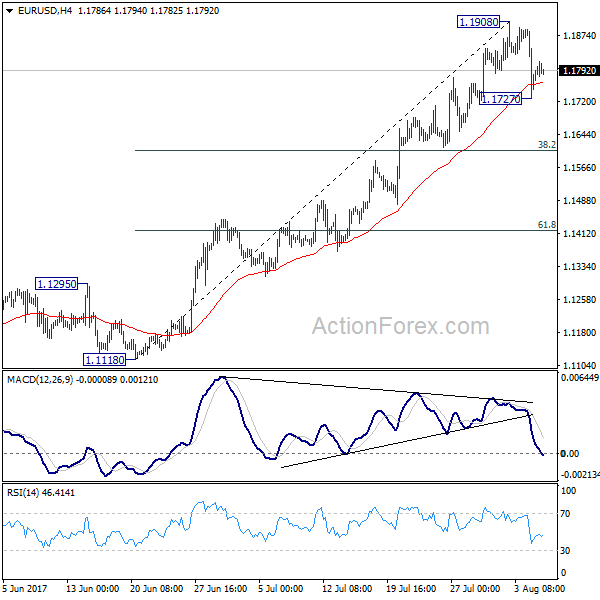
Intraday bias in EUR/USD remains neutral for the moment. As noted before, a short term top is formed at 1.1908 on divergence condition in 4 hour MACD. Deeper correction is expected as long as 1.1908 holds. Below 1.1727 minor support will turn bias to the downside for 38.2% retracement of 1.1119 to 1.1908 at 1.1606. We'd expect strong support there to bring rebound.
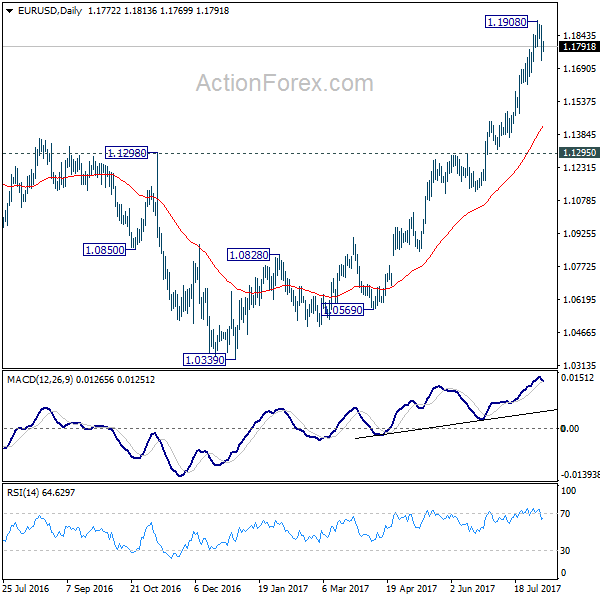
In the bigger picture, an important bottom was formed at 1.0339 on bullish convergence condition in weekly MACD. Sustained break of 55 month EMA (now at 1.1760) will pave the way to key fibonacci level at 38.2% retracement of 1.6039 (2008 high) to 1.0339 (2017 low) at 1.2516. While rise from 1.0339 is strong, there is no confirmation that it's developing into a long term up trend yet. Hence, we'll be cautious on strong resistance from 1.2516 to limit upside. But for now, medium term outlook will remain bullish as long as 1.1295 support holds, in case of pull back.