

Sample Category Title
Aussie Pulls Back On Softer Growth In Australian Consumer Prices
The aussie weakened in the middle of Asian trading as statistics out of Australia indicated that consumer prices experienced a surprisingly softer increase in the June quarter, justifying the RBA’s last decision to hold interest rates steady and lengthening the odds for another rate hike.
On Wednesday, in the middle of the Asian session, the Australia Bureau of Statistics published CPI readings for the second quarter of the year. According to the numbers, headline CPI grew by 0.2% on a quarterly basis, instead of 0.4% as expected, falling below the previous month’s mark of 0.5% and reaching the lowest growth since the beginning of 2016. The main driver of this adjustment was the decrease in travel and accommodation prices (-3.2%) as well as in automobile prices (-2.5%) which offset price rises in hospital and medical services (4.1%). On a yearly basis, CPI fell to 1.9%, surprising analysts who anticipated that inflation would climb to 2.2% from 2.1% in the previous quarter.
Excluding 30% of the volatile products, the trimmed mean CPI was in line with expectations, standing flat at 0.5% quarter-on-quarter, while the annual figure slipped from 1.9% to 1.8%. Reducing price volatility even more (50%), the weighted median CPI was higher at 0.5% compared to 0.4% in the previous quarter, as analysts anticipated. The yearly change beat the forecast of 1.7% which was also the first quarter’s figure, rising slightly to 1.8%.
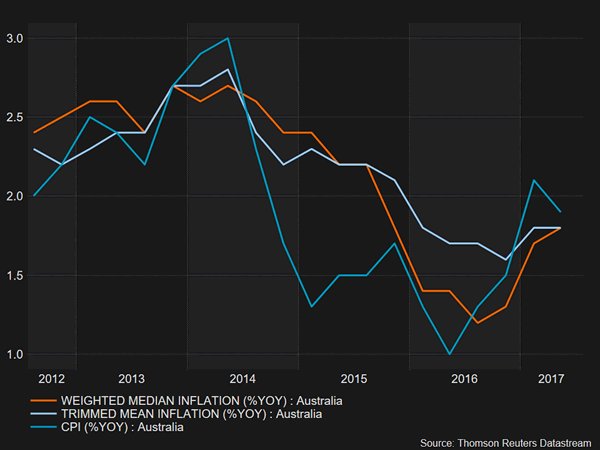
After the data release, the RBA Governor Philip Lowe said in Sydney he was “very comfortable” with holding interest rates steady at 1.5%, as inflation does not show any signs of approaching the target range of 2-3% so far. Instead, he stated, he was satisfied with the RBA’s accommodative policy as this strategy expands employment and therefore assists households to repay their debts which currently amount to 190% of their disposable income. Note that, full employment in June touched a multi-year high with unemployment remaining flat at 5.6%, while wage growth in the March quarter rose by 1.9% year-on-year for the third consecutive quarter. As the RBA Chief Philip Lowe and Deputy Governor Guy Debelle, who recently supported the view that there is no reason for the bank to follow its peers by tightening monetary policy, are in no rush to change their monetary strategy, the odds for another rate hike in the near future are receding.
Turning to the forex markets, the aussie reacted immediately to the data sinking by 0.50% against the dollar to $0.7896 and touching a one-week low.
AUD/USD Elliott Wave Analysis
AUD/USD – 0.7903
AUD/USD – Wave 5 of C and (B) has possibly ended at 1.1081
Aussie has rallied after finding decent demand at 0.7571 earlier this month and upmove has accelerated after breaking resistance at 0.7750 as well as last year’s high at 0.7835, adding credence to our bullish count for the medium term erratic rise from 0.6827 (2016 low) to bring retracement of early downtrend, hence gain to 0.8000 psychological level would be seen, break there would encourage for subsequent rise to 0.8100 but previous resistance at 0.8163 would hold from here due to near term overbought condition.
We are keeping our count that top has been formed at 1.1081 (wave 5 of V) and major correction (A-B-C-X-A-B-C) has commenced, indicated downside targets at 0.7945 (61.8% Fibonacci retracement of entire rise from 0.6007-1.1081) and 0.7750 had been met and downside bias is seen for further weakness to 0.6800, then 0.6700 but reckon 0.6500 would hold from here.
Our preferred count is that the rally from 0.6007 to 0.7270 (7 Jan 2009) is marked as wave A, the retreat to 0.6248 (2 Feb 2009) is wave B and the subsequent upmove is labeled as wave C with wave (iii) and wave (iv) ended at 0.8265 and 0.7700 respectively and wave (v) as well as 3 ended at 0.9407, then wave 4 ended at 0.8066 (instead of 0.8578). The wave 5 has met our indicated projection target of 1.1060 and could ended at 1.1081, this level is now treated as the peak of wave (C) as well as larger degree wave B, hence major fall in wave C has commenced, our initial downside target at psychological support at 0.7000 has just been met and further weakness to 0.6500 would be seen later.
On the downside, whilst initial pullback to 0.7830 (38.2% Fibonacci retracement of 0.7571-0.7990) cannot be ruled out, reckon 0.7780-86 (50% Fibonacci retracement and previous support) would hold and bring another rise later to aforesaid upside targets. A daily close below there would defer and risk correction to 0.7730-35 (61.8% Fibonacci retracement) but only break of another previous resistance at 0.7712 (wave i top) would confirm top has been formed.
Recommendation: Buy at 0.7800 for 0.8000 with stop below 0.7700.

Our alternate count on the daily chart treated the top formed in 2008 at 0.9851 could be a larger degree wave I and was followed by a deep and sharp correction in wave II to 0.6007 and wave III is unfolding from there.
The long-term uptrend started from 0.4775 (2 Apr 2001) with an impulsive structure. Wave I is labeled as 0.4775 to 0.9851 (15 Jul 2008), wave II has ended at 0.6007 (Oct 2008) and wave III is still in progress which may extend further gain to 1.1265.

Currencies: Dollar Decline Slows Going Into The FOMC Decision
Sunrise Market Commentary
- Rates: Fed's expected message largely discounted?
We expect the Fed to keep its policy unchanged tonight. Announcing the start of balance sheet tapering is a wildcard, but September might be the better fit. Subdued inflation could get more attention, but shouldn't keep the Fed from hiking its policy rate one more time this year. Such message should be rather neutral for markets and by and large discounted. - Currencies: Dollar decline slows going into the FOMC decision
The dollar traded volatile yesterday, but finally rebounded on a rise in US yields. Today, focus turns to the Fed's policy statement. The Fed will probably show its concern in the recent easing in inflation. However, the dollar already discounts quite some bad news. Is the time ripe for some USD bottoming?
The Sunrise Headlines
- Wall Street trading ended positive yesterday, supported by strong earnings figures. Overnight, Asian equities are trading more mixed with China and Korea in the red. US Treasuries stabilize ahead of the FOMC outcome later today.
- The Australian inflation increased by 0.2% Q/Q (1.9% Y/Y) in Q2, less than the expected 0.4% Q/Q (2.2% Y/Y). RBA chief Lowe said moves of other central banks to withdraw stimulus “has no automatic implications” for RBA policy.
- The US Senate rejected McConnell's health proposal at the start of several days of debate. The Senate will now vote on an amendment similar to a 2015 repeal bill passed by the Senate and vetoed by Obama. The vote is expected to fail.
- The IMF warns for significant downside risks to the EMU's economic outlook and urges the ECB to keep stimulus in place amid weak price pressures. ECB's Nowotny added the ECB shouldn't set a timetable for ending its bond purchases.
- Oil extended gains from the highest close in seven weeks as industry data showed U.S. crude stockpiles plunged, easing a glut. The Brent oil price is now around $50.60/barrel.
- The US House of Representatives overwhelmingly passed legislation to impose new sanctions on Russia, North Korea and Iran. The bill imposes new sanctions on Russia in response to the alleged meddling in the 2016 US election.
- The main event on the eco-calendar is the Fed FOMC meeting. Will the FOMC announce the starting date of the balance sheet tapering? The first estimate of the UK GDP for Q2 is the only data of importance
Currencies: Dollar Decline Slows Going Into The FOMC Decision
Fed statement a tipping point for the dollar?
The dollar traded volatile yesterday, but finally rebounded. A rise in core (US & EMU) yields supported USD/JPY. In US dealings, EUR/USD jumped temporary above 1.17, but a real test of the 1.1714/35 resistance didn't occur. A further rise in US yields after strong consumer confidence finally tilted the balance in favour of the dollar. The start of the debate on Obamacare was maybe also a minor support for the dollar. EUR/USD closed the session little changed at 1.1647. USD/JPY ended the session at 111.89, well off the sub-111 levels traded earlier in the session.
Asian equities trade mixed to slightly lower overnight. Japan and Australia outperform on a decline of their currencies. USD/JPY maintains yesterday's gain and trades just below 112. The rise of the oil price and of other commodities supports (US) yields and indirectly the dollar. The Aussie dollar doesn't profit from higher commodities. On the contrary, AUD/USD returned to the 0.79 area. Australian headline inflation unexpectedly dropped from 2.1% Y/Y tot 1.9% Y/Y (2.2% Y/Y expected). RBA governor Lowe also hinted that the RBA shouldn't join the tightening from other central banks. EUR/USD trades around 1.1635. The dollar maintains yesterday's rebound against the euro.
Markets will keep their focus on the Fed's policy statement this evening (see above for analysis). The Fed will keep its policy rate unchanged. Markets will closely monitor the central bank's assessment on the recent softer inflation data. We expect the Fed to be more concerned on inflation, but to keep the door open for a December rate hike. The FOMC might give more information on the start of the balance sheet tapering, even as an announcement in September is most likely. The market implied probability of a December rate hike is currently less than 50%. We don't expect to Fed to be that soft that markets reduce expectations further. If (ST) US interest rates bottom, one might assume that there is also quite some negative news discounted for the dollar. Especially USD/JPY might find some support if US rates bottom out. The story for EUR/USD is different as markets ponder the next steps of ECB policy normalisation to be announced in autumn. The jury is still out, but yesterday's price action of the dollar overall and of EUR/USD in particular suggests the dollar decline has already gone quite far. There is more really good US eco news needed to trigger a sustained USD rebound. However, assuming that the Fed statement won't be overly soft, we expect no sustained break of the key 1.1714/35 resistance already now
USD: technical picture remains fragile, but …
EUR/USD rebounded above the 1.1300/66 resistance at the end of June. Recent US data were not good enough to trigger a sustained USD rebound. Finally EUR/USD broke beyond a first important resistance at 1.1489/1.15, paving the way to the LT-correction tops at 1.1616/1.1714. A sustained break would end the long consolidation that followed the sharp decline of EUR/USD in 2014/early 2015. Such a key area is not easy to break. We don't preposition for a break, but the pressure is mounting. Return action below 1.13 would be a first indication of a loss in upside momentum.
USD/JPY rebounded in the 108.13/114.37 range after the June 14 Fed meeting. The pair regained interim resistance at 112.13, but follow-through gains remained modest. USD/JPY 114.37 resistance was tested, but rejected. The pair drifted lower in the broader consolidation pattern between 114.50 and 108.83/13. Yesterday, this correction halted. The jury is still out, but a short-term test/break of the key 108.83/13 support is becoming less likely. We look out whether the bottoming out process will be confirmed after the Fed decision/statement.
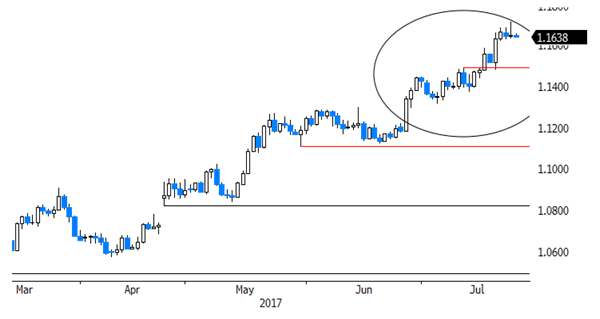
EUR/USD: top MT consolidation pattern under heavy strain, but no break yet
EUR/GBP
UK Q1 GDP data in focus for sterling trading
Sterling showed no clear directional trend yesyterday. EUR/GBP hovered in the mid 0.89 area, stabilizing within reach of the recent low against the euro (EUR/GBP 0.8994). Cable initially rebounded on USD softness but declined as the USD staged a comeback later in the session. UK eco data/stories were mixed and had no lasting impact on sterling trading. EUR/GBP closed the session little changed at 0.8943. Cable finished the session at 1.3025.
Today, the first estimate of the UK Q1 GDP will be published. UK growth is expected at 0.3% Q/Q and 1.7% Y/Y (0.2% Q/Q and 2.0% Y/Y in Q1). We don't have strong arguments to take a different view from the consensus. A figure in line with consensus (or softer) is probably enough for the BoE to maintain its waitand- see approach at next week's BoE meeting. In theory, this might be slightly negative for sterling. That said, before EUR/GBP make further progress beyond 0.90, a further rise of EUR/USD is probably needed. Assuming that the Fed won't be overly soft this evening, a sustained break higher for EUR/GBP is currently not that likely.
From a technical point of view, EUR/GBP broke above the 0.8854/66 resistance (2017 top) to set a new correction top north of 0.89, but the rally slowed at the end of last week. A break below 0.8720 would suggest that upside momentum is easing. For now, we don't see a trigger for a sustained rebound of sterling against the euro. We still look to buy EUR/GBP on more pronounced dips. For that to happen, EUR/GBP probably needs some help from a correction in EUR/USD
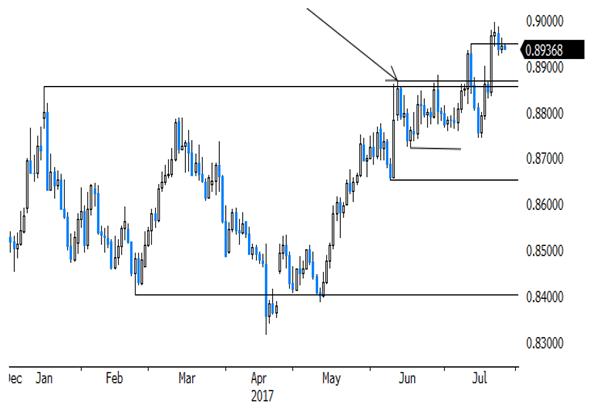
EUR/GBP: consolidation near recent top
USDCAD In Downtrend, Consolidates Near Key 1.25 Level
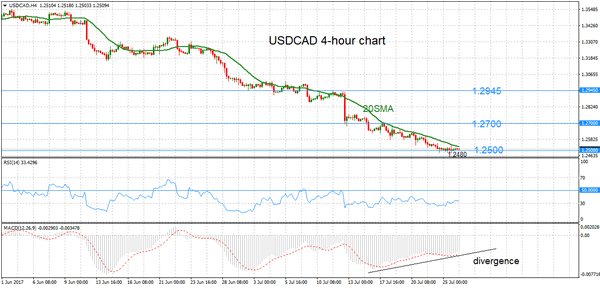
USDCAD is in a clear downtrend after making lower highs and lower lows for the past two months. On the 4-hour chart, the downside bias is showing signs of exhaustion though. A low of 1.2480 was reached on July 25 and the market is expected to consolidate around this level in the near term.
The MACD is indicating divergence, as it is sloping upwards while USDCAD is sloping downwards. This suggests that downside is limited for now and short-term bottoming is possible to turn the bias back to the upside as long as support holds at 1.2480. Of course, the round-level at 1.2500 is an important area around which prices are pivoting.
Upside moves may be limited as the market is capped by the falling 20-period moving average. Key resistance levels are located at 1.2700 and 1.2945.
The technical picture remains bearish, as the 20SMA is sloping downwards and both RSI and MACD are in bearish territory (below 50 and below zero respectively). Further downside cannot be ruled out at this stage as there are no signs of a reversal in the current downtrend. A break below the July 25 low of 1.2480 would open the way towards the May 2016 low of 1.2460.
Technical Outlook: US Crude Oil Holds Firm On Wednesday, Eyes US Crude Inventories For Fresh Signals
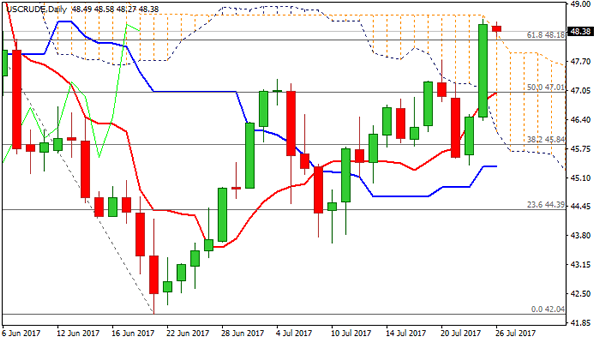
WTI Oil holds firmly above $48.00 and probes above the top of thick daily cloud, following yesterday’s 4.4% rally (the biggest one-day rally since 30 Nov).
Strong bullish sentiment on announcement from Saudi Arabia about reducing exports in August and attempts from OPEC to support and possibly extend its output cut plan, boosted oil prices.
Strong bullish signal was generated on Tuesday’s break and close above $48.18 (Fibo 61.8% of $51.98/$42.04 descend) with close above daily cloud needed for further bullish signals.
Bulls may extend towards next strong barrier at $49.43 (200SMA) and may retest psychological $50.00 barrier in extension.
Meanwhile, corrective easing could be expected as slow stochastic is entering overbought territory on daily chart.
Broken 100 SMA ($47.95) marks solid support, followed by former tops at $47.72 and $47.30 and $46.80 (Fibo 38.2% of $43.63/$48.65 upleg / 10/55SMA bull-cross) which should contain extended dips.
Res: 48.65, 49.43, 49.63, 50.00
Sup: 48.18, 47.95, 47.72, 47.30
Trade Idea: GBP/USD – Sell at 1.3100
GBP/USD – 1.3027
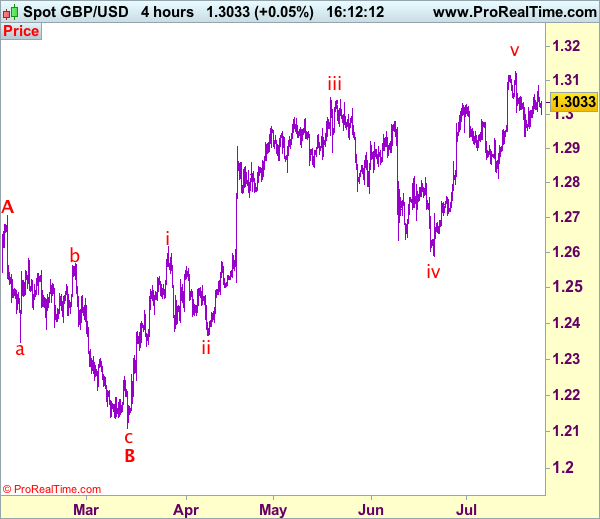
Recent wave: Wave V of larger degree wave (III) has ended at 1.1986 and major correction has commenced from there for gain to 1.3000 and 1.3140-50
Trend: Near term up
Original strategy :
Sell at 1.3090, Target: 1.2890, Stop: 1.3150
Position: -
Target: -
Stop: -
New strategy :
Sell at 1.3100, Target: 1.2900, Stop: 1.3160
Position: -
Target: -
Stop:-
Although cable has retreated after meeting resistance at 1.3084 yesterday, reckon 1.2980-85 would limit downside and near term upside risk remains for another bounce to 1.3090-00, however, as long as indicated resistance at 1.3126 holds, prospect of a retreat remains, below 1.2980-85 would bring test of 1.2950-55, break there would signal the rebound from 1.2933 has ended, bring another test of this level, break there would add credence to our view and extend the fall from 1.3126 top to 1.2910-15, break there would provide confirmation, then further decline to 1.2870-80 would follow but reckon support at 1.2812 would remain intact.
Our preferred count on the daily chart is that cable's rebound from 1.3500 (wave (A) trough) is unfolding as a wave (B) with A ended at 1.7043, followed by triangle wave B and wave C as well as wave (B) has ended at 1.7192, the subsequent selloff is the larger degree wave (C) which is still unfolding with minor wave (III) of larger degree wave 3 ended at 1.1986, hence wave (IV) correction is in progress which could either be a triangle wave (IV) of a complex formation but upside should be limited to 1.3500 and price should falter well below 1.4000, bring another decline in wave (V) of 3 for weakness to 1.1500, then 1.1200.
On the upside, whilst marginal gain above 1.3084 cannot be ruled out, price should falter below 1.3100 and bring another retreat later. A break above last week’s high of 1.3126 would signal recent upmove is still in progress and may extend headway to 1.3150, then towards 1.3190-00 but loss of upward momentum should limit upside to 1.3250, bring another retreat later.
NZDUSD Pauses Uptrend, Rising 50-Day Moving Average Supports Bullish Bias
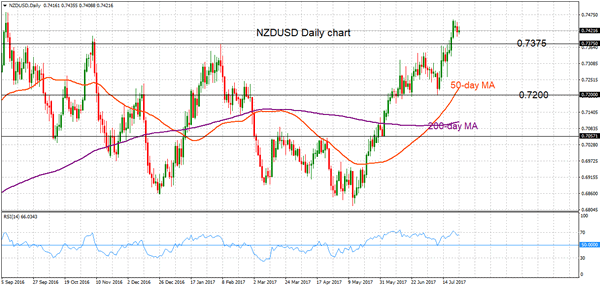
NZDUSD has been in an uptrend since the May 11 low of 0.6816 to the July 21 high of 0.7457. There was a slight corrective move lower from this peak as the market reached overbought levels, which was indicated by the RSI rising above 70.
The technical picture remains bullish as there was a bullish crossover of the 50-day moving average with the 200-day MA on July 5. The loss in upside momentum suggests some consolidation in the near term with immediate support expected at 0.7392 (July 21 low).
Failure to clear the 0.7457 high increases the risk of a short-term top being put in place, especially amidst overbought conditions in the market. However, only a break below the key psychological level of 0.7200 would start to shift the bullish bias. An important support level comes in at 0.7057. For now there are no clear signs of a shift in the May to July uptrend.
Looking at the bigger picture, NZDUSD needs to continue trading above 0.7375 in order to maintain the current bias. Falling back below this level would bring the bias to neutral. A sustained break of 0.7457 is needed in order to open the way to target the September 2016 high of 0.7484. The rising 50-day moving average supports a bullish bias.
Trade Idea: GBP/JPY – Hold short entered at 145.90
GBP/JPY - 145.80
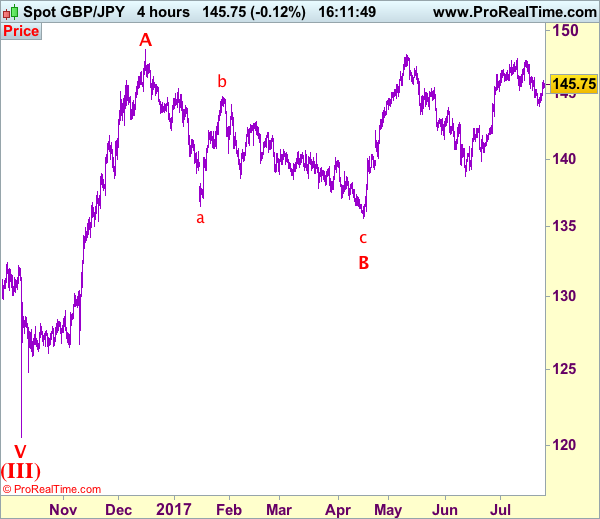
Recent wave: Medium term low formed at 120.50 and (A)-(B)-(C) major correction has commenced with (A) leg ended at 148.45, hence wave (B) is unfolding for retreat to 131.00-10.
Trend: Near term up
Original strategy:
Sold at 145.90, Target: 143.90, Stop: 146.50
Position: - Short at 145.90
Target: - 143.90
Stop: - 146.50
New strategy :
Hold short entered at 145.90, Target: 143.90, Stop: 146.50
Position: - Short at 145.90
Target: - 143.90
Stop:- 146.50
Although sterling found support at 144.05 and has staged a strong rebound and marginal gain from here cannot be ruled out, as long as resistance at 146.30 holds, mild downside bias remains for another retreat, below 145.00 would bring test of 144.50 but break there is needed to signal the rebound from 144.05 has ended, bring retest of this level later. A drop below 144.05 would add credence to our view that a temporary top has been formed at 147.75 earlier this month, bring retracement of recent upmove to 143.50, then towards support at 143.30.
In view of this, we are holding on to our short position entered at 145.90. Above resistance at 146.30-35 would abort and signal low is formed instead, bring a stronger rebound to 146.90-00 and possibly towards 147.30.
Our preferred count is that larger degree wave V with circle is unfolding from 251.12 with wave (I) 219.34, (II): 241.38 and wave (III) is subdivided into 1: 192.60, 2: 215.89 (23 Jul 2008) and wave 3 ended at 118.87 earlier in 2009. The correction from there to 162.60 is wave 4 which itself is a double three and is labeled as first a-b-c ended at 151.53, followed by wave x at 139.03, 2nd a ended at 162.60, 2nd b at 146.75 and 2nd c leg of wave 4 ended at 163.00. Therefore, the decline from 163.00 to 116.85 is now treated as wave 5 which also marked the end of larger degree wave (III), hence wave (IV) major correction has commenced for retracement of the wave (III) from 241.38 and upside target at 183.95-00 (50% Fibonacci retracement of the wave (II) from 241.38) had been met, a drop below 160.00 would suggest wave (IV) has ended at 195.85, bring decline in wave (V) for initial weakness to 130 (already met) and 120.
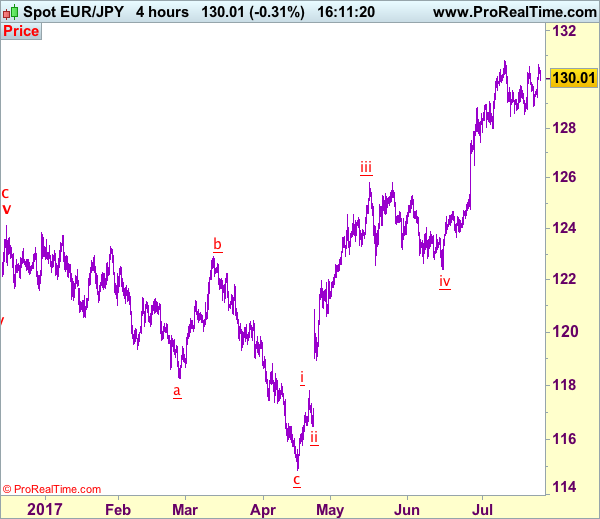
Trade Idea: EUR/JPY – Stand aside
EUR/JPY - 130.02
Recent wave: wave v of (C) ended at 94.12 and major correction in wave A has ended at 149.79
Trend: Near term up
New strategy :
Stand aside
Position: -
Target: -
Stop:-
Although the single currency rose briefly to 130.59, lack of follow through buying on break of previous resistance at 130.51 has retained our view that further consolidation below recent high of 130.77 would be seen and near term downside risk is for weakness to 129.25, then a test of 128.57 support, however, break of support at 128.49 is needed to signal top has been formed and bring retracement of recent upmove to 128.00, then towards previous support at 127.44.
On the upside, whilst recovery to 129.60-70 cannot be ruled out, reckon 130.00 would limit upside and resistance at 130.51 should hold, bring another decline later. Only a break of 130.51 would signal the retreat from 130.77 has ended, bring retest of this level, break there would confirm recent upmove has resumed for headway to 131.00-10, then towards 131.50, however, loss of upward momentum should prevent sharp move beyond latter level and reckon 132.00 would hold from here, risk from there is seen for a retreat later.
Our latest preferred count is that wave (ii) is ABC-X-ABC which ended at 123.33 and wave (iii) is unfolding with wave iii ended at 100.77, followed by wave iv at 111.57 and wave v as well as the wave (iii) has ended at 97.04, followed by wave (iv) at 111.43 and wave (v) has ended at 94.12 which is also the end of the larger degree v, this also implied the major wave (C) has also ended there, hence major correction has commenced from there with (A) leg unfolding in its lower degree wave c which has possibly ended at 145.69. Under this count, A-B-C wave (B) has commenced with A leg ended at 136.23, wave B at 143.79 and wave C has possibly ended at 149.79.
Our larger degree count is that the decline from 139.26 is wave (C) and is sub-divided into a diagonal triangle i-ii-iii-iv-v with wave i - 105.44, wave ii- 123.33, wave iii - 97.03, wave iv - 111.43, followed by the final wave v as well as the end of wave (C) at 94.12, this also mark the bottom of larger degree wave B. Under this count, major rise in wave C has commenced as an impulsive wave with minor wave III ended at 145.69, wave V is still in progress for further gain to 150.00. Having said that, this so-called wave V could well be the first leg of larger degree 5-waver wave C and this wave C should bring at least a retest of wave A top at 169.97 (July 2008).
Fed Policy Decision And UK GDP In Focus
Asian shares were mostly mixed during early trading on Wednesday, while the Greenback held steady ahead of the Federal Reserve decision later today which is largely expected to conclude with monetary policy unchanged. With it already being considered a foregone conclusion that US interest rates will be left unchanged in July and no press conference scheduled by Janet Yellen, today’s FOMC meeting is likely to be a non-event. Although the absence of a press conference and no new summary of economic projections may take away a chunk of the excitement, investors most probably will use this opportunity to closely scrutinize the policy statement for clues on the Federal Reserve’s tightening plan.
Many questions still remain unanswered over both the timings and pace of rate hikes which may weigh on the minds of Fed watchers ahead of the rate decision. Markets will also be paying very close attention to see if the policy statement offers any fresh details on how and when the Federal Reserve plans to normalize its $4.5 trillion balance sheet. Any unexpected surprises from the policy statement may come in the form of inflation concerns as the central bank acknowledges the fall in inflation and the impact it has on reaching their 2% inflation target.
Sterling pressured ahead of GDP data
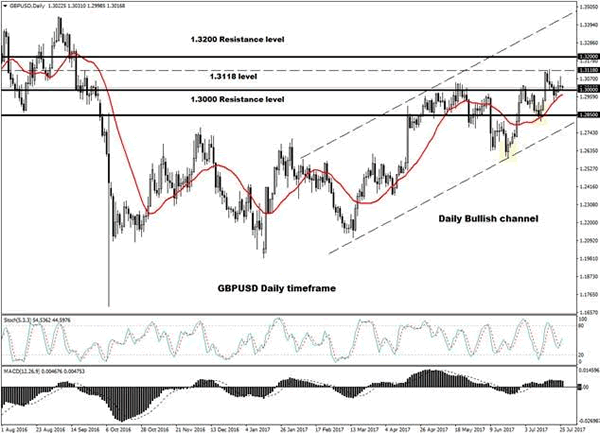
Sterling dipped towards 1.3000 during Wednesday’s trading session as investors became anxious ahead of the release of the UK Q2 GDP numbers. The story around the Sterling continues to revolve around Brexit-based uncertainty, political risk, and weakness in UK economic fundamentals that continue to weigh heavily on the currency. The preliminary UK GDP data will be in focus and is expected to show that the economy grew by 0.3% in the second quarter of 2017. A reading that prints below market consensus is likely to quell expectations of the BoE raising UK interest rates in the near term. From a technical standpoint, the GBPUSD remains at risk of depreciating lower once bears conquer the 1.3000 psychological level. A breakdown and daily close below 1.3000 should encourage a further deprecation lower towards 1.2850.
WTI Crude sprints towards $48.50
WTI Crude bulls were unleased during Tuesday’s trading session with prices lurching to eight-week highs above $48.50 after the American Petroleum Institute (API) reported that US Crude stocks fell sharply last week. The upside momentum was supported by optimism over Saudi Arabia pledging to make deeper cuts to its crude exports in August, which inspired oil bulls to attack further. While OPEC and Non-OPEC members may be commended once again by exploiting oil’s sensitivity to generate speculative boosts in prices, this could come at a heavy cost if oil markets fail to rebalance.
With the oversupply concerns still a major theme that continues to fuel the bearish sentiment towards oil and markets remaining anxious over higher production volumes from other oil producers, WTI Crude still remains exposed to downside risks.