Sample Category Title
Trade Idea: AUD/USD – Buy at 0.7800
AUD/USD – 0.7899
Recent wave: Wave 5 ended at 1.1081 and major correction has commenced for fall to 0.7000 and then towards 0.6500-10
Trend: Near term up
Original strategy :
Buy at 0.7840, Target: 0.7990, Stop: 0.7780
Position: -
Target: -
Stop: -
New strategy :
Buy at 0.7800, Target: 0.7990, Stop: 0.7740
Position: -
Target: -
Stop:-
As aussie has retreated after meeting resistance at 0.7971 yesterday, retaining our view that further consolidation below recent high at 0.7990 would be seen and pullback to 0.7840-50 cannot be ruled out, however, reckon downside would be limited to 0.7800 and support at 0.7786 should hold, bring another rise later, above 0.7971 would bring retest of 0.7990, break there would extend recent upmove to 0.8040-50 but loss of upward momentum should prevent sharp move beyond 0.8080 and reckon 0.8100 would hold from here. We are keeping our latest bullish count that recent impulsive waves is unfolding as (1 2, (i)(ii), i ii) and may extend headway to aforesaid upside target.
In view of this, would not chase this rise here and we are looking to buy aussie on subsequent pullback as 0.7800 should limit downside, bring another upmove later. Below support at 0.7786 would defer and suggest wave iii top is formed, bring correction in wave iv to 0.7750 but wave i top at 0.7712 should remain intact.
On the 4-hour chart, the move from 0.8066 is the wave 5 with i: 0.8860, ii: 0.8315, wave iii is an extended move ended at 1.0183, iv: 0.9706 and wave v has ended at 1.1081 (also the top of entire wave 5). The subsequent selloff is the major correction which is unfolding as ABC-X-ABC and 2nd A leg has ended at 0.8848, followed by a-b-c wave B which ended at 0.9758, hence, 2nd C wave is now in progress and indicated downside target at 0.7000 and 0.6950 had been met, so further fall to 0.6710-20 cannot be ruled out.

Forex Technical Analysis: EUR/USD, USD/JPY, GBP/USD
EUR/USD
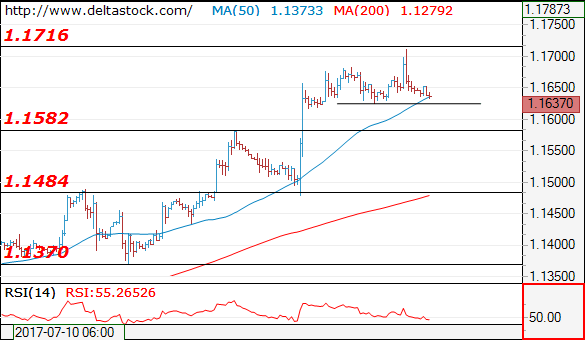
Current level - 1.1637
Yesterday's peak below 1.1716 resistance signals a reversal and my outlook is already bearish, for a break through 1.1620, towards 1.1580, en route to 1.1480 support zone.
| Resistance | Support | ||
| intraday | intraweek | intraday | intraweek |
| 1.1720 | 1.1720 | 1.1580 | 1.1370 |
| 1.1720 | 1.1720 | 1.1480 | 1.1290 |
USD/JPY
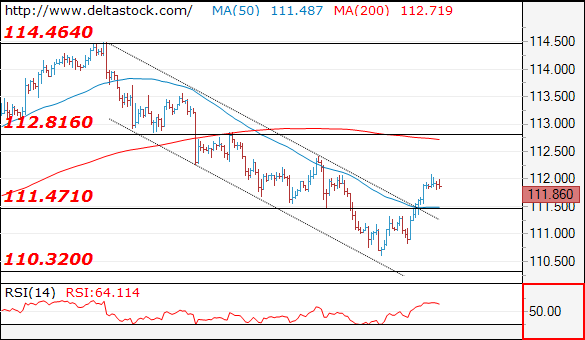
Current level - 111.86
The violation of 111.47 hurdle shows a reversal of the whole downtrend from 114.46 and the bias is positive, for a corrective pattern towards 112.80 resistance. Initial intraday support lies at 111.47.
| Resistance | Support | ||
| intraday | intraweek | intraday | intraweek |
| 112.05 | 114.50 | 111.47 | 110.30 |
| 112.80 | 115.50 | 110.30 | 108.10 |
GBP/USD
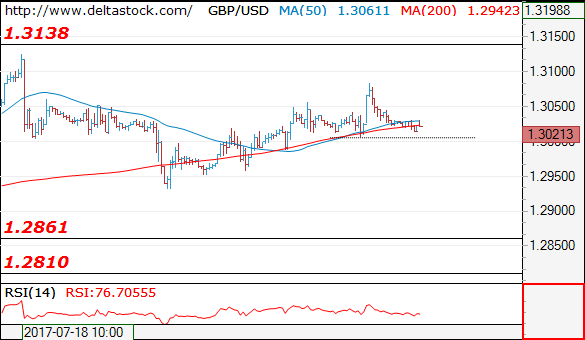
Current level - 1.3021
The recent peak at 1.3082 should be considered a finale of the consolidation rebound above 1.2930 and my outlook is bearish, for a break through 1.3000, towards 1.2860.
| Resistance | Support | ||
| intraday | intraweek | intraday | intraweek |
| 1.3050 | 1.3260 | 1.3007 | 1.2810 |
| 1.3130 | 1.3500 | 1.2810 | 1.2480 |
Dollar Gains Ground Ahead Of FOMC, Aussie Suffers On Softer Inflation
Inflation figures out of Australia were today's main data release during Asian session trading. The softer than expected data led to the aussie posting losses. Beyond that, the dollar index seems to be maintaining some positive momentum following yesterday's upbeat consumer confidence report.
The dollar's index against a basket of currencies was up 0.2% as Asian traders were about to complete their trading day. It stood above the 94 mark, but not far above 93.64, the 13-month low reached yesterday. Against the yen, the US currency was not much changed. Dollar/yen last eyed the 112 handle. Yesterday the pair finished the day 0.7% higher. The Federal Reserve will complete its two-day meeting later in the day. It is widely expected to maintain interest rates at their current levels and investors will mainly focus on rate guidance throughout the rest of the year, as well as on details regarding when it will start reducing the size of its balance sheet.
Political developments have in large part been driving the dollar to a significant extent recently and new deliberations by the US Senate to repeal and replace Obamacare will also be watched by forex market participants.
In other dollar pairs, euro/dollar and pound/dollar were last down 0.2% and 0.1% on the day. Yesterday, euro/dollar rose to its highest since late August 2015 when it hit 1.1712, while pound/dollar climbed to a more than one-week high of 1.3083.
Moving to today's major release during the Asian session, Australian consumer prices rose 1.9% year-on-year in the second quarter of the year. This fell short of expectations for a rise by 2.2% and was also below the two-and-a-half-year high of 2.1% during the first quarter of the year. On a quarterly basis, the inflation rate stood at 0.2% in the second quarter, below the 0.4% expected and the previous quarter's 0.5%. The Australian dollar fell on the data relative to its US counterpart. Aussie/dollar last traded at 0.7892, down 0.6% on the day.
New Zealand trade data for June showed the country posting a trade surplus of NZ$242 million during the month. The local dollar edged slightly higher relative to the US dollar upon release of the data. Kiwi/dollar last traded at 0.7423, up on the day though not by much.
Turning to commodities, gold was last down 0.3%, trading at $1245.04 an ounce. WTI and Brent crude were both up 0.8% and 1.0%, at $48.38 and $50.61 respectively. Both benchmarks finished the day higher in the two preceding days, recording considerable gains.
Beyond the FOMC statement upon completion of the Fed's meeting, UK preliminary GDP estimates for the second quarter of the year and the Energy Information Administration's (EIA) weekly report on US crude stockpiles will also be in focus.
XAUUSD Intraday Analysis
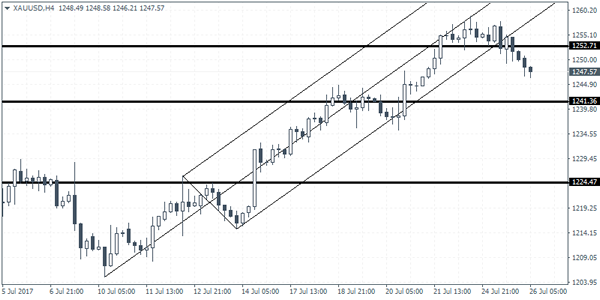
XAUUSD (1247.57): Gold prices were seen slipping for a second consecutive day. This follows the doji candlestick that was formed on Monday. The bearish descent could signal a near-term decline in gold prices towards 1241.36 support level. In the near term, any upside gains could be seen capped near the 1252.71 which could act as resistance. Below 1241.36, gold prices could be seen slipping towards the 1224.47 level. This marks a major support level that could be tested in the near term.
GBPUSD Intraday Analysis
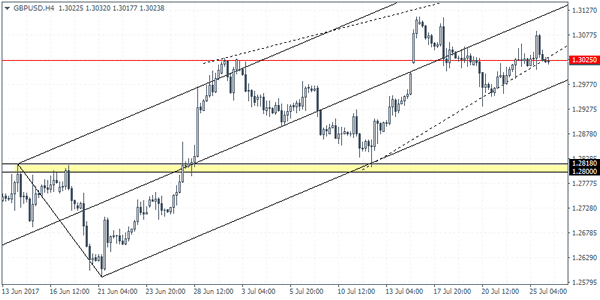
GBPUSD (1.3023): The British pound attempted to rally above 1.3025,but the gains were capped. GBPUSD posted a session high to 1.3083 before giving up the gains to settle rather flat. Price action could be seen pushing lower as a result, off the current resistance level. The rising wedge pattern signals a move to the downside with 1.2656 staying in focus. On the 4-hour chart, yesterday's rally has led to a lower high being formed. This suggests that the downside momentum could gather pace. Watch for a daily close below 1.3025 following which, GBPUSD could be ready for a move to the downside.
EURUSD Intraday Analysis
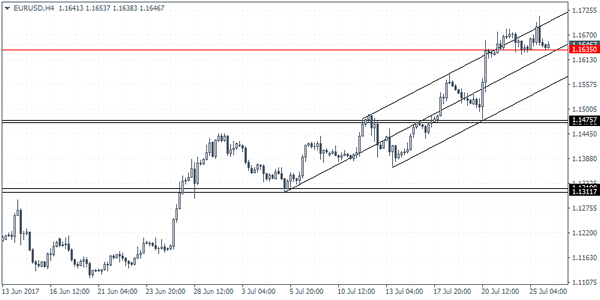
EURUSD (1.1646): The EURUSD posted a fresh two-year high yesterday as price rallied briefly to a session high of 1.1712 before giving up most of the gains. The strong price action and the subsequent failure to keep to the gainssuggests that the upside momentum is fading. The support level at 1.1635 continues to remain in focus as currently EURUSD is seen falling back to this level. Another leg to the upside, which if results in a lower high could suggest the head and shoulders pattern forming on the 4-hour chart. The breakdown below 1.1635 will signal a move towards the support level at 1.1475 which is yet to be tested currently.
Risk-On Sentiment Returns?
Relatively positive earnings and economic data released on Tuesday brought a risk-on sentiment back, as data reinforced confidence in the strength of the global economy. The FOMC will be looking to weigh robust global growth against poor inflation and mixed US. economic data. The Markets expect the Fed to keep rates unchanged, with clues to the fate of its balance sheet being foremost. With a rate hike unlikely, the markets will focus on the Fed's statement, looking for signs of when the Fed will begin paring its massive bond holdings and next raise rates. The Markets will be closely watching US advance Q2 growth estimates on Friday to see if the economy really is recovering. Adding further to a heavy USD; President Trump's son Donald Jr. and former Trump campaign Chairman Paul Manafort will go before a Senate committee on Wednesday to answer questions in regards to Trump's Presidential campaign and possible collusion with Russia.
EURUSD climbed to a high on Tuesday of 1.17118 not seen in more than 2 years. Currently EURUSD has backed off its highs to currently trade around 1.1640.
USDJPY rose on Tuesday to trade as high as 111.684, the highest level it has reached in more than a week. JPY weakness has carried on overnight with USDJPY currently trading around 112.00.
GBPUSD saw its highest level in over a week, reaching a high on Tuesday of 1.30835, before retracing lower. Currently, GBPUSD is trading around 1.3020.
AUDUSD dropped 0.5% to trade as low as 0.78873, following the release of inflation figures and a speech by the country's central bank governor. Australia's Q2 headline inflation rose less than expected from a year earlier. Reserve Bank of Australia Governor Philip Lowe said “his global counterparts' moves to withdraw stimulus from their economies has no automatic implications for policy Down Under”. Currently, AUDUSD is trading near its Wednesday lows.
Gold dropped over 0.4% on Tuesday to trade as low as $1,248.96, before rebounding higher. Currently, Gold is trading around $1,246.
Oil also moved higher on Tuesday, posting the biggest intraday gain in more than a week, as Saudi Arabia pledged deep crude export cuts next month and US supplies are seen to be declining. WTI gained over 3% on the day to trade as high as $47.92pb, its largest gain in nearly a month. Crude inventories declined by 10.2 million barrels last week in the American Petroleum Institute report released Tuesday, resulting in Oil climbing overnight with WTI currently trading around its Wednesday high at $48.40pb.
At 11:30 BST the UK National Statistics Office will release UK Gross Domestic Product (QoQ) (Q2) & (YoY) (Q2). The market consensus is expecting the QoQ release to be 0.3% from the previous 0.2%, whereas the Year on Year release is forecasting 1.7%, a drop from the previous release of 2.0%. As a broad measure of UK economic activity, a falling GDP number will be seen as negative for the value of GBP.
At 21:00 BST, the 2 day FOMC meeting will finish, with the markets waiting for the press release that follows that will include the Fed Interest Rate Decision. The markets are not expecting any hike today and the CME Fedwatch tool is showing a less than 50% probability of a rate increase before the end of 2017.
Traders Await More Cues From FOMC Meeting. UK GDP In Focus
The US dollar managed to post a pullback following a string of losses in the previous sessions. The modest two-day recovery in the greenback saw the currency stabilizing. Politics continues to dominate the sentiment as the US Senate passed a motion to repeal the Obamacare or the Affordable Care Act.
Oil prices also edged higher yesterday after Saudi Arabia reiterated its commitment to maintain the crude oil export limit. The weekly crude oil inventory report is due to be released today with expectations of a drawdown of 3.3 million.
Looking ahead, economic data today includes the preliminary second quarter GDP data from the UK. Economists polled expect to see a 0.3% quarterly GDP growth rate in the period ending June. However, the GDP data could be weaker than expected.
Later in the day, the Federal Reserve will be releasing its monetary policy statement. No changes are expected but the Fed could signal that it will continue with its tightening policy. This includes further clarity that could be given on the balance sheet normalization.
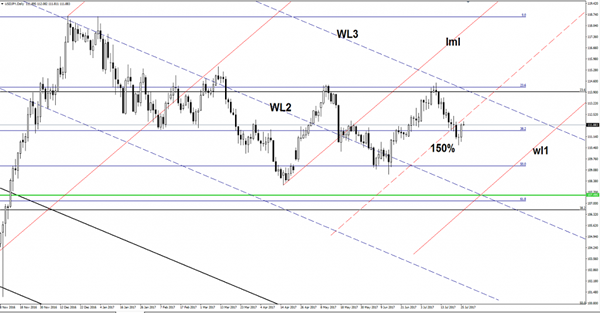
USD/JPY Still Sideways
Continues to move sideways on the short term, between the 23.6% and the 50% retracement levels, is trading at the half of this range. We’ll have a clear direction once we’ll have a valid breakout from the extended sideways movement. Remains to see if this is an accumulation or a distribution movement. Personally I’m waiting to see what will happen on the Nikkie, which is narrowing around 20058 static resistance.
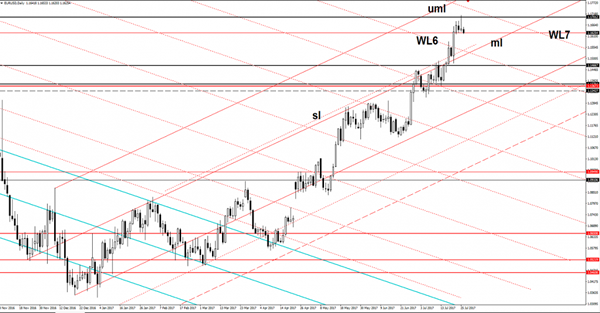
EUR/USD Could Turn To The Downside
Price found temporary resistance right below the 1.1700 level and could lose altitude as the USDX is trying to recover as much as can before the FOMC Statement. However the perspective is bullish as long as is located above the median line (ml) of the ascending pitchfork, only a valid breakdown will signal a reversal.
Technically, is somehow expected to decrease at least till the median line (ml) after the failure to reach the 1.1712 long term resistance and the upper median line (uml) of the ascending pitchfork, but unfortunately the fundamental factors will drive the price.