Sample Category Title
Market Update – European Session: UK Q2 Advance GDP In-Line But Shows Lackluster Growth
Notes/Observations
Fed decision in focus. Dealers await for clues on whether the Fed might raise rates again this year, and when it will begin paring its massive bond portfolio
European confidence data mixed (France misses, Italy beats)
UK Q2 Advance GDP in-line with consensus (QoQ: 0.3%; YoY: 1.7%
RBA will not be peer-pressured into tightening policy
Overnight
Asia:
Australia Q2 CPI data softer than expected; Q/Q: 0.2% v 0.4%e; Y/Y: 1.9% v 2.2%e
Reserve Bank of Australia (RBA) Gov Lowe: RBA does not need to follow other central banks in policy moves. Welcomed a recent pick up in the labour market, although subdued wages and high household debt meant that policy rates would stay lower for longer
Bank of Japan Deputy Gov Nakaso: Reiterates still long way to go to meet 2% inflation target and will persistently pursue current powerful easing
Europe:
EU Commissioner Oettinger (Germany): the UK is legally obligated to pay for the current EU budget, and the assumption is that UK payments to continue. UK leaving EU will create €10-12B gap in EU budget after 2020
Americas:
House of Representatives approved new sanctions bill on Russia, Iran and North Korea (as expected)
Republicans secured enough votes to begin debate on Healthcare vote
Senate Republican plan to repeal and replace Obamacare failed to get votes needed for approval (43 in favor and 57 against). Senate rejected the health-bill amendment with the Cruz and Portman plans
President Trump: Chair Yellen is definitely still in the running for the new Fed Chair term; Economic adviser Cohn and two or three other candidates remain potential
Energy:
Weekly API Oil Inventories: Crude: -10.2M v +1.63M prior
Economic Data
(JP) Japan July Small Business Confidence: 50.0 v 49.8e (1st non-contraction in 4 months)
(SG) Singapore Jun Industrial Production M/M: 9.7% v 3.6%e; Y/Y: 13.1% v 8.5%e
(CH) Swiss Jun UBS Consumption Indicator: 1.38 v 1.32 prior
(FR) France July Consumer Confidence: 104 v 108e
(ES) Spain Jun Adjusted Retail Sales Y/Y: 2.5% v 2.2%e; Retail Sales Y/Y: 2.8% v 3.9% prior
(DK) Denmark Jun Retail Sales M/M: No est v 0.1% prior; Y/Y: No est v 1.6% prior
(SE) Sweden Jun Trade Balance (SEK): 4.3B v 1.8B prior
(IT) Italy July Consumer Confidence Index: 106.7 v 106.3e; Manufacturing Confidence: 107.7v 107.0e; Economic Sentiment: 105.5 v 106.3 prior
(CH) Swiss July Credit Suisse Survey Expectations: 34.7 v 20.7 prior
(UK) Q2 Advance GDP Q/Q: 0.3% v 0.3%e; Y/Y: 1.7% v 1.7%e
(UK) Jun BBA Loans for House Purchase: 40.2K v 40.0Ke
Fixed Income Issuance:
(IN) India sold total INR170B vs. INR170B indicated in 3-month and 6-month Bills
(EU) ECB alloted $35M in 7-day USD Liquidity Tender at fixed 1.65% vs $85M prior
(IT) Italy Debt Agency (Tesoro)sold €2.0B vs. € 1.5-2.0B indicated range in zero coupon May 2019 CTZ bonds; Avg yield: -0.160% v -0.167% prior; Bid-to-cover: 1.64x v 1.56x prior
(IT) Italy Debt Agency (Tesoro sold €1.25B vs. €0.75-1.25B indicated range in 1.3% Mar I/L 2028 Bonds (BTPei); Avg Yield: 1.24% v 1.21% prior; Bid-to-cover: 1.39x v 1.67x prior
SPEAKERS/FIXED INCOME/FX/COMMODITIES/ERRATUM
Equities
Indices [Stoxx600 +0.5% at 382.8, FTSE 0.6% at 7476, DAX +0.4% at 12306, CAC-40 +0.6% at 5190, IBEX-35 0.3% at 10550, FTSE MIB 0.2% at 21509, SMI +0.7% at 9002, S&P 500 Futures %]
Market Focal Points/Key Themes: European Indices trade higher following generally positive earnings out of Europe. The Swiss SMI, FTSE and CAC outperform with notable gains from PSA Group following strong results and guidance, whilst Daimler trades flat after falling slightly shy of estimates. In the UK ITV, Tullow Oil and Compass group all trade higher following solid results, whilst in Switzerland Lafarge Holcim trades slightly lower after lowering demand outlook and Lonza shares surge following a 15% rise in H1 sales. Looking ahead to the US morning notable earners include Ford, Boeing, Anthem and Thermo Fisher.
Equities
Consumer discretionary [ ITV [ITV.UK] +2.2% (Earnings)]
Consumer Staples [Compass Grp [CPG.UK] +1.8% (Earnings) ]
Materials: [Lonza [LONN.CH] +5.7% (Earnings), LafargeHolcim [LHN.CH] -1.3% (Earnings)]
Industrials: [PSA Grp [UG.FR] +4.0% (Earnings), Daimler [DAI.DE] +0.4% (Earnings), Thales [HO.FR] +3.5% (Earnings) ]
Technology: [ST Micro [STM.FR] +1.3% (Earnings), Atos [ATO.FR] +1.9% (Earnings)]
Telecom: [KPN [KPN.NL] +2.8% (Earnings)]
Energy: [Tullow Oil [TLW.UK] +3.3% (Earnings)]
Speakers
Chancellor of Exchequer Hammond (Fin Min): Cannot be complacent on growth and focus on restoring productivity
Russia Senator Kosachyov: Russia must prepare a "painful" response to US sanctions; there can be no improvement in Russia/US ties after new sanctions, relations to only worsen
Sweden Alliance (opposition) called for no-confidence vote against three ministers (Defense, Infrastructure and Interior)
China govt said to be planning rollover of CNY600B in bonds that back the sovereign fund that come due in Aug
Currencies
USD consolidated its recent losses ahead of the Fed rate decision later today. Dealers await for clues on whether the Fed might raise rates again this year, and when it will begin paring its massive bond portfolio
The GBP had little reaction as UK Q2 Advance GDP as the data was in-line with consensus. GBP/USD drifted lower towards 1.3010 in the aftermath.
AUD currency was softer during the Asian session after Australia Q2 core inflation remained well below the 2-3% targeted by the RBA, which meant that rates should be kept on hold for some time. AUD/USD hovering around the 0.79 area, -0.5%
Fixed Income
Bund futures trade at 161.89 down 28 ticks but still holding the July 20th low of 161.55. Resistance lies near the 162.75 level followed by 163.50. A break of the 160.00 support level could see lows target 159.25 followed by 157.50.
Gilt futures trade at 125.99 up 28 ticks, with a limited reaction to UK Q2 advance GDP reading Price finds key support at the 125.42 support level. An acceleration lower could test the 122.88 region. Resistance remains the noted 126.51 region, followed by 127.50.
Wednesday's liquidity report showed use of the marginal lending facility rose to €496M from €250M prior.
Corporate issuance saw $5.95B come to market via 4 issuers headlined by Codelco $2.75B 2-part senior note offering and Crown Castle $1.75B 2- part senior unsecured note offering.
Looking Ahead
(CO) Colombia Jun Retail Confidence: No est v 15.3 prior; Industrial Confidence: No est v -8.8 prior
(BR) Brazil July CNI Consumer Confidence: No est v 100.5 prior
05:30 (EU) ECB Long-Term Refinancing Operation Result
06:45 (US) Daily Libor Fixing
07:00 (RU) Russia to sell combined RUB30B in 2020 and 2022 OFZ Bonds
07:00 (US) MBA Mortgage Applications w/e July 14th: No est v +6.3% prior
08:00 (UK) Baltic Dry Bulk Index
08:30 (CL) Chile Central Bank's Traders Survey
09:30 (ZA) South Africa 6th summer-crop output forecast
10:00 (US) Jun New Home Sales: 615Ke v 610K prior
10:30 (US) Weekly DOE Crude Oil Inventories
11:30 (BR) Brazil weekly Currency Flows Weekly
11:30 (US) Treasuries to Sell 2-Year Floating Rate Notes
13:00 (US) Treasuries to Sell 5-Year Notes
14:00 (US) FOMC Interest Rate Decision: Expected to leave Interest Rates unchanged
14:30 (US) Fed Chair Yellen post rate decision press conference
16:00 (BR) Brazil Central Bank (BCB) Interest Rate Decision: Expected to cut Selic Target Rate by 100bps to 9.25%
FOMC Meeting: A More Cautious Assessment?
Today, all eyes will be on the FOMC rate decision. The forecast is for no change in policy. This is one of the smaller meetings that are not accompanied by updated projections or a press conference by Chair Yellen. As such, all of the action will come from the language of the statement accompanying the decision.
Economic data following the Fed's June policy meeting have been disappointing on balance. Headline inflation continued to slow in June for the 4th consecutive month, while retail sales for the month declined for the second time in a row. Even though the labor market continued to tighten, we doubt that will be enough to comfort policymakers, given that wage growth remains lackluster.
Bearing these in mind, we think that the statement accompanying the decision may have a slightly more cautious tone than previously, acknowledging the recent softness in the data, particularly in inflation. Something like that could weigh on USD. Even though the statement may suggest once again that the data weakness is transitory and that inflation is expected to recover soon, we find it difficult to envision a scenario in which policymakers appear optimistic enough to bring rate-hike expectations forward and trigger a rebound in USD.
As for the balance sheet, market chatter suggests the Committee could signal that its reduction is drawing closer, thereby preparing the ground for a September announcement. However, we believe such a change in language is unlikely. The FOMC rarely commits to action at a specific meeting beforehand, and considering the recent streak of soft data, policymakers may prefer to leave themselves some room for maneuvering.
EUR/USD spiked up at around midday in Europe, but hit resistance at the 1.1710 (R1) important barrier and slid to give back all its gains. Although the prevailing trend remains positive, the pair has been oscillating between 1.1615 (S1) and 1.1710 (R1) for the last couple of days, waiting for today's FOMC decision. If indeed the Fed appears more cautious, we expect the bulls to pull the trigger for another test near 1.1710 (R1). Having said that though, we would like to see a decisive close above that obstacle before we get confident on larger upside extensions. The 1.1710 (R1) level has been acting as the upper bound of the long-term sideways range that has been containing the price action since January 2015 and as such, its break may turn the major picture to the upside.
AUD pulls back on slowing inflation and Lowe's neutral tone
AUD took a hit overnight, after data showed that Australia's CPI slowed in Q2, missing its forecast for a slight acceleration. A couple of hours later, RBA Governor Lowe stepped up to the rostrum. His tone was neutral overall, noting that some people got overly excited about the discussion around the neutral rate at the last RBA meeting. With regards to AUD, he simply noted that it would be better if it was a bit lower than now. Coming on top of the slowdown in the CPI, his neutral remarks probably poured cold water on speculation that the Bank may raise rates soon.
AUD/USD traded lower on these developments and at the time of writing, it is testing the 0.7900 (S1) barrier, which is acting as the lower boundary of the sideways range that has been containing the rate since the 17th of July. A dip below 0.7900 (S1) may pave the way towards our next support barrier of 0.7840 (S2). However, even though the pair may continue to correct lower in the next days, as long as it remains above the key hurdle of 0.78000, we believe that the outlook remains cautiously positive.
That said, we would stay mindful ahead of next week's RBA meeting, as the statement accompanying the decision may communicate a greater discomfort with regards to the latest appreciation of AUD. After that, wage data for Q2 due out in mid-August could play the biggest role in shaping market expectations with regards to the timing of the first RBA hike, thereby dictating the Aussie's general direction.
As for the rest of today's highlights:
During the European day, the 1st estimate of UK GDP for Q2 is due out. Expectations are for growth to have accelerated slightly to +0.3% qoq from +0.2% qoq in Q2. The forecast is supported by the NIESR GDP estimate, which also shows growth ticked up to +0.3% qoq. Accelerating growth may support sterling somewhat, but such a print is unlikely to boost market expectations regarding a BoE rate hike this year.
EUR/USD
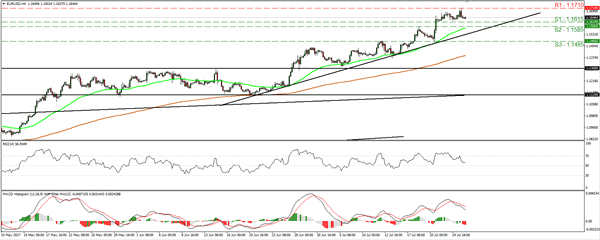
Support: 1.1615 (S1), 1.1585 (S2), 1.1485 (S3)
Resistance: 1.1710 (R1), 1.1880 (R2), 1.1980 (R3)
AUD/USD
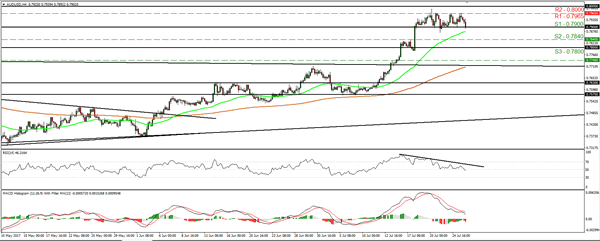
Support: 0.7900 (S1), 0.7840 (S2), 0.7800 (S3)
Resistance: 0.7965 (R1), 0.8000 (R2), 0.8070 (R3)
Euro Ticks Lower, Market Await Fed Statement
The euro has inched lower in the Wednesday session. Currently, EUR/USD is trading at 1.1630. down 0.14% on the day. On the release front, there are no events out of the eurozone. In the US, the Federal Reserve releases its rate statement and is expected to maintain the benchmark at 1.25%. As well, the US releases New Home Sales, which is expected to rise to 615 thousand. On Thursday, the US will release two key indicators – Unemployment Claims and Core Durable Goods Orders.
As the German economy continues to fire on all cylinders, economic indicators are pointing upwards. German Ifo Business Climate impressed in July, as the indicator strengthened for a sixth straight month. The indicator hit another record high of 116.0, surprising the markets which had forecast a small drop from the previous reading. Clements Fuest, president of the Ifo Institute, continues to use superlatives to describe the German economy, calling sentiment in the business sector “euphoric”. Fuest added that optimism in the business sector is at its highest since Germany's reunification. Germany's robust economy has been the locomotive behind a reinvigorated eurozone economy, as growth improves and unemployment drops. The marked improvement in economic conditions in the eurozone has sent the euro soaring, as the currency is up 9.8% since March 1.
All eyes are on the Federal Reserve, which will issue a rate statement later on Wednesday. The markets are not expecting the Fed to raise rates, but analysts will be looking for any references to the “I” word. Inflation continues to hover around 1.4% (based on the Fed's calculations), well below the Fed target of 2%. In June, Janet Yellen described low inflation as “transitory”, but recent comments from Yellen and other policymakers have shifted in tone, an apparent acknowledgment that inflation may remain at low levels. This has raised doubts as to whether the Fed will indeed raise rates on more time this year. No move is expected before December, and the odds of a December hike have fallen to just 37%, according to the CME Group. If today's rate statement fails to reassure the markets that a December hike is planned, investors could respond by selling dollar-denominated assets in favor of other currencies or gold.
Another issue facing Fed members is that of the Fed's $4.2 trillion bond portfolio, a result of the aggressive quantitative easing program which was put in place after the financial crisis in 2008. In June, the Fed outlined plans to reduce its bloated balance sheet, with experts circling September as the start date of the reduction. This would involve the Fed tapering the purchases of Treasury bonds and mortgage securities, with an initial taper likely of $10 billion/month. Analysts expect the taper to begin in September, so we could see the Fed make reference to this in the July statement.
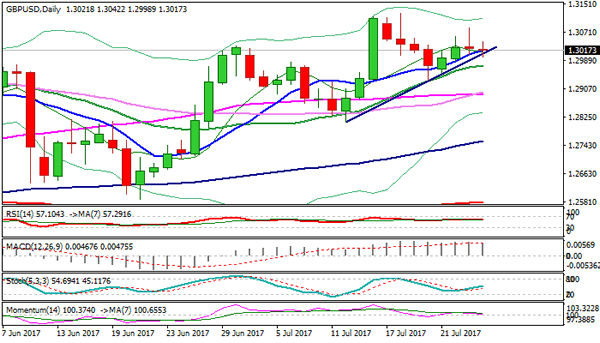
Technical Outlook: GBPUSD Cracks 1.3000 Support After UK GDP
Cable is in defensive on Wednesday after previous day's strong upside rejection under 1.3100 barrier, where strong three-day rally stalled.
Tuesday's Doji candle with long upper wick was negative signal with the pair coming under additional pressure after UK GDP data matched expectations.
Fresh weakness cracked 1.3000 support (also bull-trendline connecting 1.2811 and 1.2932 lows) and near 1.2990 (Fibo 61.8% of 1.2932/1.3083 upleg) which mark strong support zone, break of which would trigger further easing.
Near-term studies are turning into bearish setup and see risk of fresh downside.
Below 1.3000/1.2990, next pivot lies at 1.2968 (4-hr cloud base) loss of which would expose key near-term support at 1.2932 (20 July trough).
Conversely, regain of pivotal barrier at 1.3051 (Fibo 61.8% of 1.3125/1.2932) would sideline downside risk and shift near-term focus higher.
Res: 1.3042, 1.3051, 1.3083, 1.3100
Sup: 1.2990, 1.2968, 1.2932, 1.2896
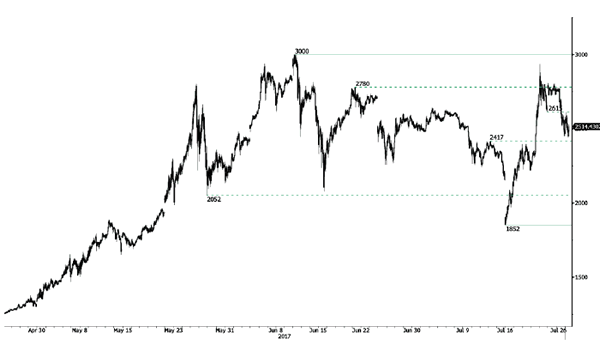
Bitcoin Fork Fears Drive Price Down
Bitcoin has surged strongly last week. Hourly resistance can be found at 3000 (12/06/2017 high) and hourly support given at 2615 (21/07/2017 low) has been broken. Further retracement are expected.
In the long-term, the digital currency has had an exponential growth. There are decent likelihood that the asset will consolidate above $1500. Long-term support is given at $1464 (04/05/2017 low).
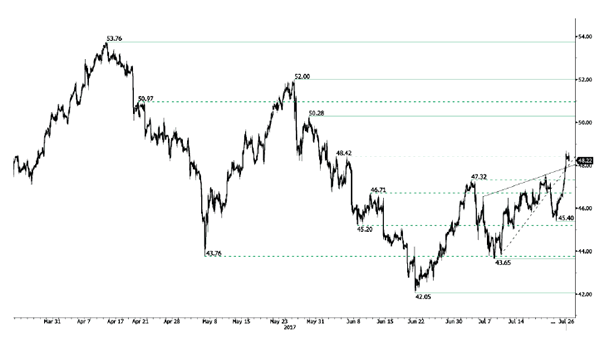
Crude Oil Bullish Consolidation
Crude oil is trading lower. Hourly support is given at 43.65 (10/07/2017 low). Strong resistance given at 48.42 (05/06/2017). Expected to show continued weakness.
In the long-term, crude oil has recovered after its sharp decline last year. However, we consider that further weakness are very likely. Strong support lies at 35.24 (05/04/2016) while resistance can now be found at 55.24 (03/01/2017 high).
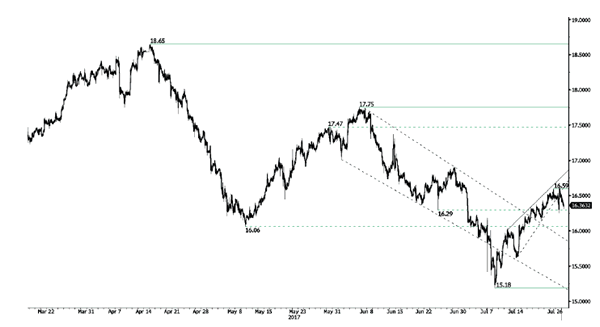
Silver Bullish Pressures Are Fading
Silver is pushing higher after the bounce still bouncing from hourly support given at 15.18 (10/07/2017 low). Key resistance is given at a distance at 17.75 (06/06/2017 high). The commodity is having difficulties to hold above the 16-mark.
In the long-term, the death cross indicates that further downsides are very likely. Resistance is located at 25.11 (28/08/2013 high). Strong support can be found at 11.75 (20/04/2009).
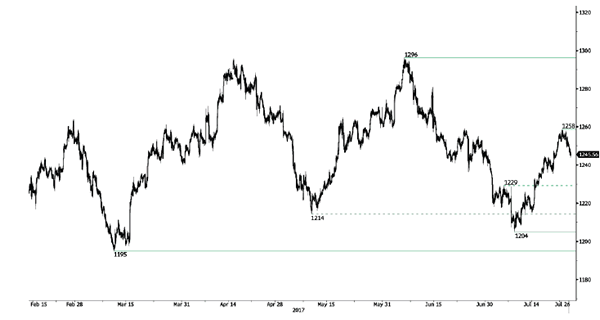
Gold Short-Term Consolidation
Gold's is consolidating lower. Strong support is given at 1204 10/07/2017 high). Hourly resistance lies at 1258 (23/06/2017 high). Expected to show further strengthening.
In the long-term, the technical structure suggests that there is a growing upside momentum. A break of 1392 (17/03/2014) is necessary ton confirm it, A major support can be found at 1045 (05/02/2010 low)
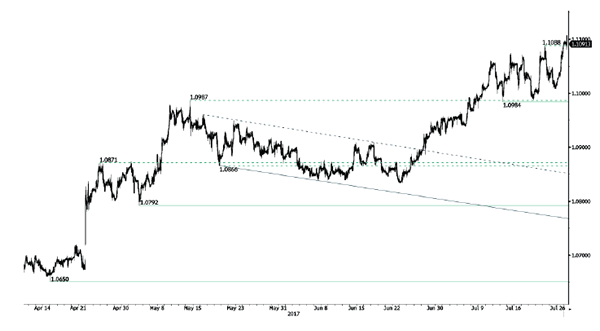
EUR/CHF Breaking 1.1100
EUR/CHF is still trading above psychological level at 1.1000 and the pair has broken 1.1100. Selling pressures will likely grow around those levels. Hourly support is located at a distance at 1.0984 (13/07/2017 low). Expected to inch higher.
In the longer term, the technical structure is mixed. Resistance can be found at 1.1200 (04/02/2015 high). Yet,the ECB's QE programme is likely to cause persistent selling pressures on the euro, which should weigh on EUR/CHF. Supports can be found at 1.0184 (28/01/2015 low) and 1.0082 (27/01/2015 low).
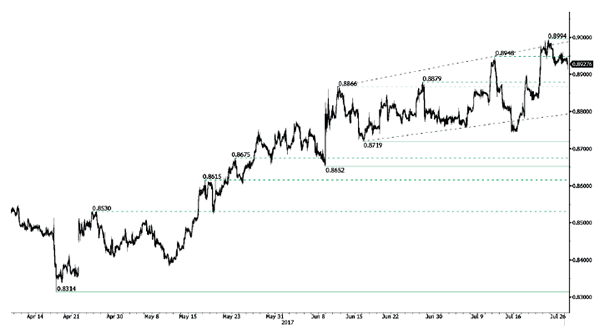
EUR/GBP Little Selling Pressures
EUR/GBP is very volatile. The pair has surged toward 0.9000. Hourly support is given at a distance at 0.8742 (16/06/2017 low). Downside risks are important.
In the long-term, the pair has largely recovered from recent lows in 2015. The technical structure suggests a growing upside momentum. The pair is trading above from its 200 DMA. Strong resistance can be found at 0.9500 psychological level.