Sample Category Title
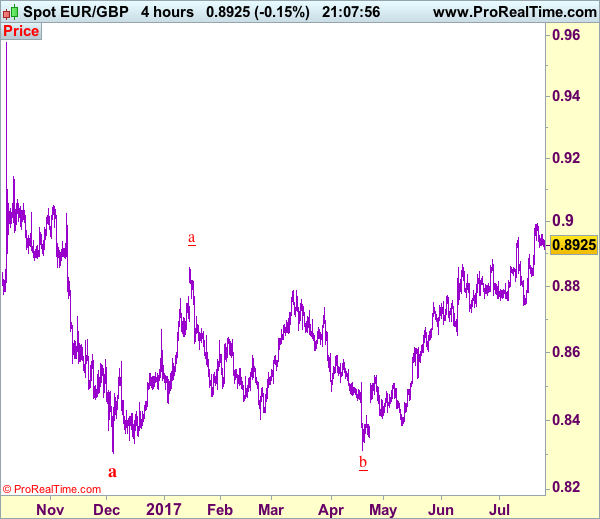
Trade Idea: EUR/GBP – Buy at 0.8875
EUR/GBP - 0.8921
Recent wave: Major double three (A)-(B)-(C)-(X)-(A)-(B)-(C) is unfolding and 2nd (A) has possibly ended at 0.6936.
Trend: Near term up
Original strategy :
Buy at 0.8875, Target: 0.8995, Stop: 0.8835
Position : -
Target : -
Stop : -
New strategy :
Buy at 0.8875, Target: 0.8995, Stop: 0.8835
Position : -
Target : -
Stop : -
As the single currency has retreated after last week’s rally to 0.8995, retaining our view that consolidation below this level would be seen and pullback to 0.8900 cannot be ruled out, however, reckon downside would be limited to 0.8875-80 and bring another rise later, above psychological resistance at 0.9000 would extend recent rise to 0.9020 and possibly towards 0.9050 but overbought condition should prevent sharp move beyond latter level, risk from there has increased for a retreat later.
In view of this, would not chase this rise here and would be prudent to buy euro on pullback as 0.8870-75 should limit downside. Only break of support at 0.8829 would abort and confirm top is formed instead, bring correction to 0.8800 first.
Our preferred count is that, after forming a major top at 0.9805 (wave V), (A)-(B)-(C) correction is unfolding with (A) leg ended at 0.8400 (A: 0.8637, B: 0.9491 and 5-waver C ended at 0.8400. Wave (B) has ended at 0.9413 and impulsive wave (C) has either ended at 0.8067 or may extend one more fall to 0.8000 before prospect of another rally. Current breach of indicated resistance at 0.9043 confirms our view that the (C) leg has ended and bring stronger rebound towards 0.9150/54, then towards 0.9240/50.
Trade Idea: USD/CAD – Sell at 1.2690
USD/CAD - 1.2527
Recent wave: Only wave v of c has ended at 0.9407 and wave C of major A-B-C correction is underway with wave iii ended at 1.4690, wave v of C may bring one more marginal rise probably in 2018
Trend: Down
Original strategy :
Sell at 1.2690, Target: 1.2490, Stop: 1.2750
Position: -
Target: -
Stop: -
New strategy :
Sell at 1.2690, Target: 1.2490, Stop: 1.2750
Position: -
Target: -
Stop:-
As the greenback has recovered after marginal fall to 1.2481, suggesting consolidation above this level would be seen and corrective bounce to 1.2555-60 and then 1.2600 is likely, however, reckon upside would be limited to 1.2690-00 and bring another decline, below said support at 1.2481 would add credence to our view that recent downtrend is still in progress, we are keeping our count that wave v as well as wave (C) ended at 1.3794 and impulsive wave (i ii, i ii) is now unfolding with minor wave iii still in progress, hence bearishness remains for this fall to extend weakness to 1.2450, however, oversold condition should prevent sharp fall below 1.2400-10 and reckon 1.2350-60 would hold, risk from there is seen for a rebound later.
In view of this, would not chase this fall here and would be prudent to sell the pair again on recovery as 1.2690-95 should limit upside. Above 1.2745-50 would defer and risk a stronger rebound to 1.2800-10 but only break of latter level would signal a temporary low is formed instead, bring retracement of recent decline to 1.2850, then 1.2900, however, price should falter below 1.3000 and the greenback shall head south again from there.
To recap, wave B from 1.3066 is unfolding as an a-b-c and is sub-divided as a: 1.2192, b: 1.2716 and wave c is a 5-waver with i: 1.1983, ii: 1.2506, extended wave iii with minor iii at 1.0206, wave iv ended at 1.0781 and wave v as well as wave iii has ended at 0.9931, hence the subsequent choppy trading is the wave iv which is unfolding as (a)-(b)-(c) with (a) leg of iv ended at 1.0854, followed by (b) leg at 1.0108 and (c) leg as well as the wave iv ended at 1.0674. The wave v is sub-divided by minor wave (i): 0.9980, (ii): 1.0374, (iii): 0.9446, (iv): 0.9913 and (v) as well as v has possibly ended at 0.9407, therefore, consolidation with upside bias is seen for major correction, indicated target at 1.3700 and 1.4000 had been met and further gain to 1.4700 would be seen later.

EURUSD Remains Vulnerable To The Downside On Pullbacks
EURUSD: With the pair backing off higher price to close almost flat on Tuesday, more corrective pullback is envisaged in the days ahead. Resistance comes in at 1.1700 level with a cut through here opening the door for more upside towards the 1.1750 level. Further up, resistance lies at the 1.1800 level where a break will expose the 1.1850 level. Conversely, support lies at the 1.1600 level where a violation will aim at the 1.1550 level. A break of here will aim at the 1.1500 level. All in all, EURUSD faces further corrective downside pressure on price rejection.
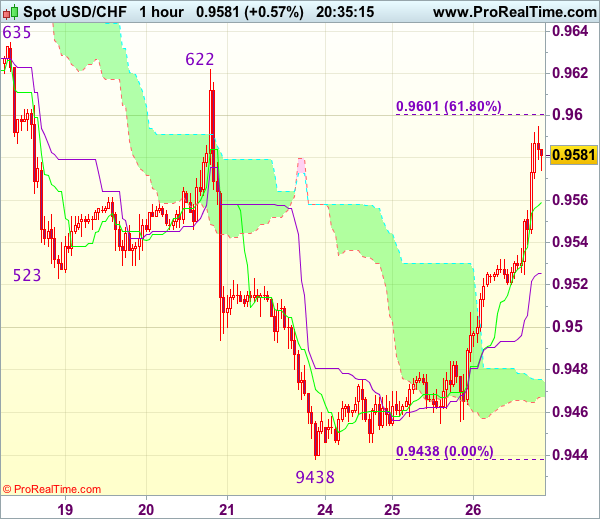
Trade Idea Update: USD/CHF – Hold short entered at 0.9570
USD/CHF - 0.9581
Original strategy :
Sold at 0.9570, target: 0.9470, Stop: 0.9605
Position : - Short at 0.9570
Target : - 0.9470
Stop : - 0.9605
New strategy :
Hold short entered at 0.9570, target: 0.9470, Stop: 0.9605
Position : - Short at 0.9570
Target : - 0.9470
Stop : - 0.9605
As the greenback has maintained a firm undertone after staging a strong rebound from 0.9438 late last week, suggesting near term upside risks remains for this corrective bounce to extend marginal gain from here, however, reckon upside would be capped at 0.9600-05 (61.8% Fibonacci retracement of 0.9701-0.9438) and bring retreat later, below 0.9520 would suggest an intra-day top is possibly formed but break of 0.9450-55 is needed to signal the rebound from 0.9438 has ended, bring retest of this level first.
In view of this, we are holding on to our short position entered at 0.9570. Above 0.9600-05 (61.8% Fibonacci retracement of 0.9701-0.9438) would suggest a temporary low is formed instead, bring a stronger rebound towards resistance area at 0.9622-35.
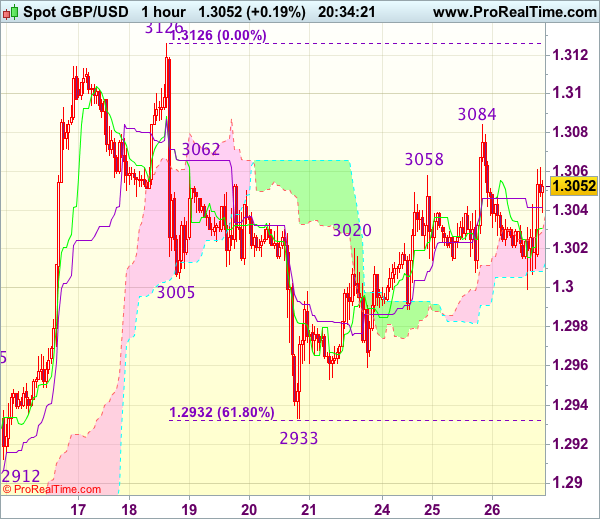
Trade Idea Update: GBP/USD – Sell at 1.3100
GBP/USD - 1.3049
Original strategy :
Sell at 1.3100, Target: 1.2980, Stop: 1.3135
Position : -
Target : -
Stop : -
New strategy :
Sell at 1.3100, Target: 1.2980, Stop: 1.3135
Position : -
Target : -
Stop : -
Although cable retreated after rising to 1.3084 yesterday, break of 1.2980-85 is needed to signal top is formed, bring further fall to 1.2950-55 but only below there would confirm the rebound from 1.2933 has ended, then another test of this support would follow, once this level is penetrated, this would add credence to our view that early fall from 1.3126 top has resumed for further weakness to previous support at 1.2912 which is likely to hold on first testing.
In view of this, would not chase this fall here and we are looking to sell cable on subsequent recovery as 1.3100-10 should limit upside. A firm break above 1.3100 would abort and suggest the fall from 1.3127 has ended instead, bring retest of this level but only break there would shift risk back to upside for further gain to 1.3150-60.
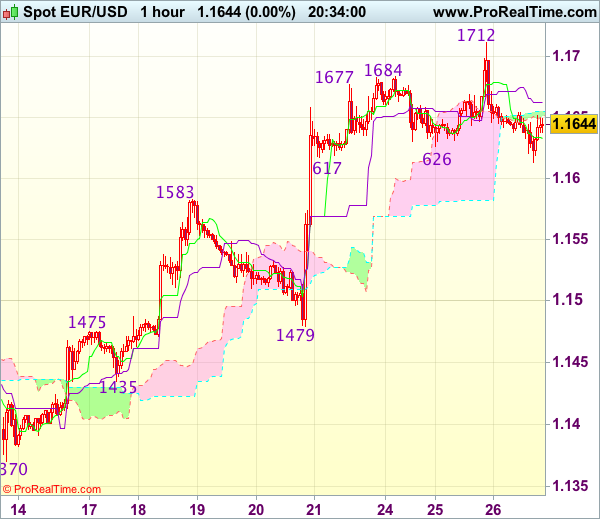
Trade Idea Update: EUR/USD – Sell at 1.1680
EUR/USD - 1.1643
Original strategy :
Sell at 1.1680, Target: 1.1580, Stop: 1.1715
Position : -
Target : -
Stop : -
New strategy :
Sell at 1.1680, Target: 1.1580, Stop: 1.1715
Position : -
Target : -
Stop : -
Although the single currency moved higher to 1.1712 yesterday, the subsequent retreat suggests consolidation below this level would be seen and as long as 1.1712 holds, mild downside bias is seen for test of 1.1617-20 support, break there would signal a temporary top is formed, bring retracement of recent rise towards previous resistance at 1.1583 but price should stay above 1.1550, bring another rally later.
In view of this, we are looking to turn short on recovery but one should exit on such fall. Above said resistance at 1.1712-14 would signal the rise from 1.0340 low is still in progress and may extend headway towards 1.1750, then 1.1775-80.
Trade Idea Update: USD/JPY – Hold short entered at 112.00
USD/JPY - 111.81
Original strategy :
Sold at 112.00, Target: 111.00, Stop: 112.35
Position : - Short at 112.00
Target : - 111.00
Stop : - 112.35
New strategy :
Hold short entered at 112.00, Target: 111.00, Stop: 112.35
Position : - Short at 112.00
Target : - 111.00
Stop : - 112.35
Although yesterday’s rally suggests near term rise from this week’s low at 110.62 may extend marginal gain from here, as this move is viewed as retracement of recent decline, reckon upside would be limited to 112.10 (50% Fibonacci retracement of 113.58-110.62) and bring another retreat later. Below previous resistance at 111.34 (now support) would suggest top is possibly formed but break of 111.10-15 is needed to add credence to this view, bring test of 110.80, break there would signal the rebound from 110.62 has ended, bring retest of this level first.
In view of this, we are holding on to our short position entered at 112.00. Above 112.08-10 would risk a stronger rebound to 112.42-45 (previous resistance and 61.8% Fibonacci retracement of 113.58-110.62) but only break there would signal recent decline has ended, bring headway towards resistance at 112.87 would follow.

USD/CAD Bloodless
USD/CAD changed little today and is waiting for the FOMC Statement to bring some action, we'll see how will react after this main event. Price remains under massive selling pressure, the next downside target is at the 1.2460 static level, this represents a long term support. Only a significant accumulation will signal a reversal.
Gold Slips Lower
The yellow metal is trading in the red again and resumes the yesterday's bearish candle, is going down as the USDX has managed to force the USD to appreciate a little ahead the FOMC.
Price decreased after the failure to reach and retest the outside sliding line (SL) of the major descending pitchfork and now is pressuring the 38.2% retracement level and the warning line (Wl1). Could come even to retest the upper median line (UML) and the sliding line (ascending dotted line) before will climb much higher. Only a drop below the SL and inside the major descending pitchfork's body will confirm a larger drop in the upcoming weeks. I believe that only the fundamental factors could force the rate to drop sharply.
EUR/CHF Hit New Highs
Price rallies and looks unstoppable on the Daily chart because has ignored some important resistance levels, could hit fresh new highs till the end of the days as the bulls are in full control. We have an amazing upside momentum as the Switzerland currency is trading in the red versus al its rivals, has dropped sharply also versus the greenback even if the USD is under pressure ahead the FOMC.
The CHF dropped aggressively even if the Swiss data have come in better compared to the previous reading period, the UBS Consumption Indicator jumped from 1.32 to 1.38 level, while the Credit Suisse Economic Expectations surged from 20.7 to 34.7 points, reaching the highest level since January 2014. The Euro rallied despite the lack of Euro-zone data, the pair was driven higher only by the technical factors.
EUR/CHF resumed the yesterday's impressive rally and has managed to jump above the median line (ml) of the minor ascending pitchfork and above the 1.1127 static resistance, the next upside target will be at the upper median line (uml) of the ascending pitchfork and higher 1.1198 long term static resistance.
Could also be attracted by the warning line (WL1) of the major ascending pitchfork, where he could find resistance again.
I've said in the previous analysis that the rate maintains a bullish perspective as long as is trading within the minor ascending pitchfork's body. Is strongly bullish again after the minor consolidation right below the upper median line (UML) and below the median line (ml).
Is very important to see what will happen when the rate will hit the 1.1198 major upside obstacle because a valid breakout above this level will confirm a larger increase in the upcoming months. As you already know, the pair moves in range on the long term, will escape from this extended sideways movement if will stabilize above the 1.1198 level.