
Sample Category Title
Gold Slightly Lower Ahead of Fed Rate Statement
Gold has posted slight losses in the Tuesday session. In North American trade, spot gold is trading at $1250.26, down 0.39% on the day. On the release front, CB Consumer Confidence jumped to 121.1., above the estimate of 116.5 points. There was positive news from the manufacturing sector, as the Richmond Manufacturing Index jumped to 14 points, well above the forecast of 7 points. On Wednesday, the Federal Reserve releases its monthly rate statement, and we'll also get a look at New Home Sales.
Gold continues to trade at high levels, as political turmoil in Washington has led to investors snapping up gold, a traditional safe-haven asset. On Monday, the metal touched a high of $1258.83, its highest level since June 15. Investors are increasingly concerned over Donald Trump, whose brash behavior and unconventional style has not been a good fit for the highest office in the land. Trump has failed to pass his healthcare bill, although the president is pulling out all the stops, as the Senate is expected to vote on a healthcare bill later on Tuesday. It's been a rough ride so far for Trump, who has failed to pass any significant legislation, and investors are becoming more skeptical as to whether Trump will have any more success with his tax reform and fiscal spending plans. With the Democrats forming a rock-solid wall of opposition, dissension among Republican lawmakers, many of whom are uneasy about Trump, could doom attempts by the White House to get bills through Congress.
The Federal Reserve is in the spotlight, as it holds its monthly policy meeting on Tuesday and Wednesday, With the odds of a rate hike at just 3%, the markets will be focused on the Fed's rate statement, which will be released on Wednesday. US numbers in the second quarter have been mixed, and inflation remains well below the Fed target of 2%. Given these economic conditions, investors are unsure if the Fed will raise rates in December, with the odds currently at 47%, according to the CME Group. Analysts will be looking for nuances in the language of the statement, and a dovish tilt from the Fed could hurt the dollar and boost the red-hot euro. Another issue for Fed policymakers is the $4.2 trillion bond portfolio, a result of the aggressive quantitative easing program which was put in place after the financial crisis in 2008. In June, the Fed outlined plans to reduce its bloated balance sheet, with experts circling September as the start date of the reduction. With gold prices closely linked to monetary policy, any clues in the rate statement regarding a rate hike or the start of winding up the balance sheet could have a significant effect on gold prices.
Trade Idea Wrap-up: USD/CHF – Sell at 0.9555
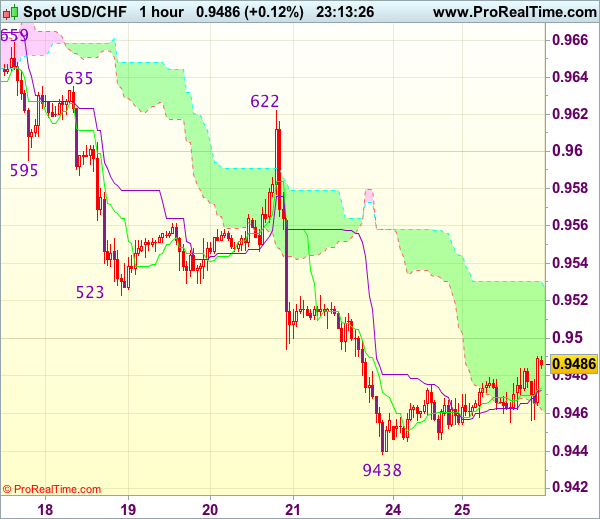
USD/CHF - 0.9496
Most recent candlesticks pattern : N/A
Trend : Near term down
Tenkan-Sen level : 0.9478
Kijun-Sen level : 0.9477
Ichimoku cloud top : 0.9530
Ichimoku cloud bottom : 0.9462
Original strategy :
Sell at 0.9555, target: 0.9455, Stop: 0.9590
Position : -
Target : -
Stop : -
New strategy :
Sell at 0.9555, target: 0.9455, Stop: 0.9590
Position : -
Target : -
Stop : -
As the greenback has recovered after falling to 0.9438 late last week, suggesting consolidation above this level would be seen and corrective bounce to 0.9523 (previous support now resistance) cannot be ruled out, however, reckon upside would be limited to 0.9555-60 and bring retreat later, below 0.9450-55 would signal the rebound from 0.9438 has ended, bring retest of this level first. A break of said support at 0.9438 would extend recent decline to 0.9405-10 but loss of momentum should limit downside to 0.9375-80, price should stay above 0.9350, risk from there is seen for a rebound later.
In view of this, we are looking to sell dollar on subsequent recovery as 0.9555-60 should limit upside and bring another decline. Above 0.9580-85 would suggest a temporary low is formed instead, bring a stronger rebound towards resistance at 0.9622 which is likely to hold from here.
Trade Idea Wrap-up: GBP/USD – Sell at 1.3100
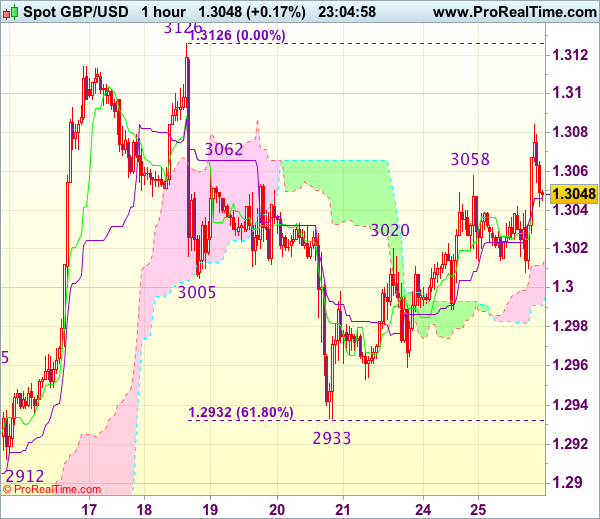
GBP/USD - 1.3040
Most recent candlesticks pattern : N/A
Trend : Near term up
Tenkan-Sen level : 1.3046
Kijun-Sen level : 1.3046
Ichimoku cloud top : 1.3012
Ichimoku cloud bottom : 1.2991
Original strategy :
Sell at 1.3100, Target: 1.2980, Stop: 1.3135
Position : -
Target : -
Stop : -
New strategy :
Sell at 1.3100, Target: 1.2980, Stop: 1.3135
Position : -
Target : -
Stop : -
Cable surged again today and near term upside risk remains for the recovery from 1.2933 to bring further gain from here, however, if our view that top has been formed at 1.3126 is correct, upside would be limited to 1.3100 and bring another decline later, below 1.3005-10 would signal an intra-day top is formed but break of 1.2955-60 is needed to signal the rebound from 1.2933 has ended, bring weakness to 1.2932-33 (61.8% Fibonacci retracement of 1.2812-1.3126 and said support), break there would extend the fall from 1.3126 top to previous support at 1.2912.
In view of this, we are looking to sell cable on further recovery as 1.3100-10 should limit upside. A firm break above 1.3100 would abort and suggest the fall from 1.3127 has ended instead, bring retest of this level but only break there would shift risk back to upside for further gain to 1.3150-60.
Trade Idea Wrap-up: EUR/USD – Sell at 1.1680
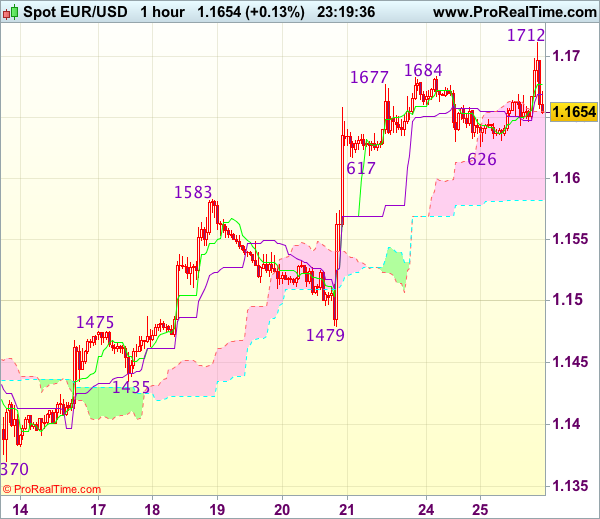
EUR/USD - 1.1655
Most recent candlesticks pattern : N/A
Trend : Near term up
Tenkan-Sen level : 1.1678
Kijun-Sen level : 1.1669
Ichimoku cloud top : 1.1655
Ichimoku cloud bottom : 1.1582
Original strategy :
Buy at 1.1590, Target: 1.1700, Stop: 1.1555
Position : -
Target : -
Stop : -
New strategy :
Sell at 1.1680, Target: 1.1580, Stop: 1.1715
Position : -
Target : -
Stop : -
Although the single currency extended recent rise to 1.1712 in NY morning, the subsequent retreat suggests consolidation below this level would be seen and as long as 1.1712 holds, mild downside bias is seen for test of 1.1617-26 support, break there would signal a temporary top is formed, bring retracement of recent rise towards previous resistance at 1.1583 but price should stay above 1.1550, bring another rally later.
In view of this, we are looking to turn short on recovery but one should exit on such fall. Above said resistance at 1.1712-14 would signal the rise from 1.0340 low is still in progress and may extend headway towards 1.1750, then 1.1775-80.
Trade Idea Wrap-up: USD/JPY – Sell at 112.00
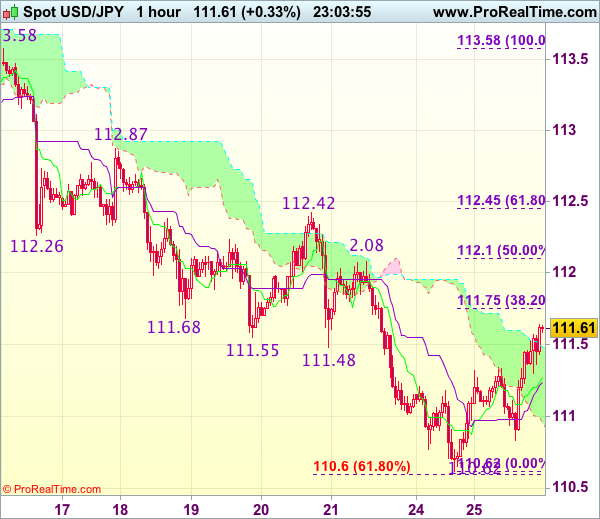
USD/JPY - 111.59
Most recent candlesticks pattern : N/A
Trend : Near term down
Tenkan-Sen level : 111.27
Kijun-Sen level : 111.24
Ichimoku cloud top : 111.48
Ichimoku cloud bottom : 110.96
Original strategy :
Exit short entered at 111.45 and
Sell at 111.75, Target: 110.75, Stop: 112.10
Position : - Short at 111.45
Target : -
Stop : -
New strategy :
Sell at 112.00, Target: 111.00, Stop: 112.35
Position : -
Target : -
Stop : -
Current rebound suggests near term upside risk has increased for the corrective bounce from 110.62 temporary low tho extend gain to 11.75 (38.2% Fibonacci retracement of 113.58-110.62), however, price should falter below 112.08-10 (previous resistance and 50% Fibonacci retracement) and bring another retreat later. Below 111.10-15 would suggest top is formed but break of 110.80 is needed to signal the rebound from 110.62 has ended, bring retest of this level first.
In view of this, would be prudent to sell dollar again on further subsequent rebound. Above 112.08-10 would risk a stronger rebound to 112.42-45 (previous resistance and 61.8% Fibonacci retracement of 113.58-110.62) which is likely to hold on first testing.
Yen Edges Lower as US Consumer Confidence Sparkles
USD/JPY has edged lower for a second straight day. In Tuesday's North American session, the pair is trading at 111.50. On the release front, The BoJ released its minutes from the June policy meeting. In the US, CB Consumer Confidence jumped to 121.1., easily beating the estimate of 116.5 points. On Wednesday, the Federal Reserve will release a rate statement, and the US publishes News Home Sales.
The Bank of Japan minutes highlighted a split among members as to how much information the bank should disclose regarding a potential withdrawal from its quantitative easing program. Some members were in favor of full disclosure about the bank's plans, while others said that publicizing information about an exit too soon could lead to market volatility. As expected, the BoJ maintained its ultra-loose policy, but there was an unexpected development, as the bank revised upwards its forecast for consumer consumption, for the first time in six months. An additional complication for policymakers is that the BoJ is now trailing other central banks with regard to tightening monetary policy - the Federal Reserve and Bank of Canada recently raised rates, and the ECB and BoE are contemplating tighter policy. This factor could weigh on the US dollar.
The Federal Reserve is in the spotlight, as it holds its monthly policy meeting on Tuesday and Wednesday, With the odds of a rate hike at just 3%, the markets will be focused on the Fed's rate statement, which will be released on Wednesday. US numbers in the second quarter have been mixed, and inflation remains well below the Fed target of 2.%. Given these economic conditions, investors are unsure if the Fed will raise rates in December, with the odds currently at 47%, according to the CME Group. Analysts will be looking for nuances in the language of the statement, and a dovish tilt from the Fed could hurt the dollar and boost the red-hot euro. Another issue for Fed policymakers is the $4.2 trillion bond portfolio, a result of the aggressive quantitative easing program which was put in place after the financial crisis in 2008. In June, the Fed outlined plans to reduce its bloated balance sheet, with experts circling September as the start date of the reduction.
Pound and Euro Surge on Rising Yields; US Data Lifts Dollar from Doldrums
Risk appetite recovered in European trading on Tuesday as rising government bond yields helped financial stocks, as well as lift the euro and the pound. US treasury yields also moved higher on expectations that the Fed will soon proceed with shrinking its bond portfolio. However, the US dollar was stuck in the doldrums for much of the session as investor caution ahead of the FOMC meeting and political uncertainty weighed on the currency.
The euro surged to a fresh high of $1.1711 today, breaking above the $1.17 level for the first time since August 2015. The single currency was bolstered by a jump in German bund yields, while much stronger-than-expected Ifo data from Germany further supported the euro.
The Ifo's business climate index rose to a record high of 116.0 in July from an upwardly revised 115.2 in June. The figure was well above expectations of a decline to 114.9. The current conditions and expectations indices also both beat forecasts. The Ifo report described German business sentiment as "euphoric", adding that companies were the most satisfied with the current conditions since the country's reunification. The data contrasts with the more disappointing PMI releases from yesterday.
In an additional boost for the euro, the Greek government successfully completed the sale of five-year bonds to private investors - the first since 2014. The sale helped reduce the yield spread between periphery Eurozone government bonds and German bunds.
The pound was also buoyant on Tuesday, advancing to a one-week high of $1.3083. Apart from the weaker dollar, sterling benefited from data from the Confederation of British Industry that showed UK manufacturing output was at its highest since January 1995 in the three months to July, although new orders rose less than expected in July.
The Japanese currency fell back in today's European session as risk sentiment improved but was also under pressure after the Bank of Japan's June meeting minutes revealed that the two new board members who joined the Bank recently argued against an early withdrawal from the stimulus program.
The greenback was unable to find much support from rising US treasury yields, even as the yen experienced broad weakness today. US treasury yields were sharply higher on Tuesday as investors bet that the Fed will signal at its meeting tomorrow the possible start date of its balance sheet reduction. Traders will also be looking to see whether the Fed will be concerned about any persistent weakness in inflation.
Apart from Fed policy, Trump's political woes were at the forefront of investors' minds, and this continued to weigh on the dollar. However, the US currency got a late boost from a surprisingly strong consumer confidence data. The Conference Board's consumer confidence index increased from a downwardly revised 117.3 in June to 121.1 in July, beating expectations of 116.5.
Other data out of the US included the S&P CoreLogic Case-Shiller 20-city home price index. The index was unchanged at an annual rate of 5.7% in May, which was slightly below forecasts of 5.8%.
The dollar firmed to around 111.50 yen after the consumer confidence data, but the dollar index remained not too far from the 13-month lows from earlier in the day, and last stood at 93.84.
In commodities, gold prices reversed lower as the dollar recovered and the yellow metal was trading at $1251.40 an ounce in late European session. Oil prices extended their gains following the latest move by OPEC to curb supply. WTI oil advanced to $47.38 a barrel, while Brent crude was up at $49.65 a barrel.
OPEC Remains Committed to Cutting Output; Oil Rises; Loonie Receives a Boost
Oil prices maintained their positive momentum, rising for a second straight day after OPEC countries called on several of the organization's members to adhere to the deal to reduce output. Adding to momentum for the commodity and further boosting prices was the commitment by Saudi Arabia - the world's number one oil exporter - to cut exports starting next month. The oil-linked loonie gained on the back of these developments, rising to a fresh multi-month high relative to the dollar. Unlike the Canadian dollar, the Russian ruble, another currency closely-related to oil, didn't manage to advance relative to the US currency.
OPEC, as well as non-OPEC producers led by Russia, discussed extending their deal to cut oil supply by 1.8 million barrels per day (bpd) during yesterday's meeting in the Russian city of St. Petersburg. The initial deal which was agreed last year and went into effect in January of this year, was originally expected to last up to the first half of 2017. As the boost it provided to oil prices was temporary, it was extended until March, 2018.
The initial deal's effectiveness to raise prices was in part dented by rising output from US shale producers who attempted to benefit from the increase in prices, placing a ceiling on the stronger upward movement in oil prices that was hoped for by the deal participants. The latest discussions are opening the way for a continuation of the deal beyond March of next year, in an effort to deplete global crude inventories.
Another significant development from yesterday's meeting, is that Nigeria, a major oil producer which was excluded from the initial deal to cut output, has voluntarily agreed to eventually (depending on Nigerian production patterns) join efforts to reduce production. A recent increase in production by Nigeria and Libya, another nation exempted from the initial deal, led to oil prices tumbling recently. Specifically, in late June, WTI and Brent crude both fell to more than eight-month lows of $42.05 and $44.35 a barrel respectively.
Moreover, Khalid al-Falih, the Saudi Energy Minister, stated that his country would reduce its exports to 6.6m bpd in August, by roughly one million barrels per day compared to a year ago. He added that global stockpiles have fallen by 90m barrels during the first six months of the year, though they currently exceed the five-year average for industrialized nations by about 250m barrels. Falih expects global oil demand to grow next year at a magnitude that outpaces the increase in US output. China is anticipated to record a double-digit increase in oil imports in the coming year.
Saudi Arabia and Kuwait have so far cut production by more than agreed, but compliance by Iraq and the United Arab Emirates has not been as strong. This is a consideration that must be addressed according to Saudi Arabia's Falih, who avoided naming specific countries and added that the committee monitoring compliance raised the issue with lagging nations. Alexander Novak, the Russian Energy Minister, said that full compliance would result to an additional 0.2m barrels being removed from the market on a daily basis.
Concluding with market movements, oil prices are posting considerable gains for a second day in a row. WTI and Brent crude oil were trading at $47.26 and $49.51 a barrel in late European trading hours, up 2.0% and 1.9% on the day respectively. In forex markets, dollar/loonie fell to a fresh 15-month low of 1.2480 in today's trading as the oil-linked Canadian dollar is benefitting from higher oil prices (Canada is a major exporter of the commodity). The Russian ruble is not experiencing similar gains as dollar/ruble is looking set for its third consecutive day of advances. The pair last traded at 59.890.
Elliott Wave Analysis: Triangle On AUDUSD Points Higher
AUDUSD can be trading at the end of a triangle correction in wave 4, which means a sharp recovery higher can be around the corner. Ideally we will see the previous blue wave b swing of the triangle correction breached, which would be a confirmation for a completed correction and black wave 5 in progress. Ideally wave 5 will later extend its gains towards the Fibonacci ratio of 138.2/161.8 region.
AUDUSD, 1H
Gold Pulls Back, But Still in a Short-Term Uptrend
Gold prices rose last week, fuelled by continued declines in the US dollar. During the European morning Tuesday, the yellow metal corrected somewhat lower amid a general risk-on sentiment in markets, evident by major stock indices like the S&P 500 hovering near all-time highs, as well as a general sell-off in other safe haven assets like JPY.
Absent some unforeseen risk event, the next major market mover for gold may be tomorrow's FOMC decision. We think risks are tilted towards a slightly more cautious narrative than previously given lacklustre inflation data and as such, we see the case for the dollar to extend its recent losses. Something like that could help the yellow metal resume its latest uptrend.
Gold traded lower during the European morning Tuesday after it hit once again resistance at the 1258 (R1) hurdle. Nevertheless, the slide was limited above the upside support line taken from the low of the 27th of January, and also above the lower bound of the short-term upside-sloping channel that has been containing the price action since the 10th of July.
As long as the rate is trading within that channel the short-term outlook of the yellow metal remains positive. If the bulls prove strong enough to take advantage of the 1245 (S1) support territory, we would expect them to aim for another test near 1258 (R1). A decisive break above that obstacle would confirm a forthcoming higher high on the daily chart and may open the way for our next resistance of 1266 (R2).
Zooming out to the daily chart, we see that the metal continues to trade in the sideways range that's been in place since the end of January, between the 1200 and 1300 territories. The latest recovery began from near the lower bound of the range. This alongside the break above the crossroads of the 1245 (S1) barrier and the upside support line drawn from the low of the 27th of January, increase the likelihood for further upside extensions in our view.