
Sample Category Title
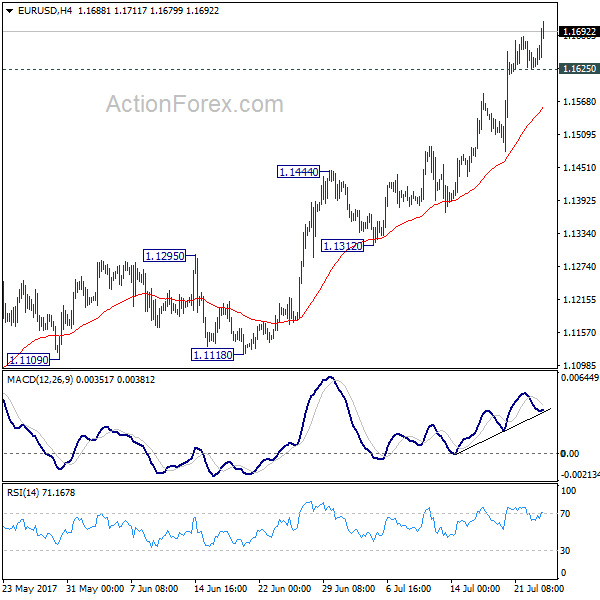
EUR/USD Nears Key 1.1735 Resistance
- European shares advanced strongly (Euro Stoxx +1.0%), rebounding after three days of declines as rising bond yields spurred banks and increasing metal prices helped miners. US stocks climbed on strong corporate earnings from big companies such as Caterpillar, du Pont de Nemours, United Technologies and General Motors.
- German Ifo business climate improved for a sixth month in July. The Ifo index rose to 116.0 from a revised 115.2 in June. That's the highest level since 1991 and compares with a median estimate of a drop to 114.9. The Ifo expectations component also rose from 106.8 to 107.3 while a decline to 106.5 figure was expected.
- American house prices nation-wide cooled modestly from an upwardly revised 5.65% Y/Y in April to 5.58% in May according to the S&P Home Price Index. The S&P 20-City index, that measures home-price changes in 20 US metropolitan regions, also declined from 5.77% Y/Y in April to 5.69% in May while the consensus expected 5.80%.
- Greece will raise €3 billion in its first visit to international bond markets since 2014 as it attempts to turn the page on a debt crisis that forced it to seek multiple international bailouts. The sub-investment grade rated country is selling 5y notes at a yield of 4.625%, after tightening terms twice from an initial target of around 4.875%.
- The two new members of the Bank of Japan's policy board said that the central bank should continue efforts to achieve its 2% price goal and it was premature to debate an exit from the massive monetary stimulus. The first policy meeting for the newcomers will be in September.
- Senator John McCain, who is battling brain cancer, will return to the US Senate today to play what could be a crucial role in salvaging Republican efforts to repeal Obamacare. The tally in the divided chamber was expected to be extremely tight, making McCain's return critical to the repeal effort.
- US Consumer confidence and Richmond Fed Manufacturing index surprised both on the upside of expectations. Consumer confidence surged from 117.3 to 121.1 in July, with an improvement both in the current assessment and expectations components. The Richmond Fed index improved from 11 to 14 in July.
Rates
Core bonds sell-off
Global core bonds lost ground today. The move started at the European opening and accelerated ahead of the start of US dealings. It's hard to pinpoint one specific factor to explain the move. A very strong German IFO-indicator (both current situation and expectations) and an upwardly oriented oil price certainly helped. Several bellwether companies including Caterpillar, announced good earnings and boosted equity market sentiment. The German 10-yr yield's failed test of 0.5% support perhaps inspired some technical Bund selling and suggests we might attack the 2017 high, especially if the Fed tomorrow signals willingness to continue its tightening cycle without attaching too much weight to the current dip in inflation readings. The upcoming US refinancing operation plays in the disadvantage of US Treasuries.
At the time of writing, the US yield curve bear steepens with yields 2.1 bps (2-yr) to 4.8 bps (30-yr) higher. Changes on the German yield curve range between +2.9 bps (5-yr) and +4.8 bps (10-yr). On intra-EMU bond markets, 10-yr yield spreads versus Germany are nearly unchanged.
Greece launched its first benchmark bond since 2014 today. They issued a new 5-yr GGB via syndication. The order book was in excess of €7B, allowing Greece to print €3B. The bond was priced to yield 4.625%, tighter than IPT's at 4.875% and official guidance at 4.75%. With its return to international markets, Greece aims to raise a war chest ahead of the end of the current bailout programme in August next year. The US Treasury starts its end-of-month refinancing operation tonight with a $26B 2-yr Note auction. The WI currently trades around 1.39%. The auction is followed by a $15B 2-yr FRN auction and a $34B 5-yr Note auction tomorrow and a $28B 7-yr Note auction on Thursday.
Currencies
EUR/USD nears key 1.1735 resistance
Today, EUR/USD and USD/JPY initially didn't find a clear trend even as EMU confidence data were very strong. Early in USD dealings, European yields jumped higher again. EUR/USD came within reach of the 1.1714/35 area, but a real test didn't occur (yet). USD/JPY had some tepid intraday gains and trades in the 111.50 area. Even so, euro weakness combined with USD softness remains the name of the game going into tomorrow's Fed policy decision.
Asian equities traded mixed in line with WS. ECB's Mersch said he saw upward risks to EMU growth and stated that he's more assured about a return of inflation to the target. At the same time he reiterated that policy accommodation remains necessary. EUR/USD rebounded to the 1.1660 area on the Mersch headlines, but a test of the recent highs didn't occur. USD/JPY stabilized near 111.
In Europe, the French Business confidence and the German IFO business climate were both stronger than expected. European equities and core yields rose slightly after the data. The euro tried a shy attempt to go higher but almost immediately ran into resistance. EUR/USD returned to the 1.1650 area. USD/JPY slightly gained further ground on a modest rise in core (US & EMU) yields.
Early in US dealings, the focus was on corporate earnings. Most results were better than expected and reinforced the positive risk sentiment from European equity markets. Core bond yields maintained an upward bias. This morning, one could have questioned whether the lack of a euro response to good EMU data pointed to some exhaustion of the euro rally. This afternoon it appeared that this wasn't the case. An new uptrend in European bond yields finally pushed EUR/USD beyond the 1.17 big figure. The 1.1714/36 key resistance came within reach. At the same time, USD/JPY (currently around 111.45) hardly profited from higher core yields and a good risk sentiment. So, for now, the trends of euro strength and USD softness remain in place going into the FOMC decision.
GBP succeeds insignificant comeback
Sterling staged a technical rebound against the dollar and the euro. At the end of last week, the poor results of the first round of negotiations between the UK and the EU weighed on the UK currency. Today's rebound of sterling was primarily technical in nature. The eco news was intrinsically negative for sterling. The IMF downwardly revised the UK 2017 growth forecast to 1.7% Y/Y (from 2.0% in April). IHS markit also reported that its household financial index dropped to the lowest since July 2014 due to rising costs of living. However, all this didn't prevent a modest technical rebound of the sterling. EUR/GBP trades currently in the 0.8945 area. Cable returned north of 1.30. The first estimate of the UK Q2 GDP, to be published on Wednesday, will be the next key factor for sterling trading.
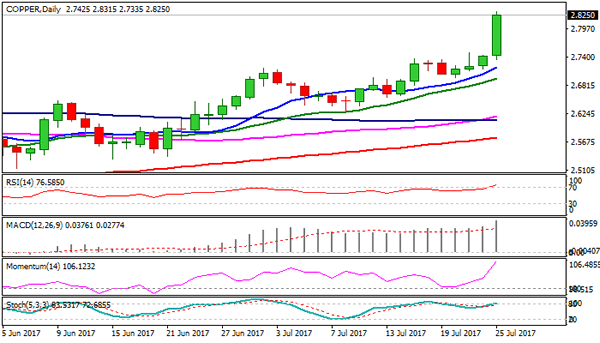
Copper Boosted by Signs of Robust Demand
Copper contract for July delivery hit fresh over five-month high on Tuesday, boosted by signs of robust demand from top consumer China, tight supplies and weak dollar. Copper price skyrocketed on Tuesday, marking the biggest one-day rally since early Feb and rallying 3.25% until now. Tuesday's rally cracked very important barrier at $2.8215 (former recovery high of 12 Feb) and hit new 2017 highs above $2.83 barrier. Strong bullish sentiment can drive the price towards next key resistance at 2.9550 (May 2015 high/Fibo 138.2% projection) on sustained break above 2.8215 barrier. Meanwhile, hesitation at 2.8215, which could results in corrective easing, could be anticipated as daily techs are overbought and bearish divergence formed on daily slow stochastic, as well as on profit-taking action. However, limited downside action is seen, as sentiment remains firmly bullish, with 2.7000 zone (near Fibo 38.2% of 2.4720/2.8315 rally, reinforced by rising daily 20SMA) expected to contain extended dips.
Res: 2.8315; 2.8500; 2.8895; 2.9000
Sup: 2.8000; 2.7670; 2.7467; 2.7155
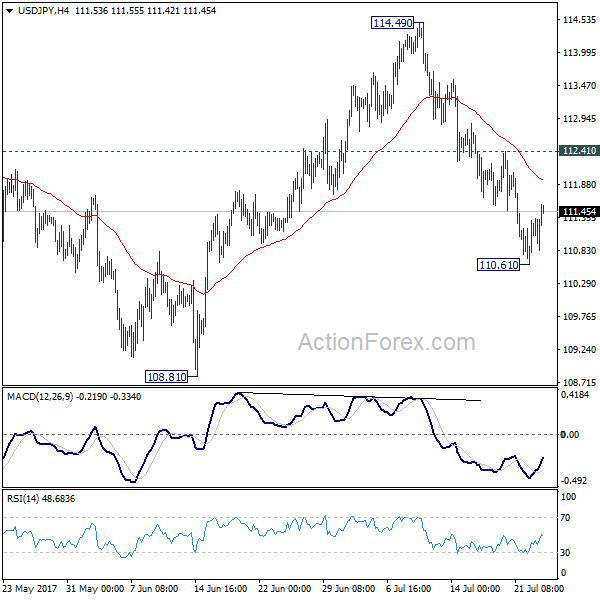
USD/JPY Mid-Day Outlook
Daily Pivots: (S1) 110.70; (P) 111.01; (R1) 111.39; More...
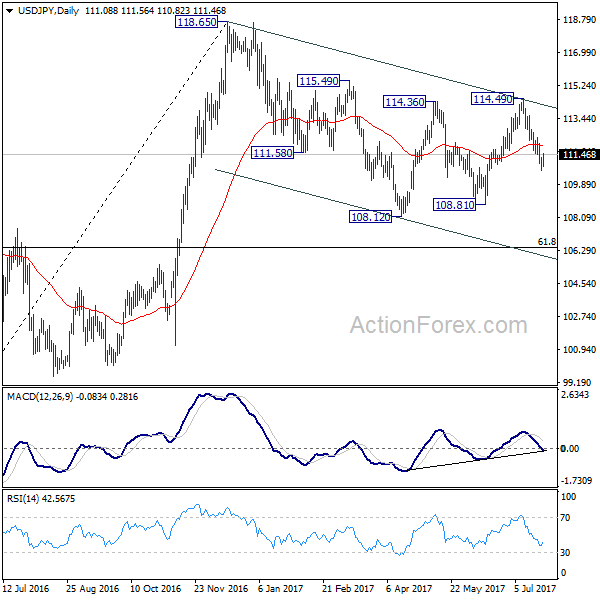
Intraday bias in USD/JPY remains neutral as recovery from 110.61 temporary low continues. Upside should be limited by 112.41 resistance to bring another decline. Below 110.61 will turn bias back to the downside for 108.81 support. Whole correction from 118.65 is possibly resuming. Break of 108.81 will confirm and target 61.8% retracement of 98.97 to 118.65 at 106.48. Nonetheless, break of 112.41 will dampen this bearish view and turn focus back to 114.49 resistance instead.
In the bigger picture, the corrective structure of the fall from 118.65 suggests that rise from 98.97 is not completed yet. Break of 118.65 will target a test on 125.85 high. At this point, it's uncertain whether rise from 98.97 is resuming the long term up trend from 75.56, or it's a leg in the consolidation from 125.85. Hence, we'll be cautious on topping as it approaches 125.85. If fall from 118.65 extends lower, down side should be contained by 61.8% retracement of 98.97 to 118.65 at 106.48 and bring rebound.
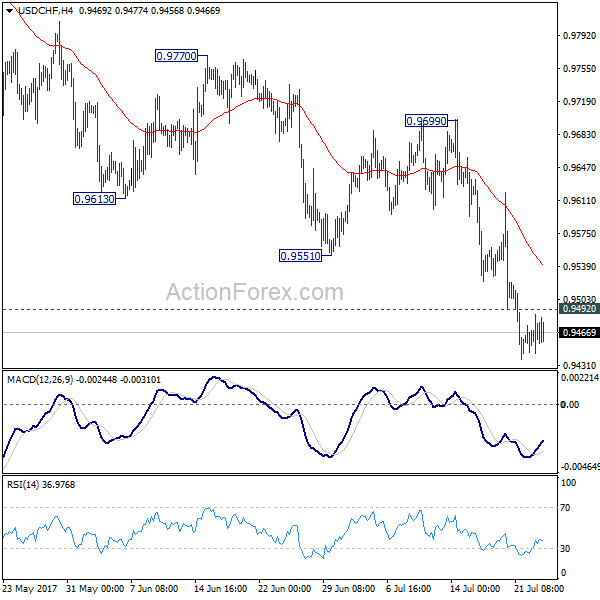
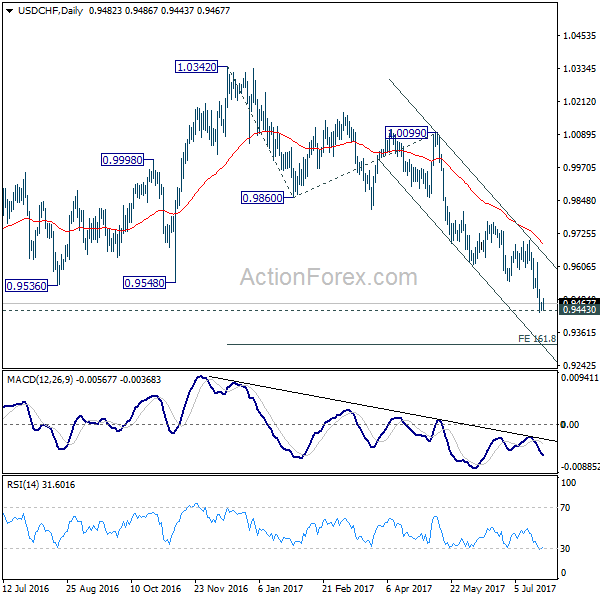
USD/CHF Mid-Day Outlook
Daily Pivots: (S1) 0.9447; (P) 0.9461; (R1) 0.9478; More...
With 0.9492 minor resistance intact, intraday bias in USD/CHF remains on the downside for further decline. Sustained trading below 0.9443 key support will extend the down trend from 1.0342 to 161.8% projection of 1.0342 to 0.9860 from 1.0099 at 0.9319. On the upside, above 0.9492 minor resistance will turn bias neutral and bring recovery. But outlook will remain bearish as long as 0.9699 resistance holds.
In the bigger picture, focus is now back 0.9443 key support level. Sustained break there indicate underlying bearish momentum and would target 0.9 handle and possibly below. Meanwhile, strong rebound from current level and break 0.9699 resistance will extend long term range trading between 0.9443/1.0342.
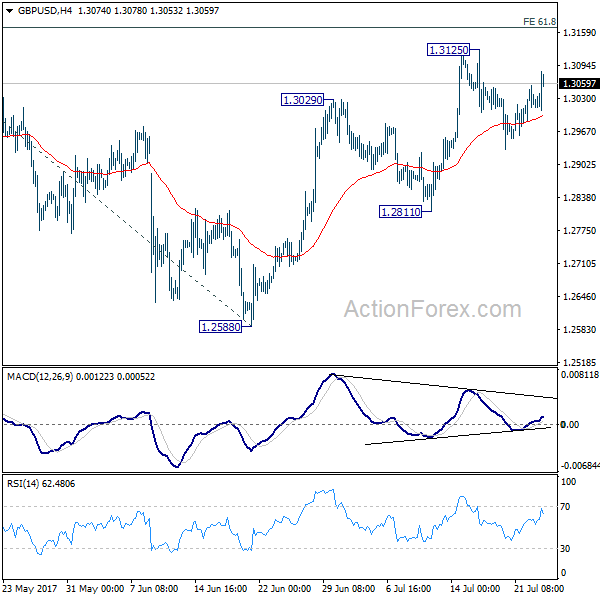
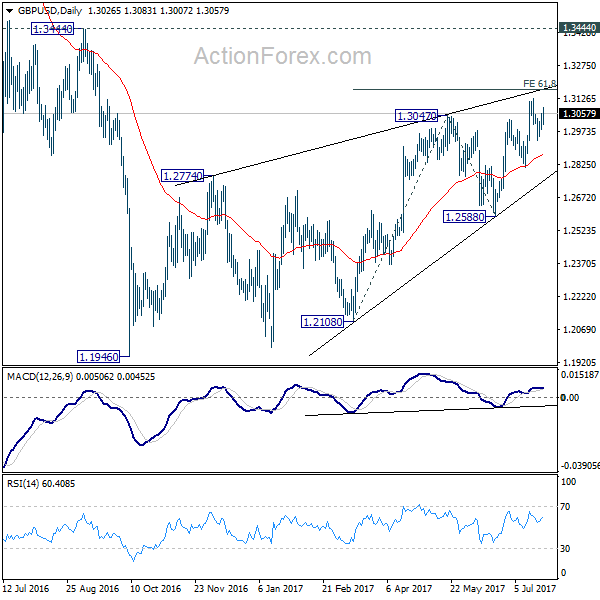
GBP/USD Mid-Day Outlook
Daily Pivots: (S1) 1.2992; (P) 1.3024; (R1) 1.3061; More...
Intraday bias in GBP/USD remains neutral for the moment. With 1.2811 support intact, another rise is mildly in favor. Break of 1.3125 will target 61.8% projection of 1.2108 to 1.3047 from 1.2588 at 1.3168. Overall, choppy rebound from 1.1946 is seen as a corrective pattern, hence, we'd be cautious on strong resistance from 1.3168 to limit upside. But firm break of 1.3168 will bring further rise towards 1.3444 key resistance. Meanwhile, break of 1.2811 support will be the first sign of reversal and will turn bias to the downside to target 1.2588 key support next.
In the bigger picture, overall, price actions from 1.1946 medium term low are seen as a corrective pattern that is still in progress. While further upside is expected, overall outlook remains bearish as long as 1.3444 key resistance holds. Larger down trend from 1.7190 is expected to resume later after the correction completes. And break of 1.2588 will indicate that such down trend is resuming.
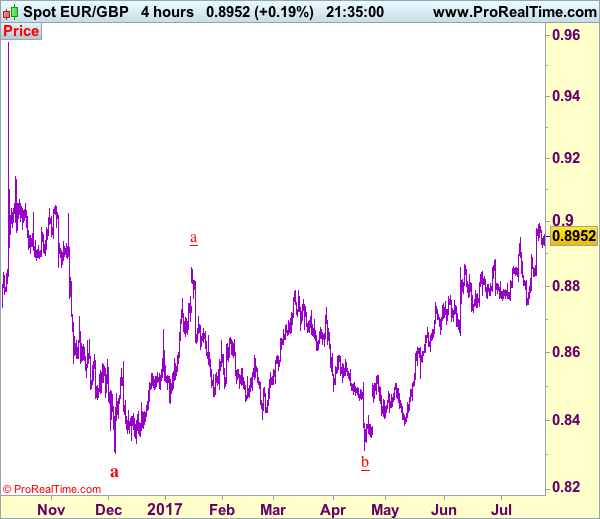
Trade Idea: EUR/GBP – Buy at 0.8875
EUR/GBP - 0.8951
Recent wave: Major double three (A)-(B)-(C)-(X)-(A)-(B)-(C) is unfolding and 2nd (A) has possibly ended at 0.6936.
Trend: Near term up
Original strategy :
Buy at 0.8875, Target: 0.8995, Stop: 0.8835
Position : -
Target : -
Stop : -
New strategy :
Buy at 0.8875, Target: 0.8995, Stop: 0.8835
Position : -
Target : -
Stop : -
Euro’s retreat after rising to 0.8995 on Friday has retained our view that consolidation below this level would be seen and pullback to 0.8900 cannot be ruled out, however, reckon downside would be limited to 0.8875-80 and bring another rise later, above psychological resistance at 0.9000 would extend recent rise to 0.9020 and possibly towards 0.9050 but overbought condition should prevent sharp move beyond latter level, risk from there has increased for a retreat later.
In view of this, would not chase this rise here and would be prudent to buy euro on pullback as 0.8870-75 should limit downside. Only break of support at 0.8829 would abort and confirm top is formed instead, bring correction to 0.8800 first.
Our preferred count is that, after forming a major top at 0.9805 (wave V), (A)-(B)-(C) correction is unfolding with (A) leg ended at 0.8400 (A: 0.8637, B: 0.9491 and 5-waver C ended at 0.8400. Wave (B) has ended at 0.9413 and impulsive wave (C) has either ended at 0.8067 or may extend one more fall to 0.8000 before prospect of another rally. Current breach of indicated resistance at 0.9043 confirms our view that the (C) leg has ended and bring stronger rebound towards 0.9150/54, then towards 0.9240/50.
Trade Idea: USD/CAD – Sell at 1.2690
USD/CAD - 1.2502
Recent wave: Only wave v of c has ended at 0.9407 and wave C of major A-B-C correction is underway with wave iii ended at 1.4690, wave v of C may bring one more marginal rise probably in 2018
Trend: Down
Original strategy :
Sell at 1.2690, Target: 1.2490, Stop: 1.2750
Position: -
Target: -
Stop: -
New strategy :
Sell at 1.2690, Target: 1.2490, Stop: 1.2750
Position: -
Target: -
Stop:-
The greenback has remained under pressure after recent selloff, adding credence to our view that recent downtrend is still in progress, we took the count that wave v as well as wave (C) ended at 1.3794 and impulsive wave (i ii, i ii) is now unfolding with minor wave iii still in progress, hence bearishness remains for this fall to extend weakness to 1.2470-75, then 1.2450, however, oversold condition should prevent sharp fall below 1.2400-10 and reckon 1.2350-60 would hold, risk from there is seen for a rebound later.
In view of this, would not chase this fall here and would be prudent to sell the pair again on recovery as 1.2690-95 should limit upside. Above 1.2745-50 would defer and risk a stronger rebound to 1.2800-10 but only break of latter level would signal a temporary low is formed instead, bring retracement of recent decline to 1.2850, then 1.2900, however, price should falter below 1.3000 and the greenback shall head south again from there.
To recap, wave B from 1.3066 is unfolding as an a-b-c and is sub-divided as a: 1.2192, b: 1.2716 and wave c is a 5-waver with i: 1.1983, ii: 1.2506, extended wave iii with minor iii at 1.0206, wave iv ended at 1.0781 and wave v as well as wave iii has ended at 0.9931, hence the subsequent choppy trading is the wave iv which is unfolding as (a)-(b)-(c) with (a) leg of iv ended at 1.0854, followed by (b) leg at 1.0108 and (c) leg as well as the wave iv ended at 1.0674. The wave v is sub-divided by minor wave (i): 0.9980, (ii): 1.0374, (iii): 0.9446, (iv): 0.9913 and (v) as well as v has possibly ended at 0.9407, therefore, consolidation with upside bias is seen for major correction, indicated target at 1.3700 and 1.4000 had been met and further gain to 1.4700 would be seen later.

EUR/USD Mid-Day Outlook
Daily Pivots: (S1) 1.1615; (P) 1.1650 (R1) 1.1674; More...
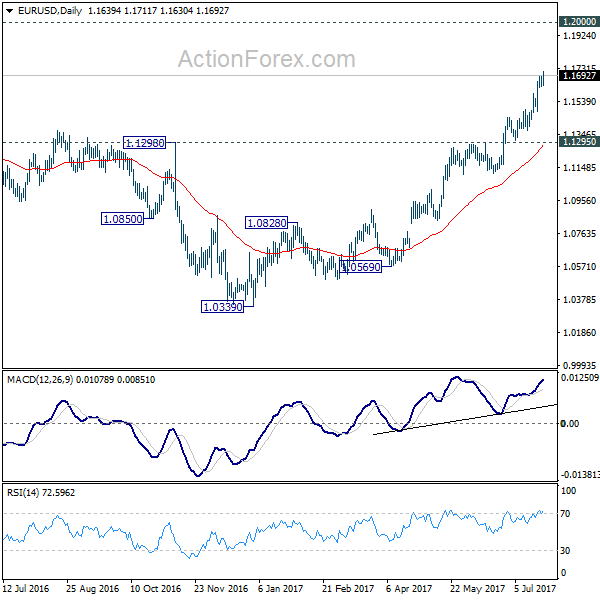
EUR/USD's rally resumes after brief consolidation and reaches as high as 1.1711 so far. Intraday bias is back on the upside. Current up trend is expected to target 1.2 handle next. On the downside, below 1.1625 minor support will turn intraday bias neutral and bring consolidation. But downside of retreat should be contained above 1.1444 resistance turned support and bring another rally.
In the bigger picture, an important bottom was formed at 1.0339 on bullish convergence condition in weekly MACD. Sustained break of 55 month EMA (now at 1.1760) will pave the way to key fibonacci level at 38.2% retracement of 1.6039 (2008 high) to 1.0339 (2017 low) at 1.2516. While rise fro 1.0339 is strong, there is no confirmation that it's developing into a long term up trend yet. Hence, we'll be cautious on strong resistance from 1.2516 to limit upside. But for now, medium term outlook will remain bullish as long as 1.1295 support holds, in case of pull back.
Dollar Weakens Again as German Ifo Lifts Euro, Yen Even Weaker as Risk Appetite Returns
Dollar's selloff resumes after Fed is starting its two day policy meeting today. In particular, EUR/USD extends recent rally and is pressing 1.17 as helped by record sentiment data. The greenback, on the other hand, stays weak on uncertainty over Fed's outlook. Politics in the US is also weighing on the greenback. There are news about US President Donald Trump's son-in-law Jared Kushner's contacts with Russia. There are also news of Trump blasting attorney general Jeff Sessions. And there are news that Trump's boy scout Jamboree speech angered parents. But, there seems to be no news regarding tax reforms and expansive fiscal policies.
Nonetheless, the Japanese yen is even weaker following rally in European indices. At the time of writing, FTSE is trading up 0.95%, DAX up 0.68% and CAC up 1.2%. Stocks in Europe are boosted by oil and commodities. DOW follows by having triple-digit gain at open and is set to make new record high. Released in US session, US house price index rose 0.4% mom in May, below expectation of 0.5% mom. S&P Case-Shiller 20 cities house price rose 5.7% yoy in May, below expectation of 5.8% yoy.
Quick update: US Conference Board consumer confidence rose to 121.1, above expectation of 116.
German Ifo hits record as economy is powering ahead
German Ifo business climate rose to 116.0 in July, up from 115.1 and beat expectation of 114.9. That's the sixth straight month of improvement and the highest level since 1997. Expectations gauge rose to 107.3, up from 106.8, above expectation of 106.5. Current assessment gauge rose to 125.4, up from 124.1, above expectation of 123.8. Ifo President Clemens Fuest said in a statement that "sentiment among German businesses is euphoric," and the "economy is powering ahead." Also, "companies' satisfaction with their current business situation reached its highest level since Germany's unification" and "short-term business outlook also improved". Also from Europe, German import price dropped -1.1% mom in June. UK CBI trends total orders dropped to 10 in July.
ECB Mersch: Substantial degree of monetary accommodation is still needed
ECB Executive Board member Yves Mersch continued to sound cautious and said that "a very substantial degree of monetary accommodation is still needed for underlying inflation pressures to gradually build up and support headline inflation." Also, he said that "reflationary forces are at play" and "price pressures in the early stages of the pricing chain remain strong". they "have still not transmitted to the later stages." Though, he's optimistic that "political winds are becoming tailwinds". And, "there is newfound confidence in the reform process, and newfound support for European cohesion, which could help unleash pent-up demand and investment, if confirmed by decisive action."
BoJ minutes showed members divided on revealing exit strategy
The minutes of the June 15-16 BoJ meeting showed that board members were divided on how much information about exit strategy should be revealed to the public. The minutes noted that "some members said it was important to thoroughly explain the BOJ's thinking on how it will manage policy and the impact on the central bank's finances to gain understanding." On the other hand, "several members said providing uncertain information before meeting the inflation target could cause market confusion, so it is important to continue internal analysis on this subject." BoJ will released summary of opinions in the July meeting later on Friday, which could more information on the discussions afterwards.
Meanwhile, two new BoJ board members also expressed that it's not time to talk about stimulus exit yet. Goushi Kataoka said that "before any exit strategy we must think about how to bring inflation to the 2 percent price target in a stable manner". Hitoshi Suzuki said it's somewhat risky" to starting discussing exit when inflation is far below the 2% target. The pair joined the board this week replacing regular dissenters Takahide Kiuchi and Takehiro Sato.
Crude Oil Recovers as Saudi Arabia Promised to Cut Exports in August
Oil price recovered mildly after Saudi Arabia's oil minister Khalid Al-Falih announced that it would cap its exports at 6.6M bpd in August, 1M bpd below that the same period last year. He acknowledged that "the market has turned bearish with several key factors driving these sentiments", admitting that weaker compliance with cuts by some OPEC states and a rise in OPEC exports were one of the factors leading to weaker oil prices. He added that "some countries continue to lag which is a concern we must address head on" and "exports have now become the key matrix to financial markets and we need to find a way to reconcile credible exports data with production data". On the global oil demand outlook, Falih expect growth would reach +1.4- 1.6M bpd in 2018, a rate that should offset US output expansion.
EUR/USD Mid-Day Outlook
Daily Pivots: (S1) 1.1615; (P) 1.1650 (R1) 1.1674; More...
EUR/USD's rally resumes after brief consolidation and reaches as high as 1.1711 so far. Intraday bias is back on the upside. Current up trend is expected to target 1.2 handle next. On the downside, below 1.1625 minor support will turn intraday bias neutral and bring consolidation. But downside of retreat should be contained above 1.1444 resistance turned support and bring another rally.
In the bigger picture, an important bottom was formed at 1.0339 on bullish convergence condition in weekly MACD. Sustained break of 55 month EMA (now at 1.1760) will pave the way to key fibonacci level at 38.2% retracement of 1.6039 (2008 high) to 1.0339 (2017 low) at 1.2516. While rise fro 1.0339 is strong, there is no confirmation that it's developing into a long term up trend yet. Hence, we'll be cautious on strong resistance from 1.2516 to limit upside. But for now, medium term outlook will remain bullish as long as 1.1295 support holds, in case of pull back.
Economic Indicators Update
| GMT | Ccy | Events | Actual | Forecast | Previous | Revised |
|---|---|---|---|---|---|---|
| 23:50 | JPY | BoJ Minutes June Meeting | ||||
| 06:00 | EUR | German Import Price Index M/M Jun | -1.10% | -0.70% | -1.00% | |
| 08:00 | EUR | German IFO - Business Climate Jul | 116 | 114.9 | 115.1 | |
| 08:00 | EUR | German IFO - Expectations Jul | 107.3 | 106.5 | 106.8 | |
| 08:00 | EUR | German IFO - Current Assessment Jul | 125.4 | 123.8 | 124.1 | |
| 10:00 | GBP | CBI Trends Total Orders Jul | 10 | 12 | 16 | |
| 13:00 | USD | House Price Index M/M May | 0.40% | 0.50% | 0.70% | 0.60% |
| 13:00 | USD | S&P/Case-Shiller Composite-20 Y/Y May | 5.70% | 5.80% | 5.67% | 5.80% |
| 14:00 | USD | Consumer Confidence Jul | 121.1 | 116 | 118.9 | 117.3 |
US Futures Higher Tracking European Markets | Finally Something For Oil Bulls | Gold Steady Ahead Of FOMC
- German IFO data painted more optimistic picture
- US shale oil producers are facing problems and that could support the oil price
- Gold traders are looking towards the FOMC minutes
US Futures are trading higher as investors are picking up momentum from Europe. The German IFO business confidence is one of the most closely watched data in the Eurozone and the number shows that the confidence among companies is more positive than ever. There has been some concerns especially if you look at yesterday's data (manufacturing and services PMI data) that there may be another wave of economic slowdown activity hitting the country but the soft data released today has defied those predictions. This has provided fresh fuel for the euro currency which is already trading in a strong uptrend but we are still below the 2015 resistance which is 1.1714.
While the ECB's president hawkish comments are still very much behind the euro rally, but some ECB policy committee members tried to calm the markets that tapering is not imminent. Not that Draghi said anything substantial last week which can justify the move in the euro, but the market is determined to keep their own version which is that the days of loose monetary policy are over.
The dollar index has been caught between a rock and a hard place in light of the recent Trump-Russia scandal. Jared Kushner who claims that his actions did not cross the line, left a lot to be desired with traders preparing for further losses in the dollar as the investigation continues.
On the healthcare front, no news is no good news in this case. Trump's fiscal agenda has a mountain to climb and with no progress on the horizon for the healthcare reform, we expect big question marks to arise in regard to Trump's ability to deliver.
What is most worrisome though is the President's unpredictable nature. It is no surprise that the IMF downgraded the estimates for the U.S. economic growth over the next two years to 2.1% each. The same scenario is playing out in the UK, with growth expectations reduced to 1.7% on the back of Brexit uncertainty
Oil
Something which you can cheer about when it comes to the oil price is not what they OPEC and non OPEC players said in their conference yesterday in St Petersburg. It is the increase in the declining rate of major US shale basins which should not go unnoticed. The reason for that is very simple, the rates are rising and the crude price is strong enough to encourage investors to throw their money at them. The cost simply exceeds benefits and currently some players are producing oil which is well below their breakeven cost but they have to pump that in order to pay their overheads and financing cost.
During the big oil price crash, a vast majority of investors were apprehensive about their capital return and guess what, those concerns are still here and it is only a matter of time before they will become more prominent given the gradual rate of interest rate hike which the Fed is trigging.
If you need the evidence of this, just look at Anadarko which brought these issues under the spotlight when they missed the earning forecast badly. The expected number was a loss of 33 cent when the number reported came in at 77 cent for the Q2. In order to survive in this tough environment, the only way out of this is to cut your expenses and new investments.
Gold
The precious metal is hitting highs on the back of political uncertainty over in the US. But the event which matters the most is the upcoming FOMC meeting. Given that there is no press conference after the event, we do not believe that there will be something major out of this. However, we are expecting more details on the Fed scaling down the size of their balance sheet and that would move the gold price. Overly hawkish stance would create uncertainty because everyone is worried about one thing which is what if the Fed is wrong. One wrong decision is going to change the game.