Sample Category Title
ECB Leaves Policy On Hold, Stays ‘Patient’ On Stimulus Exit
For the 24 hours to 23:00 GMT, the EUR rose 0.86% against the USD and closed at 1.1628, after the European Central Bank (ECB) President, Mario Draghi, hinted that tapering of its ultra-loose monetary policy is on the table this autumn and painted a positive outlook of the common currency region.
The ECB, at its latest monetary policy meeting, unanimously voted to hold interest rates at 0.00% and pledged to continue the asset purchase plan through December or beyond, if financial conditions become inconsistent in future. In a post-meeting statement, the ECB Chief, Mario Draghi, stated that governing council agreed in setting no precise date for a discussion about potential changes to the central bank's quantitative easing programme, but noted that it would occur in the autumn. Draghi further added that underlying inflation is likely to rise in the coming months, albeit gradually.
In other economic news, the Euro-zone's flash consumer confidence index unexpectedly fell to a level of -1.7 in July, while market participants expected it to advance to a level of -1.2. The index had registered a reading of -1.3 in the previous month. Meanwhile, the region's seasonally adjusted current account surplus widened to a level of €30.1 billion in May, following a revised current account surplus of €23.5 billion in the prior month.
Separately, in Germany, the producer price index remained flat on a monthly basis in June, after recording a drop of 0.2% in the prior month.
The greenback traded mixed against a basket of major currencies, amid reports that Special Counsel, Robert Mueller, who is investigating possible ties between the Trump campaign and Russia, was looking into business transactions involving the US President, Donald Trump.
On the macro front, initial jobless claims in the US dropped to a nearly five-month low level of 233.0K in the week ended 15 July, boosting optimism over the health of the nation's labour market. In the prior week, initial jobless claims had registered a revised reading of 248.0K, while and markets anticipated for a fall to a level of 245.0K. Further, the nation's leading indicators advanced more-than-expected by 0.6% in June, following a gain of 0.3% in the prior month.
On the contrary, the nation's Philadelphia Fed manufacturing index declined more-than-anticipated to a level of 19.5 in July, hitting its lowest level since November 2016. In the prior month, the index had recorded a reading of 27.6, compared to market consensus for a drop to a level of 23.0.
In the Asian session, at GMT0300, the pair is trading at 1.1626, with the EUR trading slightly lower against the USD from yesterday's close.
The pair is expected to find support at 1.1517, and a fall through could take it to the next support level of 1.1409. The pair is expected to find its first resistance at 1.1696, and a rise through could take it to the next resistance level of 1.1767.
With no major economic releases in the Euro-zone today, investors will focus on the flash Markit manufacturing and services PMIs for July, across the Euro-zone coupled with Germany's preliminary inflation numbers, slated to release next week.
The currency pair is trading above its 20 Hr and 50 Hr moving averages.

UK’s Retail Sales Jumped In June
For the 24 hours to 23:00 GMT, the GBP declined 0.49% against the USD and closed at 1.2963, as investors remained concerned over Brexit uncertainties.
Separately, data showed that British retail sales rose 0.6% MoM in June, topping market expectations for an advance of 0.4%, thus dispelling some concerns over the outlook for consumer spending that has faltered in the recent months. Retail sales had registered a revised drop of 1.1% in the previous month.
In the Asian session, at GMT0300, the pair is trading at 1.2963, with the GBP trading flat against the USD from yesterday's close.
The pair is expected to find support at 1.2920, and a fall through could take it to the next support level of 1.2877. The pair is expected to find its first resistance at 1.3019, and a rise through could take it to the next resistance level of 1.3075.
Moving ahead, investors will keep a close watch on UK's public sector net borrowing data for June, slated to release in a few hours.
The currency pair is showing convergence with its 20 Hr moving average and trading below its 50 Hr moving average.

Japanese Yen Trading Slightly Lower This Morning
For the 24 hours to 23:00 GMT, the USD marginally rose against the JPY and closed at 111.89.
In the Asian session, at GMT0300, the pair is trading at 111.94, with the USD trading a tad higher against the JPY from yesterday's close.
The pair is expected to find support at 111.47, and a fall through could take it to the next support level of 111.01. The pair is expected to find its first resistance at 112.41, and a rise through could take it to the next resistance level of 112.89.
Moving ahead, market participants will focus on the Bank of Japan's June meeting minutes along with Japan's jobless rate, national consumer price index and flash Nikkei manufacturing PMI, all scheduled to release next week.
The currency pair is showing convergence with its 20 Hr and 50 Hr moving averages.

Swiss Trade Surplus Narrowed In June
For the 24 hours to 23:00 GMT, the USD declined 0.35% against the CHF and closed at 0.9515.
Macroeconomic data showed that Switzerland's trade surplus narrowed to a level of CHF2.81 billion in June, following a revised trade surplus of CHF3.39 billion in the previous month.
In the Asian session, at GMT0300, the pair is trading at 0.9515, with the USD trading flat against the CHF from yesterday's close.
The pair is expected to find support at 0.9465, and a fall through could take it to the next support level of 0.9416. The pair is expected to find its first resistance at 0.9593, and a rise through could take it to the next resistance level of 0.9672.
Going forward, Switzerland's UBS consumption indicator and KOF leading indicator data, both set to be released next week, will be on investors' radar.
The currency pair is trading below its 20 Hr and 50 Hr moving averages.

Loonie Trading A Tad Lower, Ahead Of Canada’s Inflation Data
For the 24 hours to 23:00 GMT, the USD marginally declined against the CAD and closed at 1.2596.
In the Asian session, at GMT0300, the pair is trading at 1.2602, with the USD trading slightly higher against the CAD from yesterday's close.
The pair is expected to find support at 1.2548, and a fall through could take it to the next support level of 1.2495. The pair is expected to find its first resistance at 1.2648, and a rise through could take it to the next resistance level of 1.2695.
This afternoon will bring a crucial Canadian release, namely the consumer price index for June.
The currency pair is showing convergence with its 20 Hr and 50 Hr moving averages.

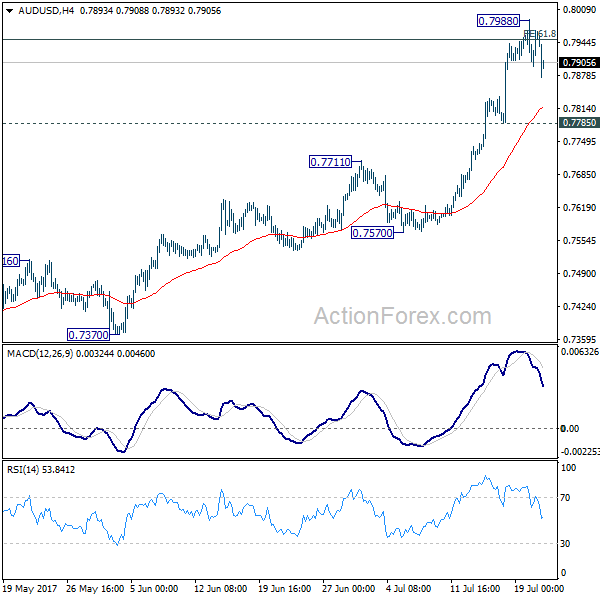
AUD/USD Daily Outlook
Daily Pivots: (S1) 0.7907; (P) 0.7947; (R1) 0.7998; More...
AUD/USD's retreat suggests that a temporary top is formed at 0.7988 after hitting 61.8% projection of 0.6826 to 0.7833 from 0.7328 at 0.7950. Intraday bias is turned neutral for consolidation. Near term outlook will remain bullish as long as 0.7785 support holds and another rise is expected. Break of 0.7988 will target 100% projection at 0.8335 next.
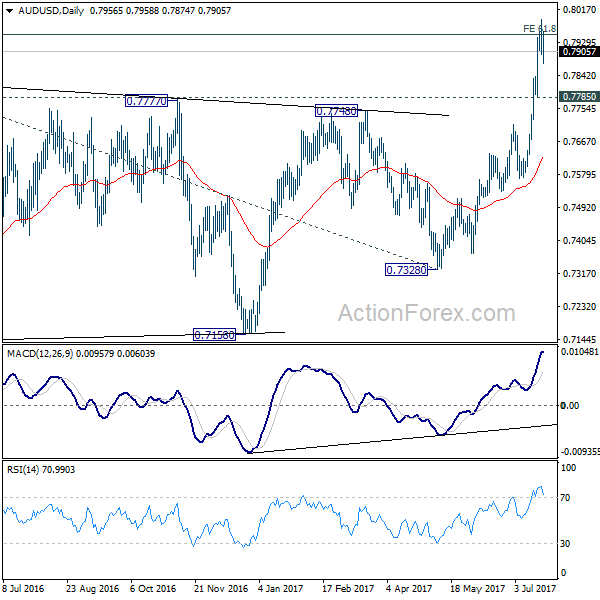
In the bigger picture, current development suggests that rebound from 0.6826 is developing into a medium term rise. There is no confirmation of trend reversal yet and we'll continue to treat such rebound as a corrective pattern. But in any case, further rise is now expected to 55 month EMA (now at 0.8100) or even further to 38.2% retracement of 1.1079 to 0.6826 at 0.8451. Break of 0.7328 support is needed to confirm completion of the rebound. Otherwise, further rise is now expected.
Oil Pulls Back Into Resistance. Is It Time For The Bears To Regain Control?
After clearing up some publishing issues that I had on the Vantage FX website yesterday, I'm back to share one last commodities trading chart before we step out for the weekend.
Oil Daily:
Price has now pulled back into the above resistance (previous support) zone and printed a sort of double top on the intraday charts.
Zooming into an intraday chart, there is some definite selling momentum coming into the market. Add the fact that yesterday's daily candle was unable to close above the previous swing high, and you have a case to look out for some bearish continuation here.
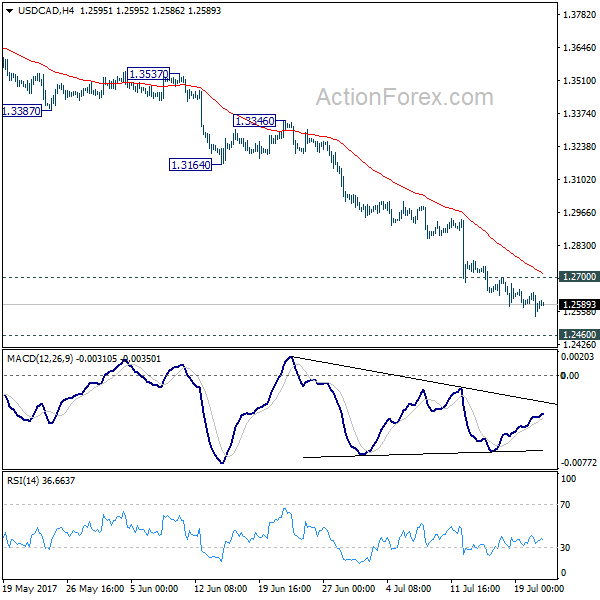
USD/CAD Daily Outlook
Daily Pivots: (S1) 1.2541; (P) 1.2591; (R1) 1.2641; More....
With 1.2700 minor resistance intact, intraday bias stays on the downside. Current fall from 1.3793 should extend to retest 1.2460 low. Meanwhile, considering bullish convergence condition in 4 hour MACD, break of 1.2700 will indicate short term bottoming In such case, there will be lengthier consolidation before staging another decline.
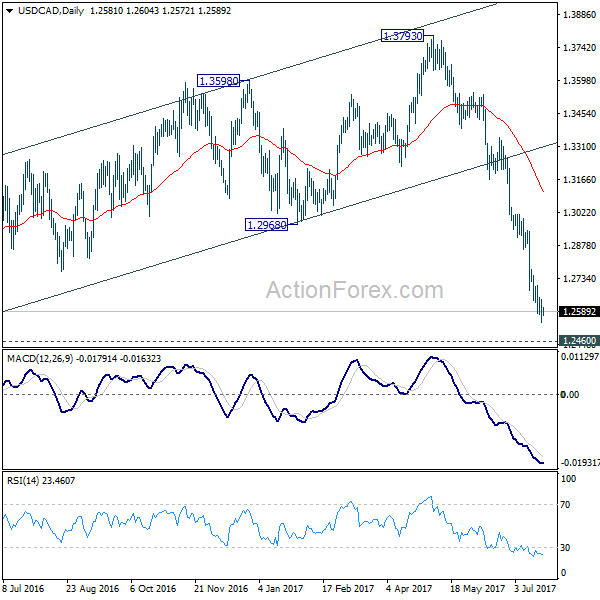
In the bigger picture, price actions from 1.4689 medium term top are seen as a correction pattern. Fall from 1.3793 is seen as the third leg and should target 50% retracement of 0.9406 to 1.4869 at 1.2048. At this point, we'd look for strong support from there to contain downside and bring rebound. However, firm break there will target 100% projection of 1.4689 to 1.2460 from 1.3793 at 1.1564.
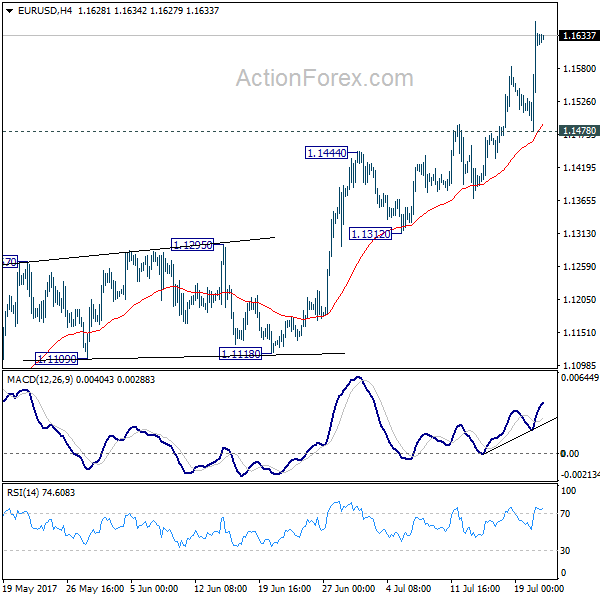
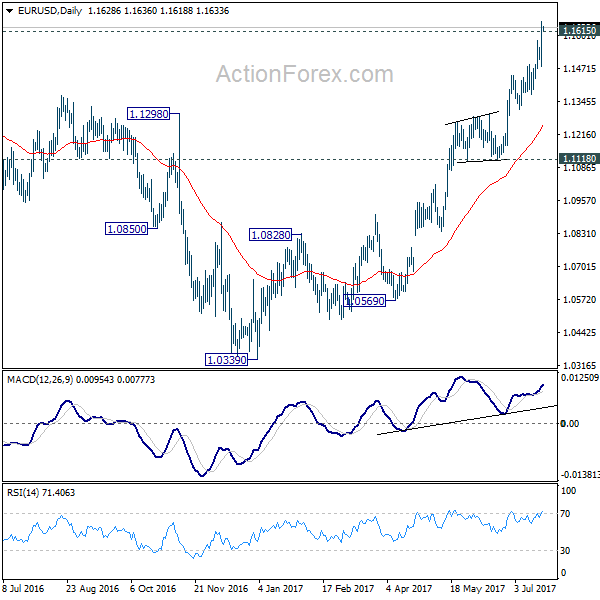
EUR/USD Daily Outlook
Daily Pivots: (S1) 1.1521; (P) 1.1589 (R1) 1.1699; More...
EUR/USD's rise resumed after briefly consolidation and broke 1.1615 key resistance. Intraday bias is back to the upside. Sustained trading above 1.1615 will extend the medium term rise to 1.2 handle next. On the downside, break of 1.1478 support is needed to indicate short term topping. Otherwise, outlook will remain bullish in case of retreat.
In the bigger picture, the firm break of 1.1298 resistance further affirm medium term reversal. That is, an important bottom was formed at 1.0339 on bullish convergence condition in weekly MACD. Further rise would be seen to 55 month EMA (now at 1.1756). Sustained break there will pave the way to 38.2% retracement of 1.6039 (2008 high) to 1.0339 (2017 low) at 1.2516 next. This will now remain the favored case as long as 1.1118 support holds.
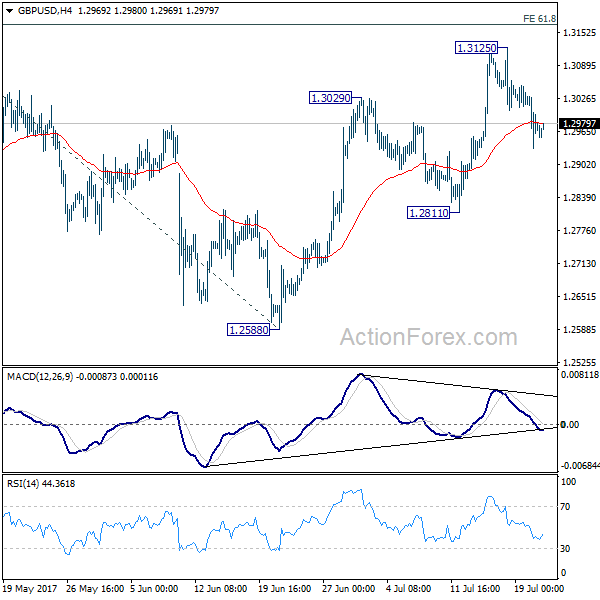
GBP/USD Daily Outlook
Daily Pivots: (S1) 1.2926; (P) 1.2979; (R1) 1.3026; More...
GBP/USD is still staying in range of 1.2811/3125 and intraday bias remains neutral. Another rise is mildly in favor with 1.2811 intact. Break of 1.3125 will target 61.8% projection of 1.2108 to 1.3047 from 1.2588 at 1.3168. Overall, choppy rebound from 1.1946 is seen as a corrective pattern, hence, we'd be cautious on strong resistance from 1.3168 to limit upside. But firm break of 1.3168 will bring further rise towards 1.3444 key resistance. Meanwhile, break of 1.2811 support will be the first sign of reversal and will turn bias to the downside to target 1.2588 key support next.
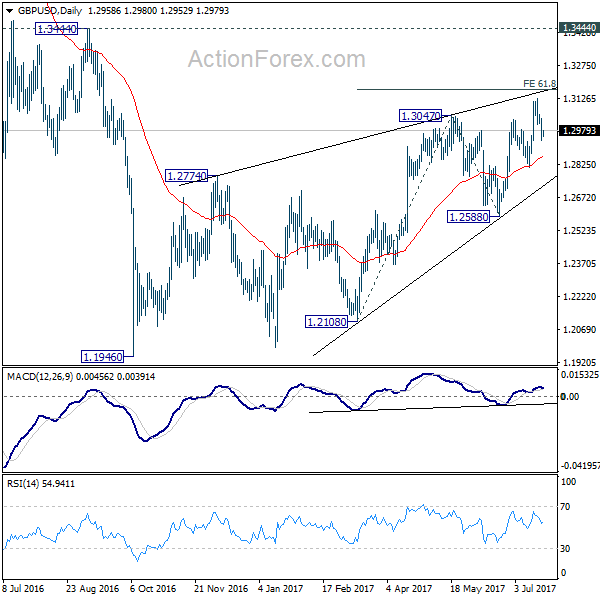
In the bigger picture, overall, price actions from 1.1946 medium term low are seen as a corrective pattern that is still in progress. While further upside is expected, overall outlook remains bearish as long as 1.3444 key resistance holds. Larger down trend from 1.7190 is expected to resume later after the correction completes. And break of 1.2588 will indicate that such down trend is resuming.