
Sample Category Title
USD/CHF Daily Outlook
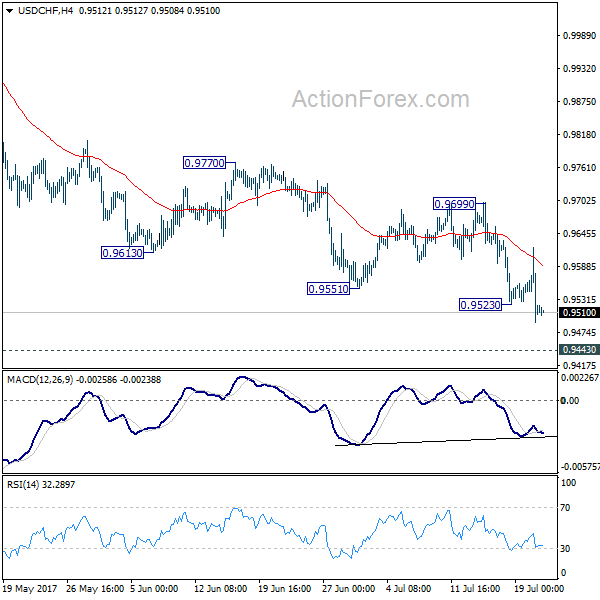
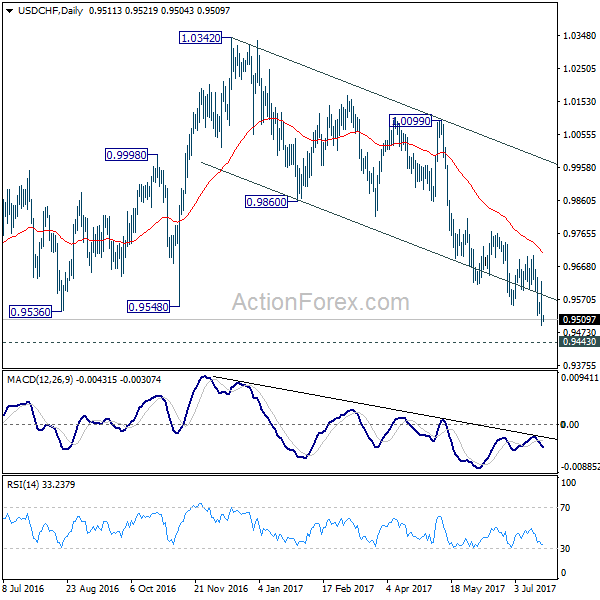
Daily Pivots: (S1) 0.9464; (P) 0.9541; (R1) 0.9590; More...
USD/CHF's decline resumed after brief consolidation and intraday bias is turned back to the downside. Current fall from 1.0342 should target target 0.9443 key support level next. At this point, we'd expect strong support from there to bring rebound. On the upside, break of 0.9699 resistance is needed to confirm short term bottoming. Otherwise, outlook will remain bearish in case of recovery.
In the bigger picture, USD/CHF is still bounded in medium term range of 0.9443/1.0342 for the moment. Consolidative trading would likely continue and medium term outlook remains neutral. Break of 1.0342 key resistance is needed to confirm underlying bullish momentum in the pair. Meanwhile, downside attempts should be contained by 0.9443 key support level. However, sustained break of 0.9443 will carry larger bearish implication and target 0.9 handle.
USD/JPY Daily Outlook
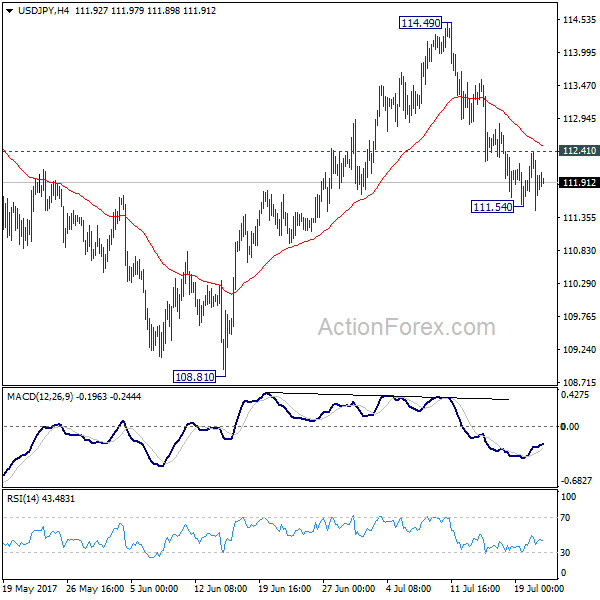
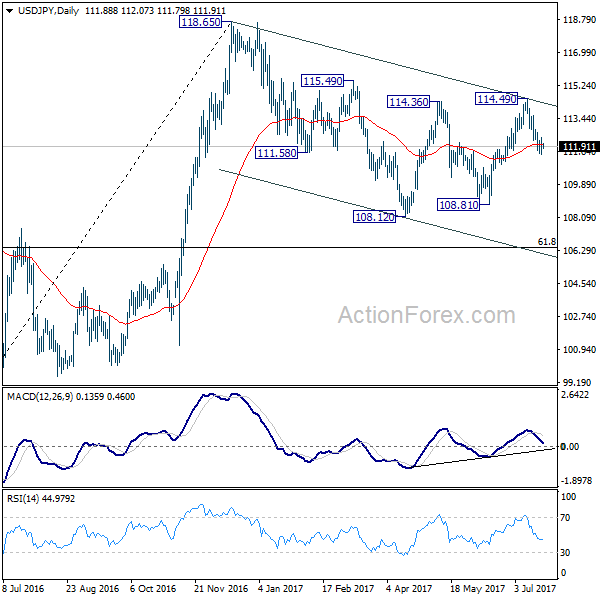
Daily Pivots: (S1) 111.44; (P) 111.93; (R1) 112.38; More...
Breach of 111.54 suggests that fall from 114.49 is resuming. Intraday bias is turned back to the downside. Sustained trading below 55 day EMA will bring deeper decline to 108.81 support. Break there will extend the whole correction from 118.65 to 61.8% retracement of 98.97 to 118.65 at 106.48. Nonetheless, break of 112.41 will turn focus back to 114.49 resistance instead.
In the bigger picture, the corrective structure of the fall from 118.65 suggests that rise from 98.97 is not completed yet. Break of 118.65 will target a test on 125.85 high. At this point, it's uncertain whether rise from 98.97 is resuming the long term up trend from 75.56, or it's a leg in the consolidation from 125.85. Hence, we'll be cautious on topping as it approaches 125.85. If fall from 118.65 extends lower, down side should be contained by 61.8% retracement of 98.97 to 118.65 at 106.48 and bring rebound.
GBP/JPY Daily Outlook
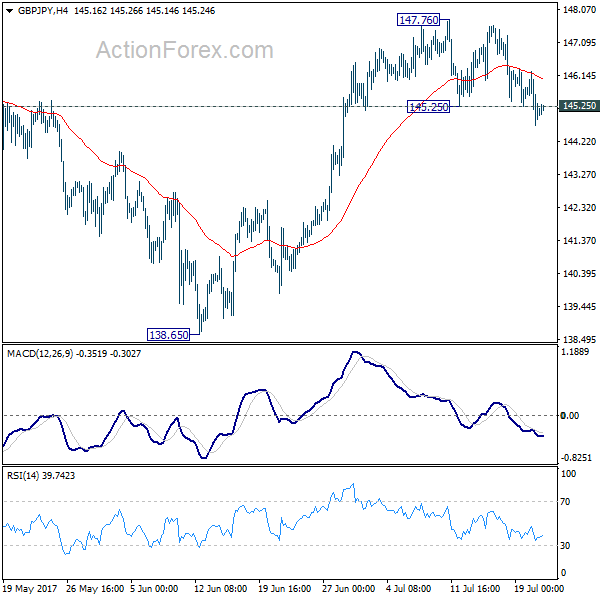
Daily Pivots: (S1) 144.47; (P) 145.38; (R1) 146.06; More
Break of 145.25 support suggests that fall from 147.76 is resuming. intraday bias is turned back to the downside for 55 day EMA (now at 144.07) first. Sustained break there will target r138.65 support and below. But we'd expect strong support from 135.58 to contain downside and bring rebound.
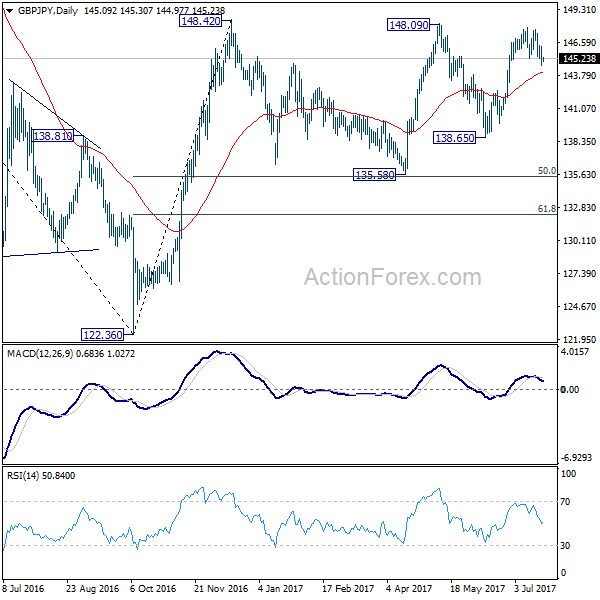
In the bigger picture, rise from medium term bottom at 122.36 is expected to continue to 38.2% retracement of 196.85 to 122.36 at 150.43. Decisive break there will carry long term bullish implications and pave the way to 61.8% retracement at 167.78. In case the sideway pattern from 148.42 extends, we'd be looking for strong support from 135.58 and 50% retracement of 122.36 to 148.42 at 135.39 to contain downside.
EUR/JPY Daily Outlook
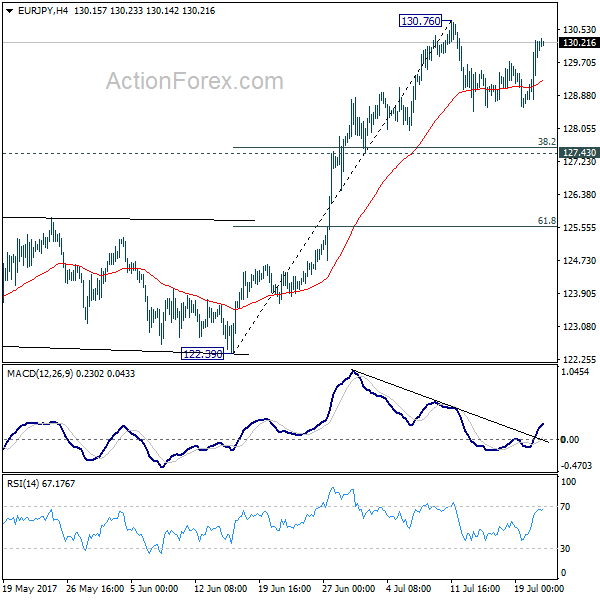
Daily Pivots: (S1) 129.19; (P) 129.73; (R1) 130.67; More...
EUR/JPY is staying below 130.76 and intraday bias remains neutral for the moment. Consolidation from 130.76 could extend. But in case of another fall, downside should be contained by 127.43 cluster support (38.2% retracement of 122.39 to 130.76 at 127.56) and bring rebound. Above 130.76 will extend the larger rally to next key fibonacci level at 134.20.
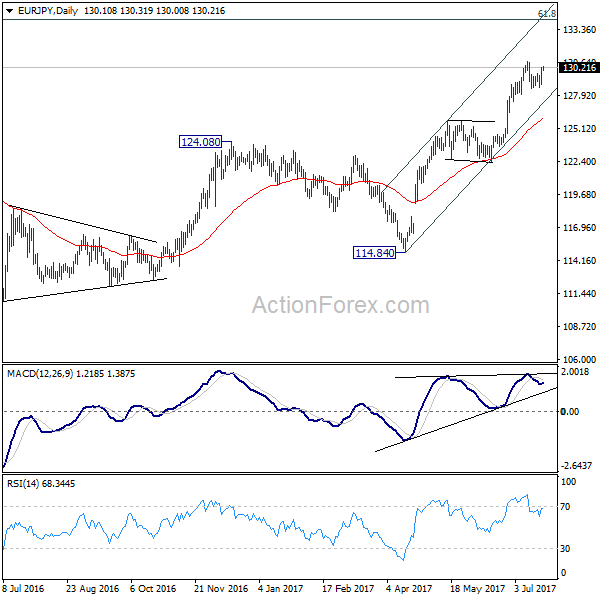
In the bigger picture, the down trend from 149.76 (2014 high) is completed at 109.03 (2016 low). Current rally from 109.03 should be at the same degree as the fall from 149.76 to 109.03. Further rise is expected to 61.8% retracement of 149.76 to 109.03 at 134.20. Sustained break there will pave the way to key long term resistance zone at 141.04/149.76. Medium term outlook will remain bullish as long as 124.08 resistance turned support holds.
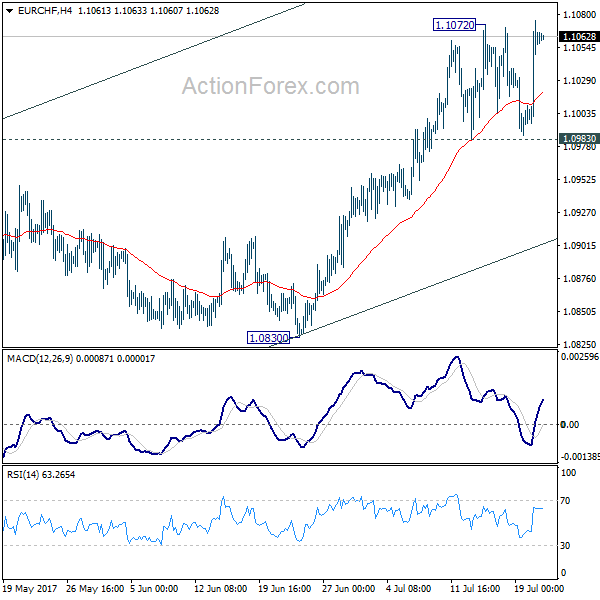
EUR/CHF Daily Outlook
Daily Pivots: (S1) 1.1010; (P) 1.1043; (R1) 1.1096; More...
Breach of 1.1072 indicates resumption of recent rally. Intraday bias is back on the upside to extend the rise from 1.0629 to 1.1127/98 resistance zone. On the downside, break of 1.0983 will indicate short term topping and turn bias back to the downside for 55 day EMA (now at 1.0919).
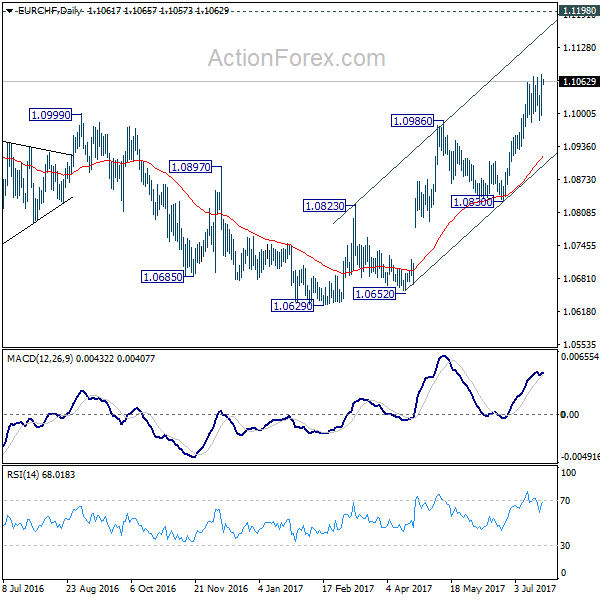
In the bigger picture, the price actions from 1.1198 are seen as a corrective move. Such correction could have completed after defending 38.2% retracement of 0.9771 to 1.1198 at 1.0653. Decisive break of 1.1198 will resume the long term rise from SNB spike low back in 2015. In such case, EUR/CHF could eventually head back to prior SNB imposed floor at 1.2000. However, rejection from 1.1198 will extend the multi-year range trading with another fall.
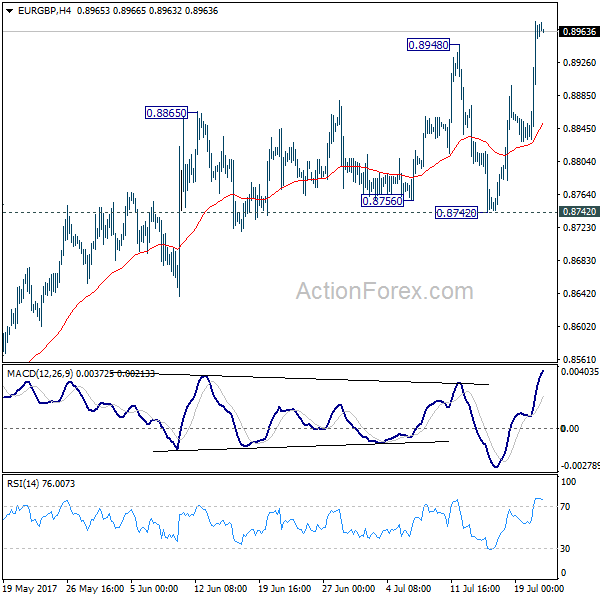
EUR/GBP Daily Outlook
Daily Pivots: (S1) 0.8872; (P) 0.8924; (R1) 0.9017; More
EUR/GBP's strong rise and break of 0.8948 indicates resumption of whole rebound from 0.8312. Intraday bias is turned back to the upside. Current rise would now target a test on 0.9304 high. On the downside, break of 0.8742 support is needed to indicate short term topping. Otherwise, further rise is in favor even in case of retreat.
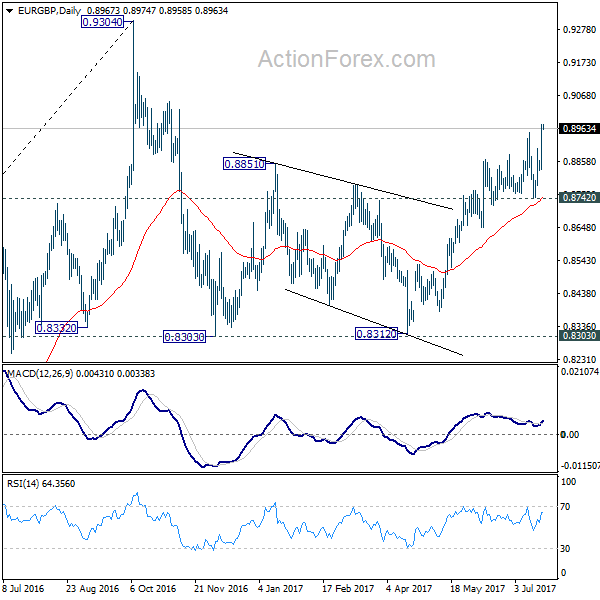
In the bigger picture, price actions from 0.9304 are viewed as a medium term corrective pattern. It's uncertain whether it is finished yet. But in case of another fall, we'd expect strong support from 0.8116 cluster support (50% retracement of 0.6935 to 0.9304 at 0.8120) to contain downside and bring rebound. Whole up trend from 0.6935 is expected to resume after consolidation from 0.9304 completes.
EUR/AUD Daily Outlook
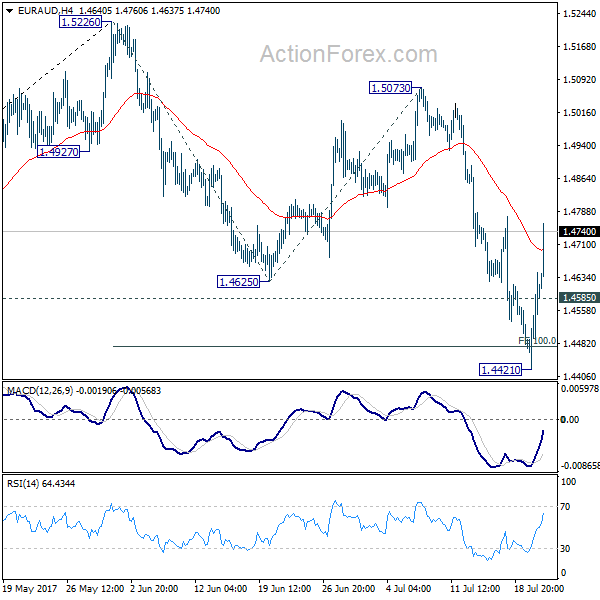
Daily Pivots: (S1) 1.4474; (P) 1.4561; (R1) 1.4701; More...
EUR/AUD's strong rebound indicates short term bottoming at 1.4421, after hitting 100% projection of 1.5226 to 1.4625 from 1.4472. The development also suggests completion of the correction from 1.5226, with three waves down to 1.4421. Intraday bias is back on the downside. Sustained trading above 55 day EMA (now at 1.4744) will target 1.5073 resistance. Break there will indicate resumption of whole rise from 1.3624. On the downside, below 1.4585 minor support will turn focus back to 1.4421 instead.
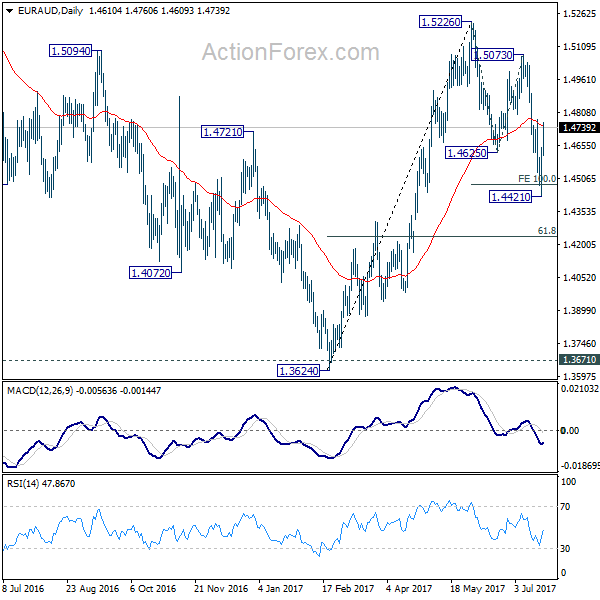
In the bigger picture, we're holding on to the view that corrective decline from 1.6587 medium term has completed at 1.3624. Rise from 1.3624 is expected to resume to retest 1.6587. The corrective structure of the fall from 1.5226 is affirming this view. Above 1.5226 will target a test on 1.6587 key resistance. However, further downside acceleration will dampen our view and would drag EUR/AUD lower to retest key support zone around 1.3624.
Euro Maintains Post ECB Gains, Aussie Tumbles on RBA Deputy Debelle
Euro surged broadly overnight as markets took ECB President Mario Draghi's comments positively. EUR/USD is now in an important medium term resistance zone of 1.1615/1713 and is maintaining solid upside momentum. The coming weeks will be important for the common currency. Sustained break of the current resistance zone would build up the base for a take on 1.2 handle by the end of the year. Against others, EUR/GBP also took out 0.8948 resistance and is now resuming the rise from 0.8312 towards 0.9304 key resistance. EUR/AUD also showed strong rebound which could have marked the completion of whole correction pattern from 1.5226 at 1.4421.
Elsewhere in the forex markets, Aussie is the next biggest mover after cautious comments from RBA Deputy Governor Guy Debelle regarding neutral rate. Sterling remains the weakest one for the week as rate bet cooled after weaker than expected inflation data released earlier in the week. Dollar closely followed as markets continue to doubt the whether Fed is ready to raise interest rate again if US President Donald Trump cannot push through his economic policies. Canadian Dollar will look into today's CPI and retail sales data for fuel to extend recent rally.
Euro surges as Draghi promised QE discussions
ECB kept the main refi rate, the marginal lending rate and the deposit rate unchanged at 0%, 0.25% and -0.4% respectively. The central bank also affirmed that the QE program would be maintained at the monthly pace of 60B euro, which is "intended to run until the end of December 2017, or beyond, if necessary, and in any case until the Governing Council sees a sustained adjustment in the path of inflation consistent with its inflation aim". While leaving the policies and statement unchanged, Draghi promised QE discussions to begin in autumn. However, he refused to comment whether it means the September 7 meeting. That is seen as the main driver of Euro's rally. More in EURUSD Rallied to Fresh 14-Momnth High as Draghi Promised QE Discussions in Autumn
RBA Delle: Don't read too much into neutral rate discussions
RBA Debelle urged the markets not to read too much into the board's discussion on neutral rate. He said that "no significance should be read into the fact the neutral rate was discussed at this particular meeting" And, "most meetings, the board allocates some time to discussing a policy-relevant issue in more detail, and on this occasion it was the neutral rate." He also emphasized that "other central banks increase their policy rates does not automatically mean that the policy rate here needs to increase."
Looking ahead, UK will release public sector net borrowing in European session. Canada will release CPI and retail sales in US session.
EUR/AUD Daily Outlook
Daily Pivots: (S1) 1.4474; (P) 1.4561; (R1) 1.4701; More...
EUR/AUD's strong rebound indicates short term bottoming at 1.4421, after hitting 100% projection of 1.5226 to 1.4625 from 1.4472. The development also suggests completion of the correction from 1.5226, with three waves down to 1.4421. Intraday bias is back on the downside. Sustained trading above 55 day EMA (now at 1.4744) will target 1.5073 resistance. Break there will indicate resumption of whole rise from 1.3624. On the downside, below 1.4585 minor support will turn focus back to 1.4421 instead.
In the bigger picture, we're holding on to the view that corrective decline from 1.6587 medium term has completed at 1.3624. Rise from 1.3624 is expected to resume to retest 1.6587. The corrective structure of the fall from 1.5226 is affirming this view. Above 1.5226 will target a test on 1.6587 key resistance. However, further downside acceleration will dampen our view and would drag EUR/AUD lower to retest key support zone around 1.3624.
Economic Indicators Update
| GMT | Ccy | Events | Actual | Forecast | Previous | Revised |
|---|---|---|---|---|---|---|
| 08:30 | GBP | Public Sector Net Borrowing (GBP) Jun | 4.3B | 6.0B | ||
| 12:30 | CAD | CPI M/M Jun | 0.00% | 0.10% | ||
| 12:30 | CAD | CPI Y/Y Jun | 1.10% | 1.30% | ||
| 12:30 | CAD | CPI Jun | 130.5 | |||
| 12:30 | CAD | CPI Core - Common Y/Y Jun | 1.30% | |||
| 12:30 | CAD | CPI Core - Trim Y/Y Jun | 1.20% | |||
| 12:30 | CAD | CPI Core - Median Y/Y Jun | 1.50% | |||
| 12:30 | CAD | Retail Sales M/M May | 0.40% | 0.80% | ||
| 12:30 | CAD | Retail Sales Less Autos M/M May | 0.40% | 1.50% |
Elliott Wave View: DXY Resuming Downside
Revised short term DXY (USD Index) Elliott Wave view suggests the decline from 6/20 peak (97.87) is unfolding as a double three Elliott wave structure. Down from 97.87 high, decline to 95.47 ended Minor wave W, and bounce to 96.51 high ended Minor wave X. Wave Y is unfolding as another double three Elliott wave structure of a smaller degree where Minute wave ((w)) ended at 94.47 and Minute wave ((x)) ended at 95.17. The Index has broken below 94.47 suggesting Minute wave ((y)) lower has started. Down from 94.47, Minutte wave (w) ended at 94.09, and Minutte wave (x) is in progress to correct cycle from 7/20 peak before Index resumes lower. We don’t like buying the proposed bounce and expect sellers to appear after Minutte wave (x) bounce is complete in 3, 7, or 11 swing as far as pivot at 95.17 stays intact.
DXY 1 Hour Elliott Wave Chart
Market Morning Briefing: The Euro Rose To 1.158
STOCKS
Dow (21611.78, -0.13%) could inch up gradually towards resistance near 21800 in the coming sessions before seeing another leg of sharp correction towards 21600. Near term looks bullish.
Dax (12447.25, -0.04%) is stuck just above the near term channel support and while that holds, a ounce could be expected in the next couple of sessions. Only on a break below the support levels of 12400, we would shift our focus to lower levels of 12300-12200.
Shanghai (3237.94, -0.21%) has come off a bit after testing resistance near 3250 and while that holds, a short dip towards 3220 is possible before resuming the rally towards 3260 again.
Nikkei (20093.46, -0.25%) is stuck in the 19900-20200 region since the beginning of the month. While Dollar Yen trades lower, it would be difficult to see a sharp rise in Nikkei and we could possibly see some movement in the 19900-20200 for the next few sessions too. A break below 19900 could initiate some corrective dip in the medium term.
Nifty (9873.30, -0.27%) could see a sharp correction in the coming sessions after testing important resistance of 10000-10050 levels maybe next week itself. The correction from 10000 could take it lower to levels near 9800-9700 over the medium term. This is our preferred view for now.
COMMODITIES
Gold (1245) and Silver (16.33) are hovering around the second crucial Resistance of 1246 and 16.50 respectively. A break above 1245 is necessary for gold to remain bullish towards 1260 for the near term else a fall below 1230 could take it lower towards 1220. Silver is trading within the range of 16.20-16.50 and a close above 16.50 could open up 16.90 levels as well.
Muted price action had been seen in Copper (2.71) for last couple of trading sessions. It is trading within a range of 2.66-78. Only above 2.78, higher resistances of 2.80 can come into consideration. In the medium term 2.55-57 are going to be a strong support and we will remain bullish while it is trading above those levels.
Both Brent (49.25) and WTI (46.80) are trading within the ranges of 48-50.20 and 45.80-48.30 respectively. We will remain bullish in near term while Brent and WTI are trading above 48 and 46 on a weekly closing basis. Only a close below those levels could bring the near term bearish possibilities into consideration
FOREX
Sharp 200 pip upmove in the Euro after the ECB meeting and press conference as Draghi said that in September, the ECB will start discussing tapering the ongoing QE which is expected to run till December at least. The market is building in chances of the Taper starting from Jan '18 itself.
The Euro (1.1625) rose to 1.158, a little short of the 1.1713 horizontal Resistance, which was the high seen in Aug '15. If this Resistance continues to hold, we could see a dip towards 1.1450 again over the next couple of weeks. A straight rise past 1.1713 is also a possibility and will trigger a lot of stop loss buying if it happens. We will wait and watch.
Resultant weakness in the Dollar Index (94.30) now targets 93 over the next couple of weeks. This has pulled down Dollar-Yen (111.97) with it, with chances of testing 111.00 next week. Strong bounce possible from the 111.00-110.50 region, though.
The Aussie (0.7880) has retreated quite a bit from the high of 0.7988 seeen yesterday, in line with the "couple of days of rest" suggested yesterday. This could bring the Aussie down to 0.7800 next week. We shall have to assess its fresh direction from there.
Strength in the Euro has caused Dollar-Rupee to open lower near 64.35, after having peeped up above 64.40 yesterday.
INTEREST RATES
Draghi indicated a continuation of the asset purchase programme which is likely to continue at least till December and further said that they would discuss on when to wind it up in the September meeting of the ECB.
The German yields continue to fall and have least reacted to the ECB meeting yesterday. The 10YR is trading at 0.53% compared to 0.55% yesterday and could come off a little more towards 0.49% before pausing.
The US yields are also headed downwards as expected. The 30Yr (2.83%) is headed towards 2.80% while the 10Yr (2.27%) could come off towards 2.20/23%.
The US-Japan 10Yr (2.19%) has little room on the downside just now and could bounce back in the early sessions next week possibly pulling up Dollar Yen along with itself. 2.16% could act as a decent near term support.
The German-US 10Yr (-1.74%) is testing immediate support and while that holds, it could bounce back to higher levels.