Sample Category Title
Dollar Bears
UK Consumer Price Index (CPI) data was released on Tuesday showing inflation easing for the first time in nearly 10 months, retreating from the near 4-year high touched in May, as fuel prices fell substantially in the UK in June. The consumer price index increased by an annual rate of 2.6% in June, falling below the consensus forecast of 2.9%, and below the 2.9% rise recorded in May. UK inflation is above the BoE’s 2.0% target for the 5th straight month, but the slowdown in the rate of inflation is likely to dull calls from some of the UK Monetary Policy Committee members for a near-term hike in UK interest rates.
USD fell back to an 11-month low against many of its G-10 counterparts as President Trump’s economic revitalization agenda stumbled with his health care reform bill “dead in the water”, as 2 more of his own party’s Senators announced their opposition to the plan.
EUR gained nearly 1% on the day versus USD as EURUSD reached a high of 1.15828, levels not seen for over 1 year. The market is cautious of pushing EURUSD too high for fear that the European Central Bank policy meeting on Thursday proves less hawkish than the bulls are hoping for. Currently, EURUSD is trading around 1.1535.
GBP fared poorly against overall USD weakness as CPI data showed UK inflation falling in June. GBPUSD traded down as the data was released, moving from the day’s high of 1.31251 to trade as low as 1.30044 on the day. Currently, GBPUSD is trading around 1.3040.
The USD bears were seen in USDJPY as the USD sell-off saw the pair back off from early highs of 112.618, to give up 0.7% on the day to trade as low as 111.681. The Bank of Japan is expected to keep economic policy unchanged at its scheduled meeting on Thursday. Currently, USDJPY is trading around 112.15.
AUDUSD improved over 1.8% on the day as a resolute Reserve Bank of Australia stated it isn’t ready to join global Central Banks in reducing policy stimulus. AUDUSD traded off early lows of 0.77859 to trade up to a new 2 year high of 0.79424 on the day. Currently, AUDUSD is trading around 0.7930.
Ahead of today’s EIA report on US Oil Inventories WTI has also benefitted from USD weakness, trading from $46.02pb to a high on the day of $47.12pb. The US EIA Inventories data releasing today will likely cause significant volatility in Oil. WTI is currently trading around $46.50pb.
Gold gained 0.7% on the day to trade as high as $1,243.30, a level not seen since the start of July. Currently, Gold is trading around $1,241.
At 13:30 BST US Housing Starts (MoM) (Jun) will be released. The consensus is for an improvement to 1.150 Million from the previous reading of 1.092 Million. An improved number will be seen as vindication that the US economy is growing, amid recent mixed economic data releases.
At 15:30 BST the United States Energy Information Administration (EIA) will release the EIA Crude Oil Stocks change (Jul 14). The previous drawdown of -7.5645 Million is expected to improve to a drawdown of -3.740 Million.
Technical Outlook: EURUSD Eases On Profit-Taking But Quiet Trading Expected Ahead Of ECB
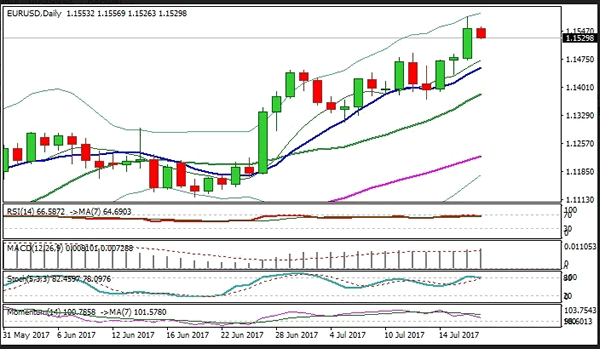
The Euro eases in early Wednesday's trading after posting new 2 1/2 month high at 1.1583 on strong acceleration on Tuesday. Profit-taking on past three-day rally could drag the price further down, as overbought slow stochastic and RSI are turning lower on daily chart. Psychological support at 1.1500 and rising Tenkan-sen (1.1476) should ideally contain dips and keep bulls in play, as bulls eye targets at 1.1614 and 1.1716/35 in extension. However, today's trading is likely to be within limited range as markets are focusing on tomorrow's ECB policy meeting which is expected to provide stronger signals.
Res: 1.1565, 1.1614, 1.1643, 1.1716
Sup: 1.1500, 1.1476, 1.1452, 1.1400
Trade Idea : GBP/USD – Sell at 1.3090
GBP/USD - 1.3039
Most recent candlesticks pattern : N/A
Trend : Near term up
Tenkan-Sen level : 1.3037
Kijun-Sen level : 1.3066
Ichimoku cloud top : 1.3076
Ichimoku cloud bottom : 1.3029
New strategy :
Sell at 1.3090, Target: 1.2990, Stop: 1.3125
Position : -
Target : -
Stop : -
Although the British pound rose briefly to 1.3126, the subsequent retreat suggests temporary top is possibly formed and consolidation below this level would be seen with mild downside bias, below support at 1.3005 would add credence to this view, bring retracement of recent upmove to 1.2965-70 (50% Fibonacci retracement of 1.2812-1.3126), then test of previous resistance at 1.2955 but reckon 1.2930-35 (61.8% Fibonacci retracement) would limit downside and support at 1.2912 should remain intact.
In view of this, we are looking to sell cable on recovery as 1.3090-00 should limit upside. Only break of said yesterday’s high at 1.3126 would signal recent upmove has resumed and extend gain to 1.3150-60 but upside should be limited to 1.3190-00, bring retreat later.

Trade Idea : EUR/USD – Buy at 1.1495
EUR/USD - 1.1538
Most recent candlesticks pattern : N/A
Trend : Near term up
Tenkan-Sen level : 1.1540
Kijun-Sen level : 1.1547
Ichimoku cloud top : 1.1496
Ichimoku cloud bottom : 1.1470
Original strategy :
Buy at 1.1335, Target: 1.1440, Stop: 1.1300
Position : -
Target : -
Stop : -
New strategy :
Buy at 1.1495, Target: 1.1595, Stop: 1.1460
Position : -
Target : -
Stop : -
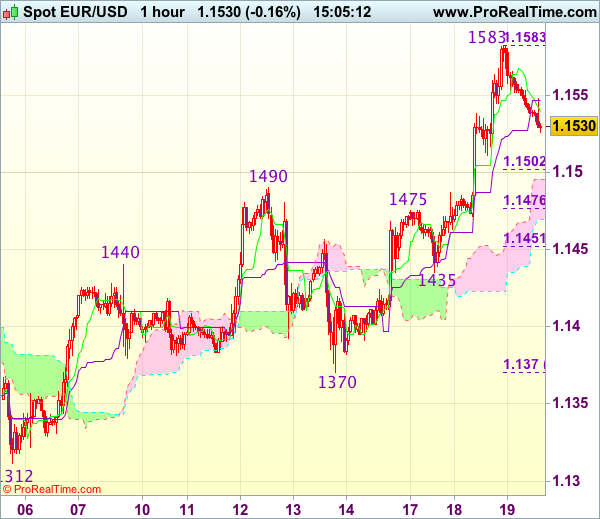
As the single currency has retreated after surging to 1.1583 yesterday, suggesting consolidation below this level would be seen and pullback to 1.1500-05 (38.2% Fibonacci retracement of 1.1370-1.1583) cannot be ruled out, however, reckon previous resistance at 1.1490 would contain downside and bring another upmove later, above said resistance at 1.1583 would extend recent upmove to 1.1600-10 and then 1.1630 but loss of upward momentum should prevent sharp move beyond 1.1650-60.
In view of this, we are looking to buy euro on further pullback as previous resistance at 1.1490 should turn into support and contain downside, bring another rise. Below 1.1475-76 (another previous resistance and 50% Fibonacci retracement of 1.1370-1.1583) would defer and signal top is formed, risk correction to 1.1450-55 (61.8% Fibonacci retracement) and then test of support at 1.1435 which is likely to hold from here.
Currencies: Dollar Decline Slows, At Least For Now
Sunrise Market Commentary
- Rates: Summer trading set to continue
Today's eco calendar remains razor thin with only US housing starts and building permits. Normally they are no market mover, but a downward surprise won't go unnoticed and could benefit US Treasuries further. Overall, we expect trading to remain confined to tight ranges ahead of the ECB. If any, core bonds could trade with a small upward bias. - Currencies: Dollar decline slows, at least for now
Yesterday, the USD was aggressively sold in Asia and in Europe, but tensions eased in US trading. US housing data probably won't be a game-changer for USD trading. The dollar desperately needs high profile good news, but that isn't available right now. Some consolidation might be on the cards today, but a sustained USD rebound isn't around the corner yet.
The Sunrise Headlines
- After an initial decline due to the failure of Republican efforts to end Obamacare, American equity markets rebounded. The tech-heavy Nasdaq closed at a record high. The good mood transferred to Asian markets.
- The Australian Prudential Authority announced that the country's four major banks would need to have tier 1 capital ratios of at least 10.5%. The announcement was less onerous than expected.
- China's holdings of US Treasuries climbed to the highest level since the country ceded its status as America's largest creditor nation to Japan last year. China's total holding of US paper rose by $10B from a month prior to $1.1T in May.
- Greece's return to bond markets is held off partly due to a ceiling set by the IMF on the amount of debt the country can hold, according to unnamed officials. The IMF is expected to discuss a new credit line to Greece tomorrow.
- US President Trump said he was disappointed about the collapse of Republicans' efforts to replace or repeal Obamacare and added that his plan was now to “let Obamacare fail”.
- Not much on the eco calendar today apart from the US housing starts and building permits data and a German bond auction
Currencies: Dollar Decline Slows, At Least For Now
Dollar decline takes a breather
On Tuesday, the dollar nosedived after Conservative lawmakers in the US admitted that a repeal/replacement of Obamacare won't occur anytime soon. Dollar selling was aggressive in Asia and in Europe, but eased later in US dealings. EUR/USD settled north of the 1.1489/1.15 resistance and finished the session at 1.1554. LT interest rate differentials between the US and Germany narrowed further. USD/JPY dropped temporary below the 112 handle but finished the day at 112.07.
Overnight, Asian equities mostly show modest gains as the tension due to the Obamacare stalemate are ebbing. USD/JPY stabilizes near the 112 pivot. EUR/USD trades in the 1.1535 area, off yesterday's correction top (1.1583 area). There is no high profile story to guide trading. Investors are looking forward to tomorrow's BOJ and ECB policy meetings. The Aussie dollar takes a breather after its recent impressive run. AUD/USD is changing hands in the 0.7920/25 area.
Today, the eco calendar is thin with only US housing starts and permits able to move markets. They will get more attention than usually. Starts disappointed over the previous three months, permits during three of the last four months. A rebound is expected as special (weather) factors were probably in play during spring. If the rebound fails to materialize, it might weigh push US yields and the dollar lower. In a day-to-day perspective, we expect some USD calm to return as investors are looking forward to tomorrow's BOJ and ECB decision. We don't expect a meaningful rebound of the dollar. Investors will be cautious to be euro short going into the ECB meeting. We expect the ECB to maintain a balanced approach, but hints on a gradual policy normalisation may trigger more euro gains.
In a broader perspective, the dollar was in the defensive of late. Mediocre US wage growth, Yellen's focus on the recent setback in inflation and soft eco data made markets questioning the pace of future Fed normalisation and weighed on the USD. Initially, EUR/USD didn't retest the 1.1489/1.15 resistance, but this area was broken yesterday on the failure to replace Obamacare. In a longer term perspective, the market discounts very little Fed policy normalisation. At some point this might lend the dollar support. However, in a day-to-day perspective there is no reason to try to catch the falling USD. The dollar needs high profile good news and that isn't available at this stage.
USD: technical picture worsens further
End June, EUR/USD rebounded above the 1.1300/66 resistance. The payrolls and other recent data were not good enough to trigger a sustained USD rebound. Yesterday EUR/USD broke beyond the 1.1489/1.15 resistance. This break opens the door to the LT-correction tops at 1.1616/1.1714. A break would end the long consolidation that followed the sharp decline of EUR/USD in 2014/early 2015. Such a key area is not easy to break. We don't preposition for a break, but the pressure is mounting. Return action below 1.13 would be a first indication of a loss in upside momentum. EUR/USD 1.1119/10 is the next support.
The USD/JPY rally ran into resistance in May and the pair returned lower in the 108.13/114.37 range. The post-Fed USD rebound pushed the pair above the 112.13 correction top, but follow-through gains remain modest. USD/JPY 114.37 resistance was tested, but for now the test is rejected. This suggests a pause in the recent USD/JPY uptrend. We stay cautious on USD/JPY long positions despite the recent decent performance.
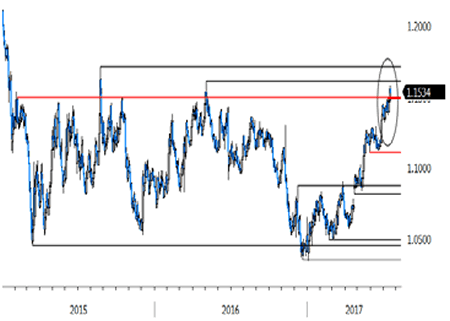
EUR/USD nears top of LT consolidation pattern as dollar tumbles on failure to repeal Obamacare act
EUR/GBP
EUR/GBP holding near recent top
Sterling was mostly driven by technical considerations of late. Eco data again came in play yesterday. UK CPI unexpectedly declined from 2.9% Y/Y to 2.6% Y/Y (2.9% was expected).The report eased market expectation/speculation that the BoE would raise its policy rate in the near future. EUR/GBP jumped from the 0.88 area to levels just shy of 0.89 and closed the session at 0.8860. EUR/USD strength reinforced the move. Cable initially lost a full big figure despite broad-based US weakness but rebounded slightly later as USD-selling eased. The pair finished the session at 1.3040.
Today, there are no important eco-data in the UK. Given the thin calendar in the US and Europe, trading in the euro and to dollar will probably also provide little guidance. Brexit remains a wildcard, but it is probably too early to expect big news from the negotiations. So, sterling might also shift into consolidation mode today.
From a technical point of view, EUR/GBP recently broke above the 0.8854/66 resistance (2017 top) to set a new correction top north of 0.89, but the move finally fell prey to profit taking (sterling short squeeze). A break below 0.8720 would suggest that upside momentum is easing. For now, we see all sterling rebounds as technical in nature and don't expect them to last very long. We still look to buy EUR/GBP on more pronounced dips. For that the happen, EUR/GBP probably needs some help from a correction in EUR/USD. This isn't the case yet
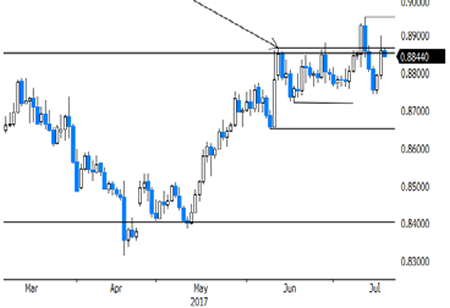
EUR/GBP correction short-lived as sterling declines again after soft inflation data
No Change From BoJ Expected, At Least Not Tomorrow
Market consensus of for now change of policy tomorrow, yet with bond markets continuing to give BoJ a headache then a change of some sort cannot be fully discounted at some point.
The Bank of Japan hold their monetary policy meeting tomorrow, which is already having a suppressive effect on price action as we near it. Alongside the usual press conference, statement and decision, the quarterly outlook report will also be released. As we expect no changes to policy tomorrow, it may be the outlook report that is more telling about their confidence of the recovery to be sustained. Yet we cannot rule out a surprise from BoJ regarding their 0% target on JGB's.
Since their last meeting the game has changed somewhat; ECB have turned slightly more hawkish (which prompted BoE ad BoC to follow suit) whilst the FED turned slightly dovish. BoC have since raised rates and there is potential for another hike to follow this year. To add to the list, the RBA crawled slightly out of the neutral zone by speaking of a neutral interest rate being as high as 3.5%. So, from a global policy standpoint is has been a busy period since the previous quarterly outlook. This seemingly combined coordination to tighten is only going to add to the BoJ's job harder regarding policy.
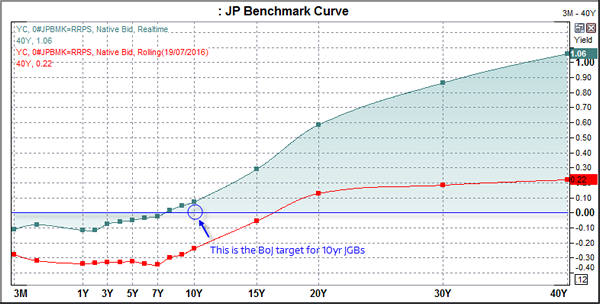
Since September '16 the BoJ have been battling markets to keep the 10yr JGB's ‘around' 0%. This has proven a tough match at times, especially when global stock markets sell off amid expectation of central bank tightening which sends yields higher. As we continue to suspect that ECB are behind the curve and will later be forced to ‘talk taper', this leaves bonds yields susceptible to further upside. In turn, this places extra pressure on the BoJ to keep their rising yields ‘around' 0% as the bond market sell-off rags the 10yrs higher.
Additionally, there have been a couple of BoJ members which have constantly doubted the expansive pace of their QQE program and remain concerned at the financial stability or long-term impact of these actions. Additionally, a recent report, or leak, suggested liquidity concerns are only growing as the BoJ continue their purchase of assets. So, the question now becomes whether the BoJ may announce a change to their policy and of so, how will it be changed?
We do not think such a change will be announced tomorrow but we will look out for subtle clues with the outlook report. There is potential for the inflation forecast to be lowered (again) although markets are likely expecting this due to the lack of inflation in general. With household spending, low wage growth and weak producer prices it is hard to justify their forecasts, let alone a 2% target. A more telling sign may be if they slightly lower their growth outlook, as it is this part which was revised higher on three occasions since 2016. Whilst potential for growth remains, there are just as many headwinds with capex and machinery tool orders printing heavy declines.
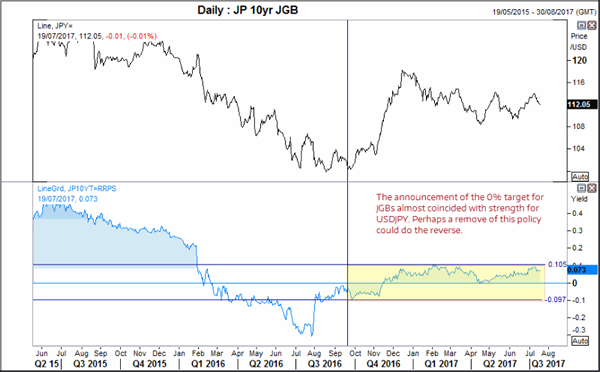
We doubt BoJ will announce an end to the 10yr target tomorrow, but it is something that will eventually make sense if yields continue to rise. We note that USDJPY printed an important lower high just days after BoJ announced their new policy with Trump's (now defunct) reflationary policies, sending it into hyperbole. Perhaps the reverse may occur if they are to throw in the towel on the 10yr target. This is something to seriously consider in the light of a hawkish Fed (weaker USD) and headwinds the BoJ face with this particular policy. We doubt it will completely reverse the moves seen since September, but it may have a decent move lower none the less.
How to Identify and Trade the Strongest Part of a Trend – Part 1
Technical indicators are often used by traders for a number of reasons, but primarily to detect the changes in the markets. Technical indicators are relied upon for signs of any change in direction, or the momentum in the price of the underlying security as well as volatility in the markets.
Among the different types of indicators and the variables that they seek to measure, identifying trends in prices are the most commonly used indicators.
While there are various trend based indicators, the moving average indicators are the most commonly used technical indicators. However, while the indicator tends to show trends clearly during trending markets, the moving average often succumbs to flat markets.
Traders using the moving averages and caught with the flat markets are often subject to whipsaws which can turn out to be extremely risky when trading.
A question that is commonly asked by traders is in knowing when the trend is the strongest to maximize the profits for the risk taken. In this article, we look at how two standard indicators can help traders to identify the strongest part of the trend.
In this two-part article, we take a detailed look at how to identify the strongest parts of the trend and also look at some ways on how to trade the trends when they are at the strongest in terms of momentum.
Identifying strong trends with the ADX and MACD
Replacing the moving average with the Average Directional Index (ADX) and the Moving average convergence and divergence (MACD) indicator offers a better alternative to catch the trends in the market, including identifying whipsaw markets.
The ADX is used as a trend detection indicator, but it has a major shortcoming. The ADX does not show the direction of the trend, but only the strength of the trend. This is overcome by making use of the MACD which can signal trends as well as sideways price action.
The chart below shows the ADX line added along with the MACD and the signal line. The default values are used.
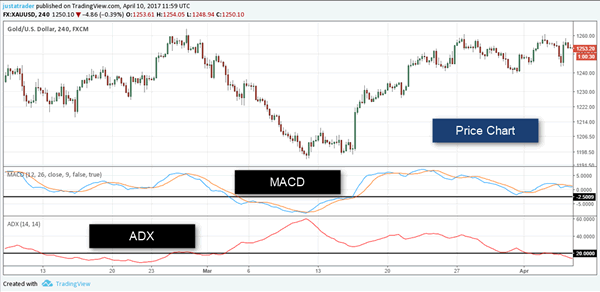
ADX and MACD applied on the price chart
Identifying the trends
The trend identification is very simple.
In an uptrend, you should see the MACD line above the signal line. It doesn't really matter if the MACD and the signal line are above or below the zero-line. Once the first criterion is met, the next rule is to look at the ADX line.
Typically, an ADX above 20 signals a moderate trend and above 30 signals a strong trend.
In a downtrend, the same rules apply. Look for the MACD line to be below the signal line while looking to the ADX to signal the trend strength.
The chart below gives a few examples.
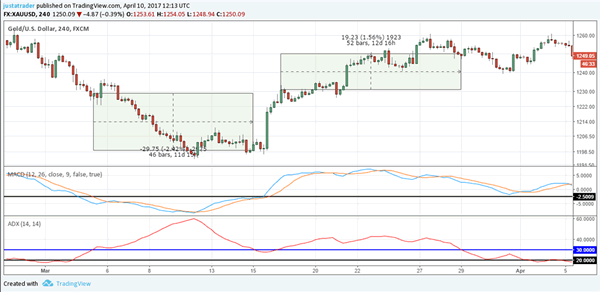
Downtrend and the uptrend examples using ADX and MACD
In the first example, you can see the downtrend that was signaled by the MACD and later confirmed as the ADX started to rise above 30. Of course, one can also start trading when the ADX rises above 20. It is a matter of personal opinion.
The short position is held until the ADX rises and then falls back to 30 or within the 20 - 30 level.
The first example positioned the trade to trade a move of $29.75 in gold.
A few sessions later, as the markets start to move sideways, the ADX also falls within the 20 - 30 level before starting to rise again, following the bullish trend signal given by the MACD oscillator.
Here, a long position is taken on the uptrend and this trade would have kept the trade running for a $19.23 move in gold.
In the second example note that we are no longer concerned by the subsequent bearish or bullish signals triggered by the MACD. Once a trade is entered, we simply exit when the ADX falls back to the 20 - 30 line.
Now that we have an understanding of how to use the ADX and the MACD, in the next part we will look at how to trade using this system.
Trade Idea : USD/JPY – Sell at 112.70
USD/JPY - 112.08
Most recent candlesticks pattern : N/A
Trend : Near term down
Tenkan-Sen level : 112.06
Kijun-Sen level : 112.03
Ichimoku cloud top : 112.73
Ichimoku cloud bottom : 112.38
New strategy :
Sell at 112.70, Target: 111.70, Stop: 113.05
Position : -
Target : -
Stop : -
Although the greenback has recovered after falling to 111.68 yesterday and minor consolidation above this level would be seen, as the selloff from 114.50 signals top has been formed there, reckon upside would be limited to the upper Kumo (now at 112.73) and bring another decline, below said support at 111.68 would extend the fall from 114.50 top to 111.50, then 111.20-25 but reckon 111.00 would hold from here due to loss of downward momentum.
In view of this, would not chase this fall here and would be prudent to sell dollar on recovery as 112.70-75 should limit upside. A firm break above resistance at 112.87 would defer and risk a stronger rebound to 113.10-20 but price should falter below resistance at 113.58, bring another selloff later.

Is Gold’s Corrective Wave Entering Its Final Stages?
Key Points:
- Despite recent bullishness, gold should reverse rather shortly.
- The ongoing ABC wave is likely to enter its final stages.
- Losses should not extend past the 1180.05 handle
Gold prices have been on the mend in recent weeks but, in doing so, they could be preparing the metal for another slide to the downside in the near-term. Indeed, the rally back to the 100 day moving average could simply be a prelude to a major tumble - the final push lower in the broader ABC pattern that we have been tracking for some time.
As shown below, despite reversing somewhat later than originally anticipated, gold has beenfairly faithful to the forecasted corrective wave and is now reaching the final reversal point in the structure. As a result, selling pressure should now be on the rise and the bears could soon be back in the driving seat for the metal. However, we don't have to rely solely on the chart pattern to reach this conclusion as numerous other technical signals also indicate that downside risks are increasing.
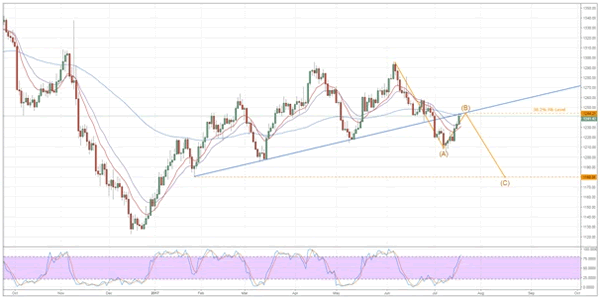
For one thing, the 12, 20, and 100 day moving averages are almost certainly goingto be having a bearish influence on the yellow metal. As shown, even after a notable uptick in buying pressure over the prior weeks, all three averages remain in the most bearish configuration possible. What's more, the 100 day measure is perfectly placed to encourage a reversal as it rests just above price action and, coincidentally, at the 38.2% Fibonacci retracement.
Further adding to our bearish bias is gold's proximity to the old trendline which could now prove to be a source of resistance, rather than support. However, the metal could also stray above this line briefly as the stochastic and RSI readings remain neutral which leaves the upside somewhat exposed to a brief surge in buying pressure - potentially from a fundamental or political upset.
Overall, keep a close eye on gold prices moving forward as the metal could still have some surprises instore. Nevertheless, for the reasons detailed above, the technical outlook is rather grim which should predispose gold prices to a reversal or at least mitigate the effects of any bullish fundamental results posted in the immediate future. In the event that we do see a reversal and subsequent downtrend, losses should be capped at around the 1180.05 handle. At this point, the bulls should stage a bit of a comeback and might even push the metal back to around the 1200.00 mark.
EUR/JPY Daily Outlook
Daily Pivots: (S1) 129.09; (P) 129.42; (R1) 129.77; More...
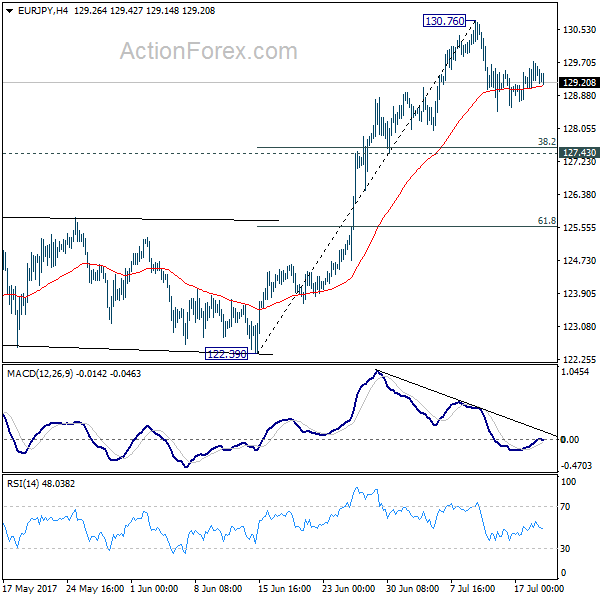
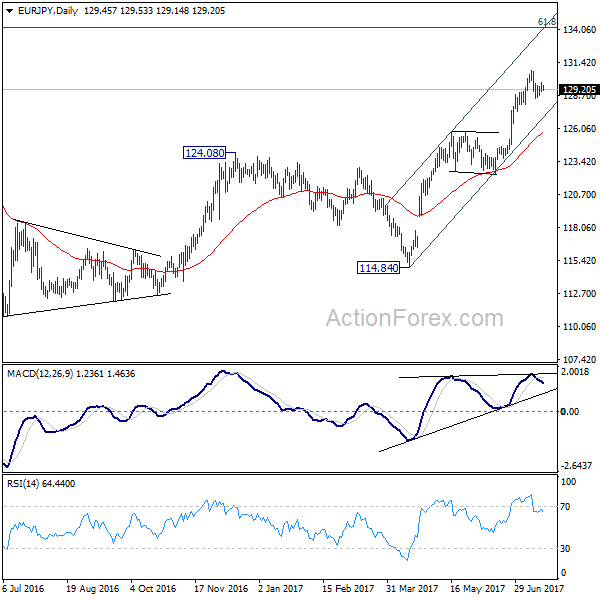
Intraday bias in EUR/JPY remains neutral as consolidation from 130.76 continues. Deeper fall might be seen. But downside should be contained by 127.43 cluster support (38.2% retracement of 122.39 to 130.76 at 127.56) and bring rebound. Above 130.76 will extend the larger rally to next key fibonacci level at 134.20.
In the bigger picture, the down trend from 149.76 (2014 high) is completed at 109.03 (2016 low). Current rally from 109.03 should be at the same degree as the fall from 149.76 to 109.03. Further rise is expected to 61.8% retracement of 149.76 to 109.03 at 134.20. Sustained break there will pave the way to key long term resistance zone at 141.04/149.76. Medium term outlook will remain bullish as long as 124.08 resistance turned support holds.