Sample Category Title
Trade Idea: AUD/USD – Buy at 0.7840
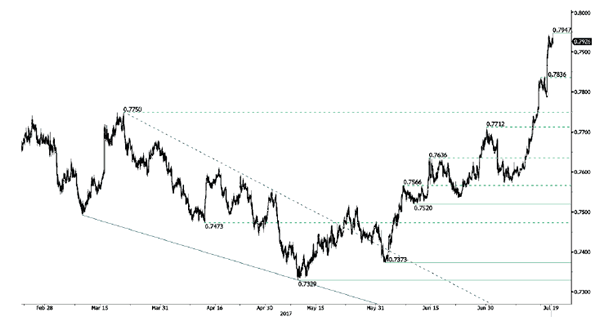
AUD/USD – 0.7926
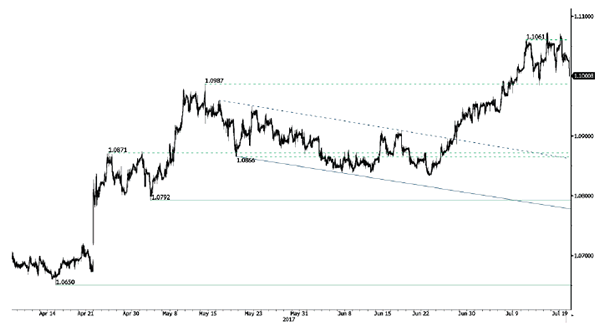
Recent wave: Wave 5 ended at 1.1081 and major correction has commenced for fall to 0.7000 and then towards 0.6500-10
Trend: Near term up
Original strategy :
Sold at 0.7650, stopped at 0.7690
Position: - Short at 0.7650
Target: -
Stop: - 0.7690
New strategy :
Buy at 0.7840, Target: 0.8000, Stop: 0.7780
Position: -
Target: -
Stop:-
Although aussie retreated earlier this month to 0.7571, renewed buying interest emerged there and the pair has rallied since, signaling recent upmove has resumed and some sort of impulsive waves (1 2, (i)(ii), i ii) is unfolding with minor wave iii is now in progress, hence further gain to 0.8000 would be seen, however, near term overbought condition should limit upside to 0.8040-50 and price should falter below 0.8100, risk from there is seen for a wave iv correction to take place later this month.
In view of this, would not chase this rise here and we are looking to buy aussie on subsequent pullback as 0.7840-50 should limit downside, bring another upmove later. Below support at 0.7786 would defer and suggest wave iii top is formed, bring correction in wave iv to 0.7750 but wave i top at 0.7712 should remain intact.
On the 4-hour chart, the move from 0.8066 is the wave 5 with i: 0.8860, ii: 0.8315, wave iii is an extended move ended at 1.0183, iv: 0.9706 and wave v has ended at 1.1081 (also the top of entire wave 5). The subsequent selloff is the major correction which is unfolding as ABC-X-ABC and 2nd A leg has ended at 0.8848, followed by a-b-c wave B which ended at 0.9758, hence, 2nd C wave is now in progress and indicated downside target at 0.7000 and 0.6950 had been met, so further fall to 0.6710-20 cannot be ruled out.

Euro Pauses After Gaining On Trump’s Healthcare Woes
The euro is marginally lower in the Wednesday session. Currently, EUR/USD is trading at 1.1520. On the release front, there are no major eruozone events on the schedule. In the US, construction data will be in the spotlight, with the release of Building Permits and Housing Starts. Both indicators are expected to improve in the June releases.
The euro continues to look sharp against the US dollar. The currency has posted monthly gains since March and is up 0.09% in July. Investors have given the euro a thumbs-up, as the euro-area economy has improved in 2017, buoyed by stronger growth and lower unemployment. On Tuesday, the euro pushed above the 1.15 line, its highest level since May 2016. The euro took advantage of increased political risk in the US, as President Trump's health care act appears to have floundered in the Senate.
The Trump administration hasn't had much success in its dealings with Congress, but this week has been particularly difficult. Trump's proposed health care bill which replaces much of Obamacare, has stalled in the Senate, before lawmakers even voted on the bill. With some conservative Republicans against the bill, it's questionable if the Republicans can craft a new proposal which could be passed before Congress takes a recess in August. Trump had promised to pass a health care before the summer break, so his credibility will take another hit if he's unable to do so. With this latest defeat, there is growing skepticism as to whether Trump will be able to convince Congress to pass other key parts of his agenda – tax reform and fiscal spending. The Republicans also have egg on their faces, as they have been unable to pass any significant legislation since Trump took over, despite having control of both houses of Congress and the White House. This paralysis on Capitol Hill has deepened investor pessimism about the Trump administration and has hurt the US dollar.
Investors are keeping a close eye on the ECB, which holds its monthly policy meeting on Thursday. The bank is not expected to announce any tapering of its asset-purchase program (QE), nor change the end date of the scheme, which is December. The cautious ECB was stunned last month when comments by ECB President Mario Draghi about tweaking QE triggered a sharp rally by the euro. If the eurozone economy continues to show strong numbers, we could see the ECB make some adjustments in its September meeting. In December 2016, the bank tapered QE while extending the scheme until December, and this type of scenario could be adopted once again. Analysts will be combing through the July statement, as well as Draghi's press conference, looking for any nuances to tweaks which could hint at substantive changes to come in September.
How to Identify and Trade the Strongest Part of a Trend – Part 2
In the previous article, we looked at how traders can ignore the moving average and instead focus on just the Average Directional Index (ADX) and the Moving Average Convergence and Divergence (MACD) indicators to determine the trend strength.
Before reading this article, it is ideal to refer to the first part of this series to gain insight and context into this trading system.
After defining the trading rules that govern the trend strength, in this part, we look at defining the trading rules and how to trade using the ADX and the MACD indicators.
Trading rules – ADX and MACD
For uptrend, long positions:
- MACD > signal line
- ADX > 20 (or 30)
- Long on closing price with stops at the nearest swing low
- Book profits regularly and trail the stops
For downtrend, short positions:
- MACD < signal line
- ADX > 20 (or 30)
- Short on closing price with stops at the nearest swing high
- Book profits regularly and trail the stops
An important distinction to be made here is that while the above rules only signal the trend and don't necessarily mean that traders should enter the trade when the conditions are met.
Once the trend is determined, traders will then have to look for price levels or pullbacks where they can enter into the trend.
In the first example below we have a long position that was taken in the uptrend. Here, after the ADX and MACD signaled the uptrend, the next step was to wait for a pullback in prices, following which a long position is set up.
The trade's take profit levels are set at 1:1 and 1:2 which occurs as the uptrend nears exhaustion.
Long position in a strong uptrend
In the next example, we have a short position which is taken based on the downtrend that was signaled by the ADX and the MACD system.
Here, we can see that the MACD signals a bearish trend with the ADX already above the 20-line. Following the initial decline and the pull back and the eventual breakout we can see that price eventually reaches target 1 and target 2.
Short position in a strong downtrend
The main benefit of using this approach to technical trading is the fact that the system signals you when the trend is the strongest. Therefore, traders can expect to see strong moves in the direction of the trend almost immediately.
Even the stop loss levels that are used are also relatively tight, and the system makes use of a 1:1 and a 1:2 take profit level which is used to limit the risks or the losses.
Trading with ADX and MACD – Pros and cons
The pros and cons of this trading system are quite straight forward. For starters, this trading system is ideal for traders who prefer to enter a trade when the markets are trending strongly. This helps to minimize the losses while also improving the probability of the trades.
On the other hand, traders will need to wait for long periods of time or will have to look for multiple currencies or instruments in order to find the right trading signals.
Traders might succumb to the temptations of entering the trade early on without both the rules being met which could lead to losses. Thus traders who do not have the patience to wait for the right conditions to be met will find that this system will be difficult to work with.
Having said that, seasoned traders will find trading with the ADX and MACD a relatively simple system to trade that also comes with simple trading rules.
EUR/GBP Important Volatility, EUR/CHF Selling Pressures Arise, BITCOIN Continued Increase.
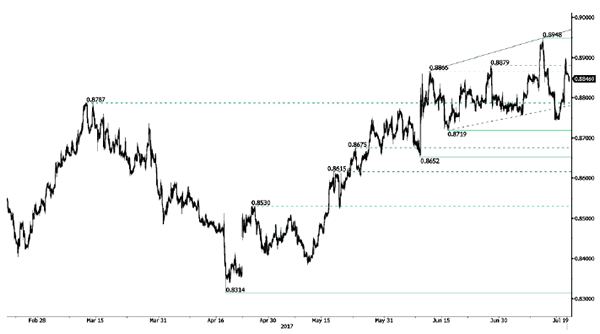
EUR/GBP Important volatility.
EUR/GBP has failed to monitor strong support at 0.8719 (16/06/2017 low).The pair is moving sideways. Yet, expected to show renewed monitoring of support given at 0.8719.
In the long-term, the pair has largely recovered from recent lows in 2015. The technical structure suggests a growing upside momentum. The pair is trading above from its 200 DMA. Strong resistance can be found at 0.9500 psychological level.
EUR/CHF Selling pressures arise.
EUR/CHF is still trading above psychological level at 1.1000. Selling pressures are very weak at the moment. Hourly support is located at a distance at 1.0922 (30/06/2017 low). Expected to inch higher.
In the longer term, the technical structure is mixed. Resistance can be found at 1.1200 (04/02/2015 high). Yet,the ECB's QE programme is likely to cause persistent selling pressures on the euro, which should weigh on EUR/CHF. Supports can be found at 1.0184 (28/01/2015 low) and 1.0082 (27/01/2015 low).
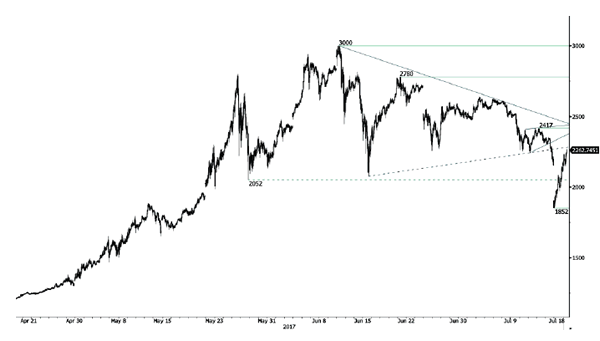
BITCOIN Continued increase.
Bitcoin has well recovered after the sell-off this weekend. Strong hourly resistance can be found at 2417 (13/07/2017 high) and hourly support is now given at 1852 (14/07/2017 low). Expected to show some sustained short-term bullish momentum.
In the long-term, the digital currency has had an exponential growth. There are decent likelihood that the asset will consolidate above $1500. Long-term support is given at $1464 (04/05/2017 low).
USD/CHF Bearish Breakout, USD/CAD Continued Selling Pressures, AUD/USD Continued Bullish Move.
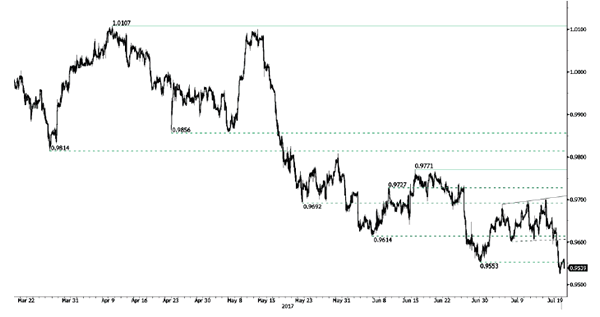
USD/CHF Bearish breakout.
USD/CHF has broken support given at 0.9553 (30/06/2017 low). Hourly resistance can be found at 0.9696 (09/06/2017 high). Strong resistance is given at 1.0107 (10/04/2017 high). Expected to to show further weakness.
In the long-term, the pair is still trading in range since 2011 despite some turmoil when the SNB unpegged the CHF. Key support can be found 0.8986 (30/01/2015 low). The technical structure favours nonetheless a long term bullish bias since the unpeg in January 2015.
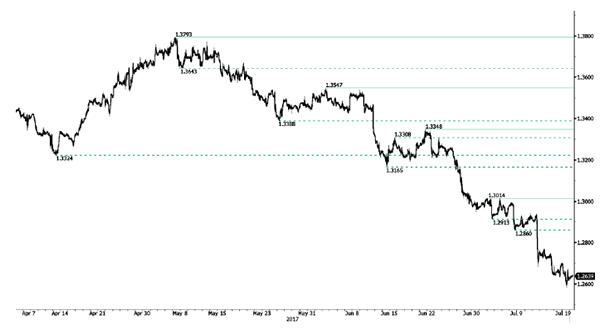
USD/CAD Continued selling pressures.
USD/CAD is going lower and the pair remains in a strong bearish momentum. Hourly support given at 1.2681 (12/07/2017 low) has been broken. Resistance is located at 1.3014 (02/15/2017). Expected to show continued bearish pressures.
In the longer term, the pair lies in a bullish channel since a year. Strong resistance is given at 1.4690 (22/01/2016 high). Long-term support can be found at 1.2461 (16/03/2015 low).
AUD/USD Continued bullish move.
AUD/USD's technical structure is bullish since early May despite some consolidation move. Hourly resistance is given at 0.7947 (19/07/2017 high). Hourly support is given at 0.7786 (18/07/2017 low).
In the long-term, we are waiting for further signs that the current downtrend is ending. Key supports stand at 0.6009 (31/10/2008 low) . A break of the key resistance at 0.8295 (15/01/2015 high) is needed to invalidate our long-term bearish view.
EUR/USD Consolidating Above 1.1500, GBP/USD Short-Term Profit-Taking, USD/JPY Continued Weakness.
EUR/USD Consolidating above 1.1500.
EUR/USD bullish pressures continue. Hourly resistance given at 1.1489 (12/07/2017 high) has been broken. Hourly support can be found at 1.1313 (05/07/2017 high). Stronger support lies at 1.1076 (18/05/2017 low). Expected to show continued bullish pressures.
In the longer term, the momentum is clearly negative. We favour a continued bearish bias towards parity. Key resistance holds at 1.1714 (24/08/2015 high) while strong support lies at 1.0341 (03/01/2017 low).
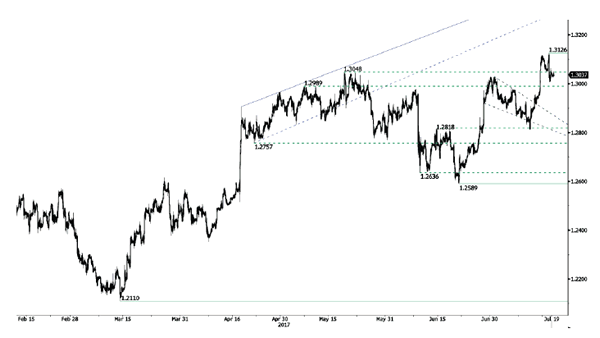
GBP/USD Short-term profit-taking.
GBP/USD still holds 1.3000 mark. Hourly resistance is now given at 1.3117 (16/07/2017 high). Support lies at 1.3047 (17/07/2017 low). Expected to show renewed bullish pressures.
The long-term technical pattern is even more negative since the Brexit vote has paved the way for further decline. Long-term support given at 1.0520 (01/03/85) represents a decent target. Long-term resistance is given at 1.5018 (24/06/2015) and would indicate a long-term reversal in the negative trend. Yet, it is very unlikely at the moment.
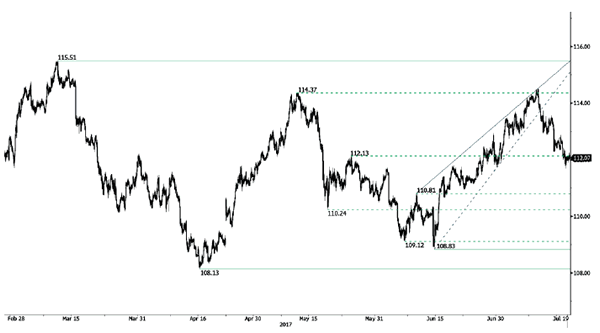
USD/JPY Continued weakness.
USD/JPY keeps on going lower. Hourly support is given at 111.99 (18/07/2017 low). Stronger support is located at a distance at 108.13 (17/04/2017 low). Expected to show continued bearish pressures.
We favor a long-term bearish bias. Support is now given at 96.57 (10/08/2013 low). A gradual rise towards the major resistance at 135.15 (01/02/2002 high) seems absolutely unlikely. Expected to decline further support at 93.79 (13/06/2013 low).
BoJ Still Far From Joining The Hawkish Chorus
During the Asian morning Thursday, the BoJ will announce its policy decision. With inflation still hovering near 0%, we doubt that the Bank will make any changes to its policy at this meeting, or send any hawkish signals like many of its foreign counterparts have done lately. Our view is enhanced by recent comments from Governor Kuroda that the Bank will maintain QQE with yield curve control until it achieves 2% inflation in a stable manner.
As for the yen, we view the risks surrounding its reaction from this meeting as being tilted to the downside. We see the case for the Bank to revise down its short-term inflation forecasts given that inflationary pressures remain subdued. Even though CPI inflation picked up a bit in recent months, both the headline and core rates still rest at +0.4% yoy, while forward-looking indicators like the Tokyo CPIs suggest inflation could slow again soon.
Looking ahead, we see the case for the yen to continue to underperform the likes of EUR, CAD and AUD. Under its current framework the BoJ is keeping yields on longer-dated JGBs fixed near 0%, while the ECB, the BoC, and the RBA have turned optimistic recently, pushing their respective yields higher.
However, we don't expect the yen to underperform the US dollar in the near-term, given US political uncertainties and subdued expectations of further near-term Fed rate hikes. Having said that though, we think that USD/JPY could rebound in coming months, conditional upon US data picking up and markets repricing another Fed hike this year.
USD/JPY traded slightly lower yesterday, but hit support near 111.80 (S1) and then it rebounded somewhat. As long as the rate continues to trade below the short-term downtrend line taken from the peak of the 11th of July, and also below the longer-term downside resistance line drawn from the high of the 11th of January, we still see a negative short-term outlook. We would expect the bears to take charge again soon, perhaps near the 112.25 (R1) resistance, and drive the battle lower for another test at 111.80 (S1). A break below that level would confirm a forthcoming lower low on the 4-hour chart and is possible to aim for our next support of 111.45 (S2).
BoE rate hike bets fade after inflation slows
The UK's CPI rates declined in June, data showed yesterday, against expectations of remaining unchanged. Even though both the headline and the core rates remain notably above the target, their decline eases some pressure on the BoE to raise rates in order to curb overshooting inflation. The result was a weaker sterling, which could remain on the back foot for a while, perhaps until tomorrow's retail sales data are released.
GBP/USD fell on the data after it hit resistance slightly above 1.3115 (R2), breaking below 1.3060 (R1) to stop near the psychological round figure of 1.3000 (S1). Then, the rate rebounded somewhat. Given that the pair is now back below the 1.3060 (R1) key barrier, we believe that further setback may be on the cards, at least until the release of the UK retail sales tomorrow. We expect sellers to take the reins again soon and aim for another test near the 1.3000 (S1) zone. A dip below that level could initially aim for the 1.2975 (S2) barrier, marked by the inside swing peaks of the 6th and 7th of July. We should note though that Cable continues to trade above the longer-term upside support line drawn from the low of the 7th of October. This keeps the broader picture cautiously positive and thus, we would treat the latest slide, or any extensions of it, as a corrective phase.
Today's highlights:
The European economic calendar is almost empty. From the US, we get building permits and housing starts, both for June. The forecast is for both figures to have risen from the previous month, which could reverse some of USD's latest losses. From Canada, we get manufacturing sales for May and expectations are for a slowdown.
USD/JPY
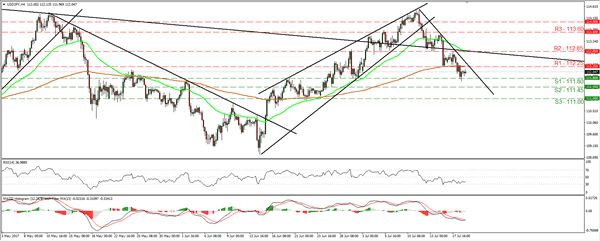
Support: 111.80 (S1), 111.45 (S2), 111.00 (S3)
Resistance: 112.25 (R1), 112.85 (R2), 113.60 (R3)
GBP/USD
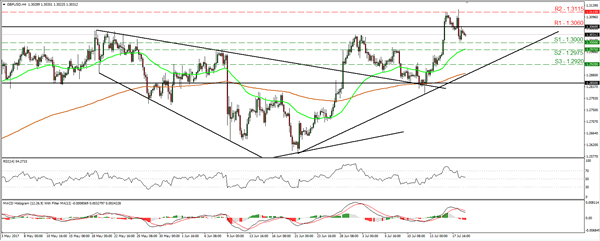
Support: 1.3000 (S1), 1.2975 (S2), 1.2920 (S3)
Resistance: 1.3060 (R1), 1.3115 (R2), 1.3180 (R3)
Elliott Wave View: SPX Showing Impulse
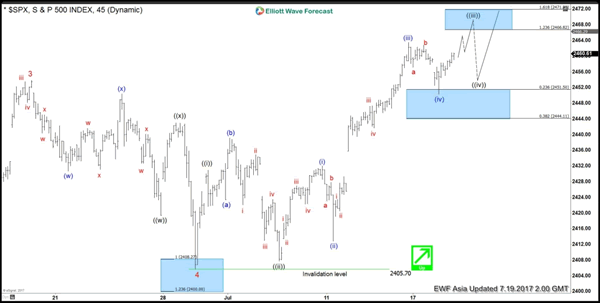
Short term SPX Elliott Wave view suggests the rally from 5/18 low (2352.7) to 6/19 peak (2453.8) ended Minor wave 3. The pullback from 2453.8 to 2405.70 on 6/29 low ended Minor wave 4. Up from there, the rally is unfolding as an impulse Elliott Wave structure with extension. This 5 waves move could be Minute wave ((a)) of an Elliott wave zigzag structure where Minute wave ((i)) ended at 2431 and Minute wave ((ii)) ended at 2407.7.
Minute wave ((iii)) is subdivided into another impulsive waves of a smaller degree. Minutte wave (i) ended at 2432, Minutte wave (ii) ended at 2412.8 and Minutte wave (iii) ended at 2463.5. Below from there Minutte wave (iv) ended at 2450.34 and above from there Minutte wave v of ((iii) is in progress towards 2466.82-2471.8 area. Afterwards, the Index should pullback in Minute wave ((iv)) before further upside, provided that pivot at 2405.70 low remains intact.
In case of further extension in Minutte wave (v) of ((iii)), the index could extend to (v)=(i) target area at 2474.7-2480.4 before a turn in Minute wave ((iv)) happens. If the pullback turns out to be rather strong then the Index could already end the cycle from 6/29 low (2405.7) as an Elliottwave Flat structure, and it should then correct the cycle from 6/29 low before the rally resumes. We don’t like selling the Index and favors more upside as far as pivot at 2405.70 low remains intact.
SPX 1 Hour Elliott Wave Chart
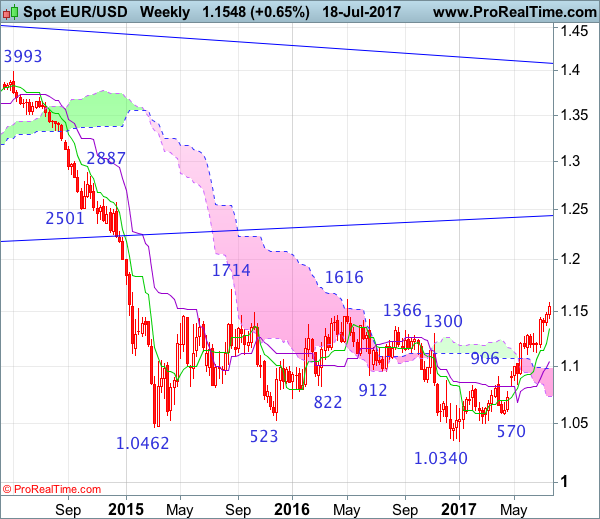
EUR/USD Candlesticks and Ichimoku Analysis
Weekly
• Last Candlesticks pattern: Shooting star
• Time of formation: 03 May 2016
• Trend bias: Down
Daily
• Last Candlesticks pattern: Shooting star
• Time of formation: 3 May 2016
• Trend bias: Sideways
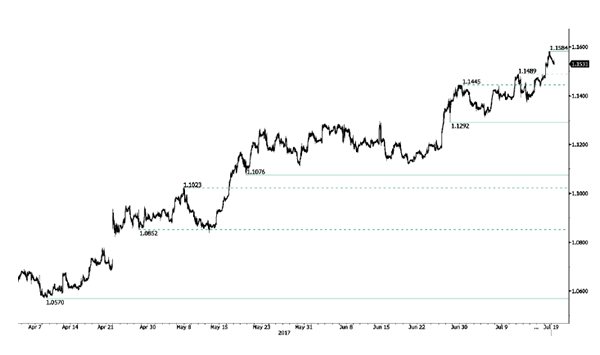
EUR/USD – 1.1384
The single currency has continued moving higher after brief pullback, adding credence to our bullish view that recent upmove is still in progress and price already exceeded indicated upside targets at 1.1480-85 (50% projection of 1.0570-1.1296 measuring from 1.1119) and 1.1565-70 (61.8% projection), upside bias remains for a test of previous chart resistance at 1.1616, break there would encourage for headway to 1.1660 and possibly towards another previous resistance at 1.1714 which is likely to hold on first testing due to near term overbought condition.
On the downside, whilst initial pullback to 1.1490-00 is likely, reckon downside would be limited to the Tenkan-Sen (now at 1.1477) and bring another rise later to aforesaid upside targets. Below support at 1.1435 would defer and risk correction towards the Kijun-Sen (now at 1.1386) but only a daily close below support at 1.1370 is needed to suggest a temporary top is possibly formed, bring further fall to 1.1312 support but previous resistance at 1.1296 should remain intact.
Recommendation: Buy at 1.1450 for 1.1650 with stop below 1.1350.
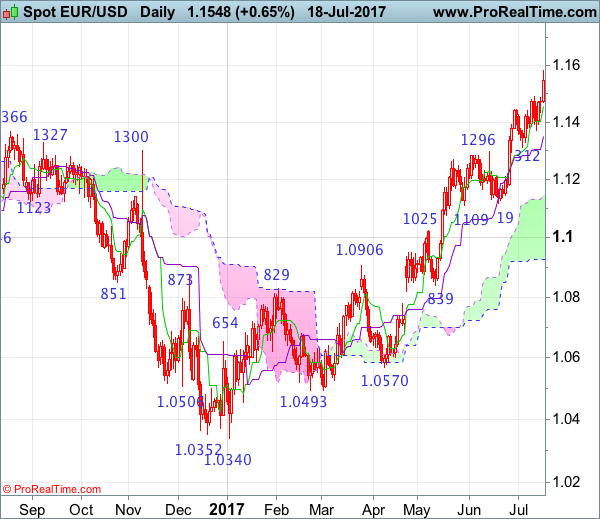
On the weekly chart, as the single currency has maintained a firm undertone, reinforcing our bullish view that recent upmove from 1.0340 low is still in progress and bullishness remains for this move to extend further gain to previous chart resistance at 1.1616, then 1.1660, however, near term overbought condition would prevent sharp move beyond previous chart resistance at 1.1714 and price should falter below 1.1800-10, risk from there is seen for a retreat later.
On the downside, expect pullback to be limited to 1.1450 and support at 1.1435 should hold, bring another upmove later. A drop below support at 1.1370 would defer and suggest top is possibly formed instead, risk correction to 1.1312 support but break there is needed to add credence to this view, bring retracement of recent upmove to 1.1250, then towards 1.1200 but price should stay well above support at 1.1109-19, bring another upmove later.
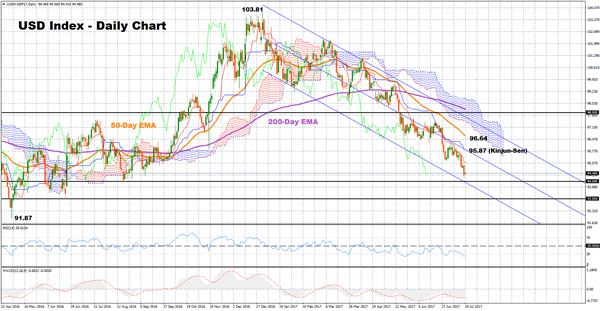
Dollar Index Trades Within Descending Channel, Bearish And Oversold
The dollar index has stretched below the 95.00 key-level, extending its downleg that started on January 3, when it touched a multi-year high of 103.81.
Looking at the technical indicators, the index is likely to remain bearish but there is a possibility of an upside reversal in the near-term horizon. The RSI has been hovering in bearish territory since March 14 and attempted to break above 50 three times since then but struggled to hold above it. Currently, the indicator is showing that the index is oversold as it has recently dropped below 30, hinting that a trend reversal might take place. Additional evidence of the negative bias comes from the MACD, which continues trending below zero.
Should the index head down, a support to downside movements is expected to be first found around the psychological level of 94.00, where the lower line of the descending channel is also located. Then, if the price drops below that area, the next support could be provided by 93.00, which was also tested in the past. Note that if the price manages to fall below 91.87, this could signal the start of a longer-term downtrend.
On the upside, the zone around the Kinjun-sen point of 95.87 would act as a strong resistance as the middle-line of the channel is also passing through that area. Any increases from that point would bring into view the 96.64 level, which lies on the 50-day exponential moving average line (EMA), followed by the key level of 98.00. The latter is notable as it is settled inside the Ichimoku cloud and near the upper line of the channel.
Concerning the outlook in the medium-term, the index is bearish as it has been recording lower tops and lower bottoms since January, confirmed by the recent bearish crossover between the 50-day EMA and 200-day EMA.