Sample Category Title
GBP/JPY Daily Outlook
Daily Pivots: (S1) 145.23; (P) 146.27; (R1) 147.16; More
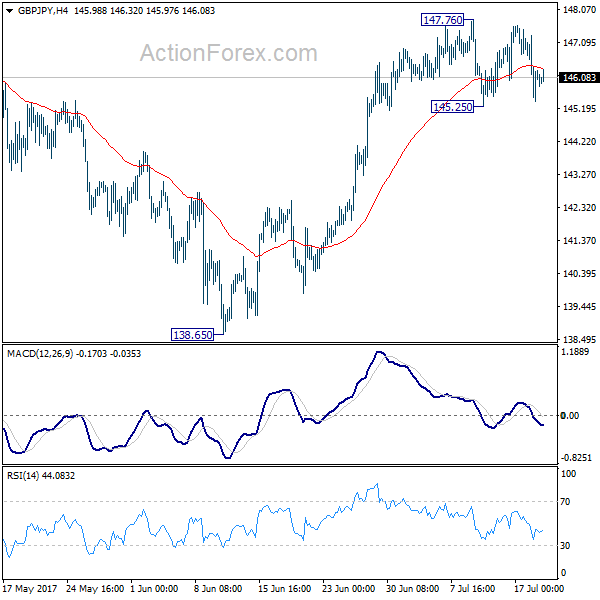
GBP/JPY is staying in range of 145.5/147.76 and intraday bias remains neutral first. On the upside break of 147.76 will resume rise from 138.65. And firm break of 148.42 key resistance will also resume the whole rally from 122.36 to long term fibonacci level at 150.43 and above. Meanwhile, on the downside, break of 145.25 will revive the case of rejection from 148.09/42 resistance zone. Intraday bias would then be turned back to the downside for 55 day EMA (now at 143.88) and below.
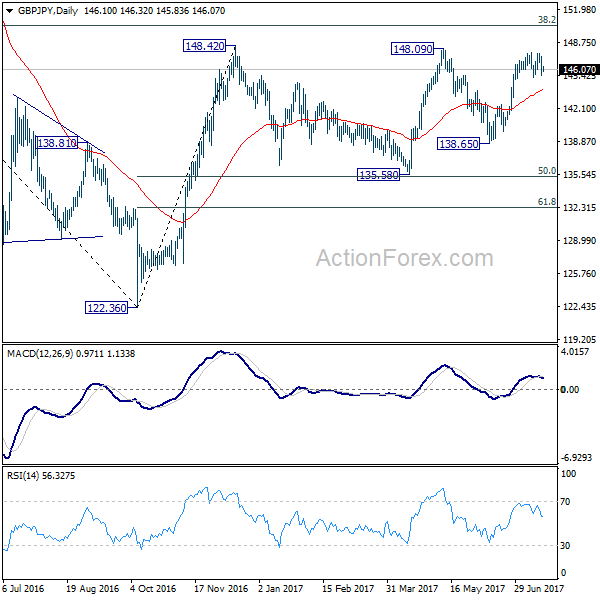
In the bigger picture, rise from medium term bottom at 122.36 is expected to continue to 38.2% retracement of 196.85 to 122.36 at 150.43. Decisive break there will carry long term bullish implications and pave the way to 61.8% retracement at 167.78. In case the sideway pattern from 148.42 extends, we'd be looking for strong support from 135.58 and 50% retracement of 122.36 to 148.42 at 135.39 to contain downside.
EUR/GBP Daily Outlook
Daily Pivots: (S1) 0.8794; (P) 0.8846; (R1) 0.8911; More
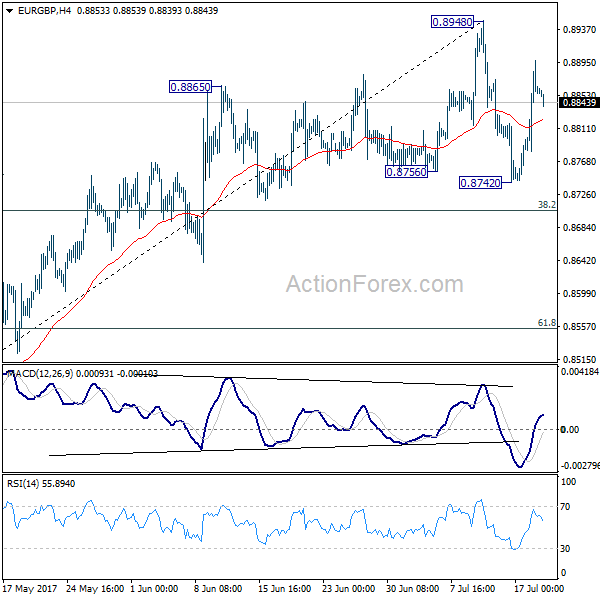
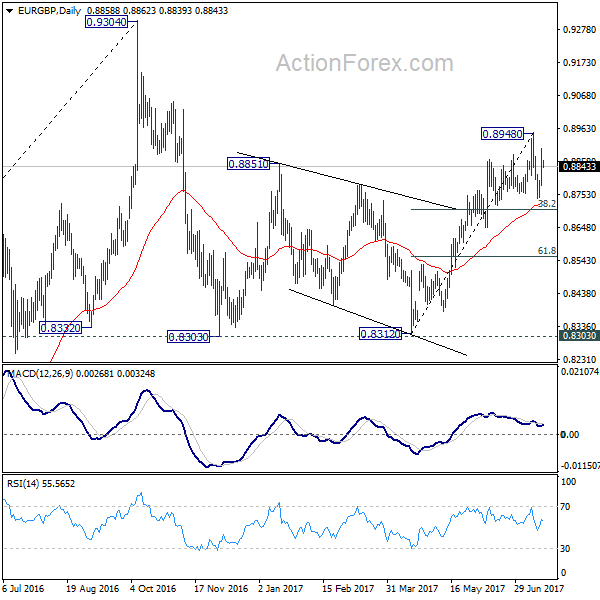
Intraday bias in EUR/GBP remains neutral for the moment as it's staying in range of 0.8742/8948. On the downside, below 0.8742 will target 38.2% retracement of 0.8312 to 0.8948 at 0.8705 first. Break will target 61.8% retracement at 0.8555 next. However, break of 0.8948 will extend the rebound from 0.8312 towards 0.9304 resistance.
In the bigger picture, price actions from 0.9304 are viewed as a medium term corrective pattern. It's uncertain whether it is finished yet. But in case of another fall, we'd expect strong support from 0.8116 cluster support (50% retracement of 0.6935 to 0.9304 at 0.8120) to contain downside and bring rebound. Whole up trend from 0.6935 is expected to resume after consolidation from 0.9304 completes.
EUR/AUD Daily Outlook
Daily Pivots: (S1) 1.4492; (P) 1.4634; (R1) 1.4734; More...
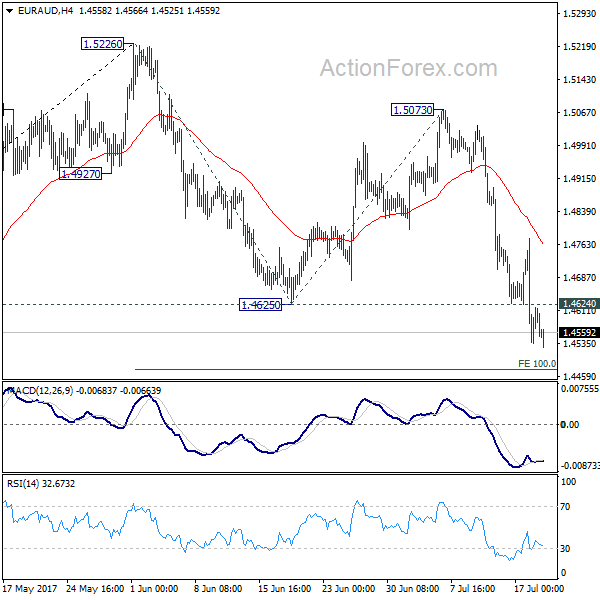
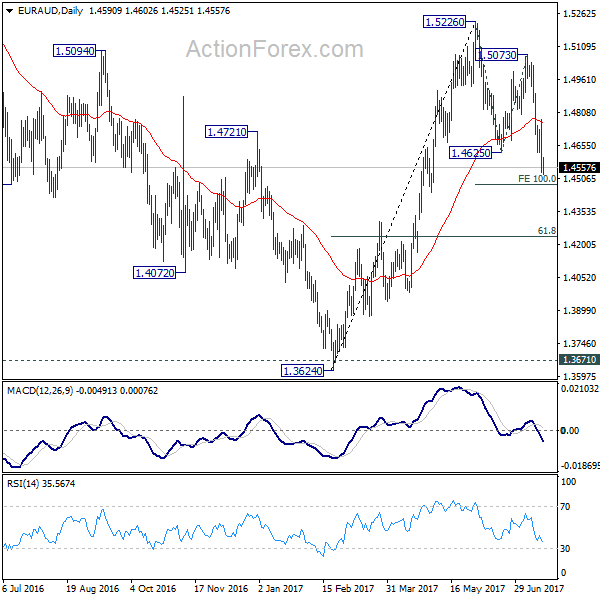
Intraday bias in EUR/AUD remains on the downside as current fall from 1.5226 is targeting 100% projection of 1.5226 to 1.4625 from 1.4472 next. Firm break there would pave the way to larger fibonacci level at 61.8% retracement of 1.3624 to 1.5226 at 1.4236. On the upside, above 1.4624 minor resistance will turn intraday bias neutral first.
In the bigger picture, we're holding on to the view that corrective decline from 1.6587 medium term has completed at 1.3624. But we will monitor the structure of the decline from 1.5226 to adjust our view. Above 1.5226 will target a test on 1.6587 key resistance. However, further downside acceleration will dampen our view and would drag EUR/AUD lower to retest key support zone around 1.3624.
EUR/CHF Daily Outlook
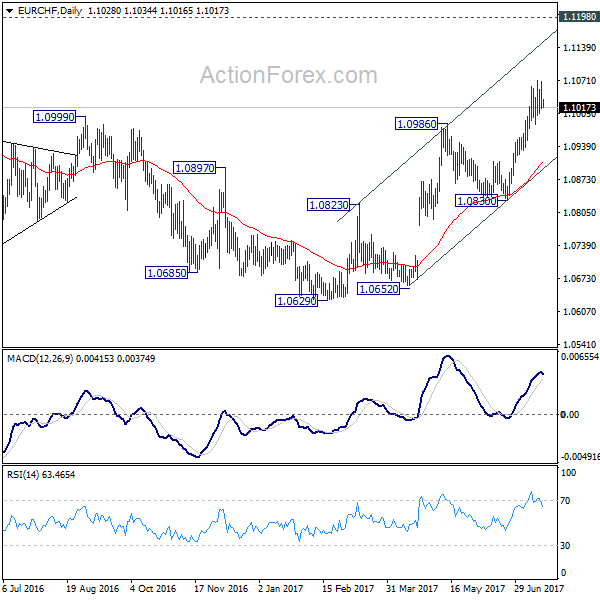
Daily Pivots: (S1) 1.1010; (P) 1.1040; (R1) 1.1063; More...
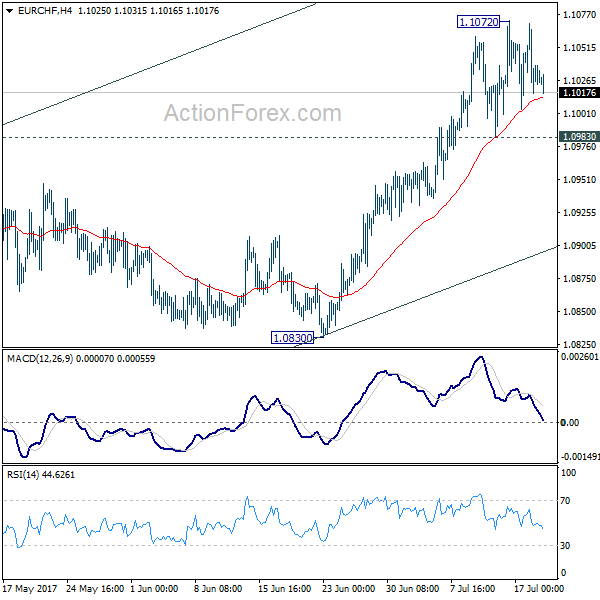
EUR/CHF lost momentum after hitting 1.1072 and intraday bias is turned neutral first. As long as 1.0983 support holds, further rally is expected in the cross. Current rise from 1.0629 should target 1.1127/98 resistance zone. However, break of 1.0983 will indicate short term topping and turn bias back to the downside for 55 day EMA (now at 1.0906).
In the bigger picture, the price actions from 1.1198 are seen as a corrective move. Such correction could have completed after defending 38.2% retracement of 0.9771 to 1.1198 at 1.0653. Decisive break of 1.1198 will resume the long term rise from SNB spike low back in 2015. In such case, EUR/CHF could eventually head back to prior SNB imposed floor at 1.2000. However, rejection from 1.1198 will extend the multi-year range trading with another fall.
Is Silver About To Complete The Triangle?
Key Points:
- Silver continues to see supply/demand deficits in 2016.
- RSI Oscillator trending higher within neutral territory.
- Near completion of 5-drive suggests we could see a bullish wave.
Silver has been going through a cycle of declines of late as the precious metal has reacted to price action becoming trapped below a declining trend line and changing economics in the demand and production for Silver. However, presently there are some interesting technical indicators appearing on the daily chart which are likely to impact prices in the coming week.
Fundamentally, economists have been squawking lately about the slipping demand for silver in the photographic trade. They are right to point out that in the space of a decade demand has fallen by over 65% as we have transitioned almost totally to digital cameras. However, to put that in context balancing supply and demand numbers still shows that there was a deficit of -20.7 million ounces in 2016 and that's with massively increased production. Subsequently, silver has experienced a supply deficit for every year since 2007, despite the fall in photographic demand.
Although the fundamental factors are long term in nature, the rising supply deficit largely agrees with what has been seen in the physical metals market with rising prices for actual silver coins and bars. Subsequently, it is no surprise that some bullish technical factors are now also starting to creep into the daily charts.
A cursory review of the various technical factors provides some illuminating hints at where the metal could be heading next. In particular, price action's recent rebound from support around the $15.50 mark seems to suggest that there is building momentum for an upside move in the coming weeks. In addition, a relatively clear 5-wave structure is in place and moving higher to completion, which is normally followed by another bullish cycle. Also, the recent spike in prices has seen the RSI Oscillator trend away from oversold territory, and into the neutral zone, suggesting that there could be some space to run on the upside.
However, to cement a concerted move higher, price action will need to rally through the top of the descending trend line. Taking an Elliot wave view of the recent movements, a break above this level would provide a sharp indication of price movement. At the time of writing, the upper constraint is sitting right on the $17.50/ounce mark and a break above this level is relatively conceivable in the coming weeks given a range of factors.
Ultimately, Silver is going to re-price in the coming weeks especially if it can break through the current descending trend line. A fairly likely scenario would be one where price action trends towards $17.50 in a wave pattern. However, as to how far the metal can push above that level will rely strongly on the medium sentiment, which as I'm sure everyone appreciates, is difficult to predict in the medium term.
Daily Technical Analysis: EUR/USD, GBP/USD Bearish Pullback To 1.15 And 1.30 Within Bullish Trend
Currency pair EUR/USD
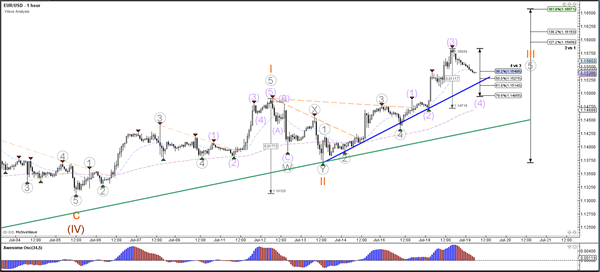
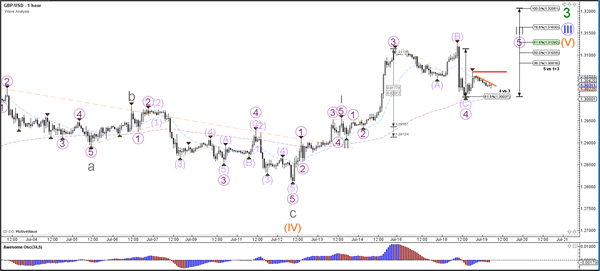
After the break above the 1.15 round level resistance, the EUR/USD continues the established bullish trend with yet another higher high. The uptrend shows no signs of weakening as yet and price is on its way towards the Fibonacci targets of wave 3 vs 1. Currently a retracement is taking place, which can be better seen on the 1 hour chart.
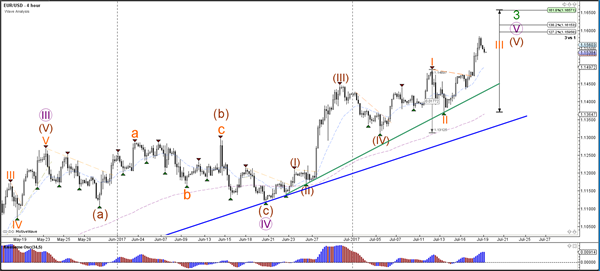
The EUR/USD has completed a wave 3 (purple) bullish momentum and price is most likely building a bearish correction within the uptrend. This retracement is indicated as a wave 4 (purple) and the Fibonacci levels of wave 4 vs 3 could act as support levels. A break below 1.15 makes a wave 4 unlikely.
Currency pair USD/JPY
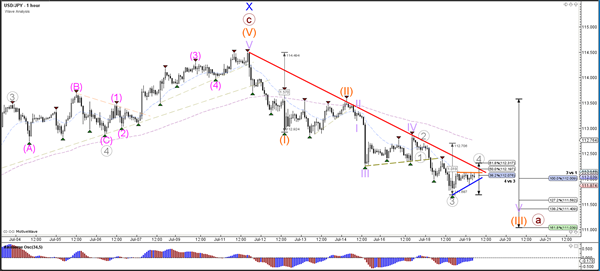
The USD/JPY bearish momentum continues with another lower low. Price could either be building an ABC zigzag or a 123 wave pattern (orange). For the moment the wave 3 has an edge but price will need to stay below resistance (red) and reach the 161.8% Fib target of wave 3 vs 1.
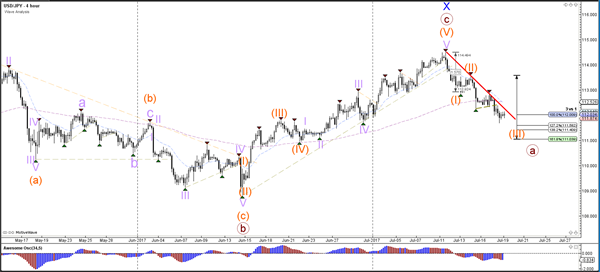
The USD/JPY could be building another wave 4 retracement (grey) within the downtrend. A break below support (blue) could indicate the continuation of the downtrend whereas a break above the resistance trend line (red) and 61.8% of wave 4 vs 3 invalidates the wave 4.
Currency pair GBP/USD
The GBP/USD broke above the 1.30 resistance but the weaker inflation level, which was announced yesterday, caused the GBP to retrace back from 1.31 to 1.30 The broken resistance could now become a potential support level within the larger uptrend.
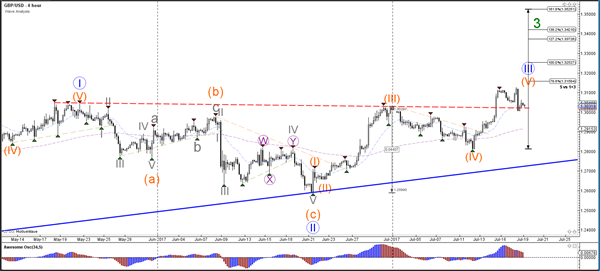
The GBP/USD seems to have completed an ABC (purple) correction within wave 4 (purple) and price has bounced at the 61.8% Fibonacci level. A break above resistance (red/orange) could start the uptrend continuation within wave 5 (purple).
Daily Technical Outlook And Review: EUR/USD, GBP/USD, AUD/USD, USD/JPY, USD/CAD, USD/CHF, DOW 30, GOLD
A note on lower timeframe confirming price action...
Waiting for lower timeframe confirmation is our main tool to confirm strength within higher timeframe zones, and has really been the key to our trading success. It takes a little time to understand the subtle nuances, however, as each trade is never the same, but once you master the rhythm so to speak, you will be saved from countless unnecessary losing trades. The following is a list of what we look for:
- A break/retest of supply or demand dependent on which way you're trading.
- A trendline break/retest.
- Buying/selling tails ... essentially we look for a cluster of very obvious spikes off of lower timeframe support and resistance levels within the higher timeframe zone.
- Candlestick patterns. We tend to only stick with pin bars and engulfing bars as these have proven to be the most effective.
We typically search for lower-timeframe confirmation between the M15 and H1 timeframes, since most of our higher-timeframe areas begin with the H4. Stops are usually placed 1-3 pips beyond confirming structures.
EUR/USD
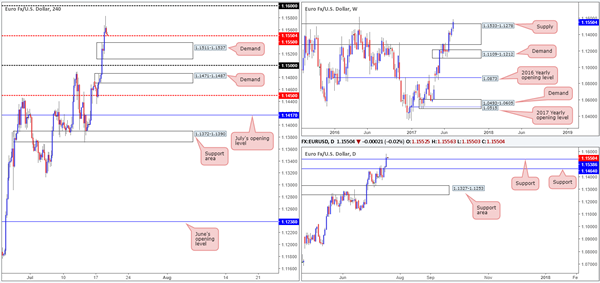
Across the board, we saw the US dollar trade lower yesterday, consequently forcing the EUR to a fresh high of 1.1583. The major weekly supply drawn from 1.1533-1.1278 is, as you can see, now under serious pressure. In the event that this area is finally consumed, we see absolutely no resistance on the weekly scale until the 1.20ish neighborhood! Down on the daily timeframe, yesterday's run north ended with a close being formed above resistance at 1.1538. Providing that this line holds firm as support, the next upside target from here is a supply coming in at 1.1870-1.1786 (not seen on the screen).
Our suggestions: Across on the H4 chart, price is seen retesting the mid-level support at 1.1550. Assuming that this barrier holds, this could mean that we may be looking at a move up to the 1.16 handle sometime today. A break below 1.1550 on the other hand, will see the H4 candles almost immediately come into contact with the daily support at 1.1538, which happens to be positioned just a pip ahead of a H4 demand at 1.1511-1.1537.
Admittedly, we are tempted to begin looking for longs in this market, but at the same time remain slightly hesitant since we've seen weekly action peek above the aforesaid weekly supply before and then aggressively reverse back to the downside.
With that in mind, we've decided to remain on the sidelines going into today's segment and will look to reassess structure tomorrow.
Data points to consider: US Housing data at 1.30pm GMT+1.
Levels to watch/live orders:
- Buys: Flat (stop loss: N/A).
- Sells: Flat (stop loss: N/A).
GBP/USD
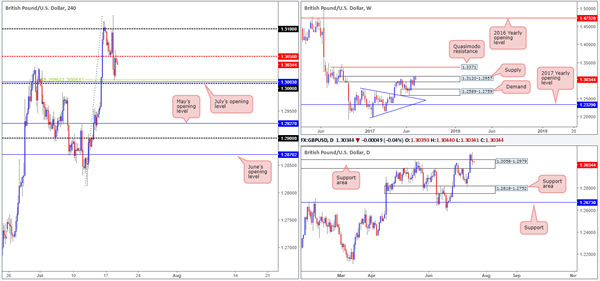
The pound took a bit of a hit to the mid-section on Tuesday after UK inflation numbers came in slightly lower than expected. The H4 mid-level barrier at 1.3050 was taken out as a result of this, leaving H4 price free to challenge the 38.2% Fib support at 1.3006 (drawn from the swing low at 1.2811), positioned just a few pips above the large psychological level 1.30 and July's opening level at 1.3003.
While we can see that the bounce from 1.3006 brought prices back up to 1.3050, the bulls are seen struggling to muster enough strength to breach this level right now. According to the weekly timeframe, this market could see further selling due to the unit being sited deep within the walls of a supply at 1.3120-1.2957. The story on the daily chart on the other hand, places the candles within a support area set at 1.3058-1.2979.
Our suggestions: With 1.3050 currently holding strong, it is very likely that the 1.30 neighborhood will be challenged soon. We absolutely love the H4 confluence set around this number (see above), and also the fact that it is located within the aforesaid daily support area. Nevertheless, it would be unwise of us to dismiss where weekly price is trading from (supply) at the moment! Despite this, we still feel that a bounce is expected to be seen from here.
To be on the safe side though, our team will not commit UNTIL we have pinned down additional confirmation from the lower-timeframe candles (see the top of this report), as our first take-profit target is likely to be the nearby 1.3050 base. Ideally, you'll want your stop to be no more than 20 pips as this will provide one with at least 2R to the first take-profit line.
Data points to consider: US Housing data at 1.30pm GMT+1.
Levels to watch/live orders:
- Buys: 1.30 region ([waiting for lower-timeframe confirmation to form is advised] stop loss: dependent on where one confirms this level).
- Sells: Flat (stop loss: N/A).
AUD/USD
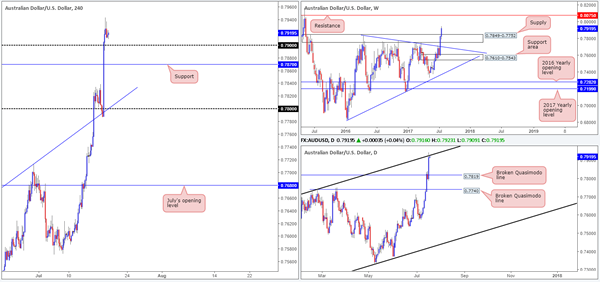
Following a bullish RBA minutes, the commodity currency aggressively bounced from the 0.78 region, which fused beautifully with a H4 trendline support etched from the high 0.7635. Prices advanced over 100 pips from here, eventually putting in a high of 0.7942 and closing the day beyond the 0.79 handle. This has, as far as we can see, cleared the path north for further buying up to the large 0.80 handle. What this recent move also accomplished was a clean break through weekly supply at 0.7849-0.7752. A continuation move from here could see the Aussie shake hands with a strong weekly resistance base at 0.8075.
Although we have weekly and H4 action echoing bullish tones right now, it might be worth noting that daily price is seen crossing swords with a channel resistance pegged from a high of 0.7732. Should this line hold steady, the next area of support can be seen at 0.7819: a recently broken Quasimodo line.
Our suggestions: While a great deal of traders will be eyeing the 0.79 handle for longs today, daily sellers could force price beyond this number and challenge the H4 support at 0.7870. As of this moment, we're not satisfied with current structure, and feel trading it would be too much of a risk. Therefore, our plan of action is too wait for today's segment to play out and then reassess structure going into tomorrow's opening.
Data points to consider: US Housing data at 1.30pm GMT+1.
Levels to watch/live orders:
- Buys: Flat (stop loss: N/A).
- Sells: Flat (stop loss: N/A).
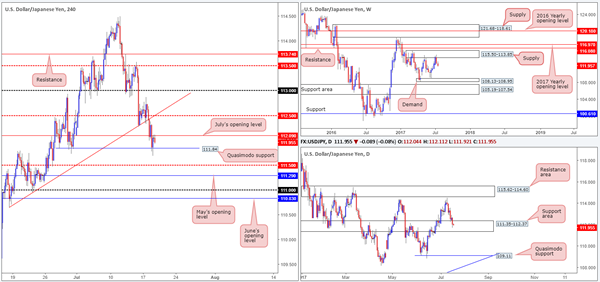
USD/JPY
Since weekly price came into contact with supply at 115.50-113.85, the market has been trading with a strong bearish sentiment. Also of particular interest is that this timeframe shows room for price to climb down as far as weekly demand drawn from 108.13-108.95. Turning our attention to the daily candles, nevertheless, the unit is currently seen hovering inside a support area coming in at 111.35-112.37. So far though, there has been very little bullish intent registered from here.
Things over on the H4 timeframe look somewhat cramped at the moment. The Quasimodo support at 111.84 managed to hold price action higher as we entered yesterday's US segment, but has failed to generate much follow through beyond July's opening level at 112.09.
Our suggestions: Ultimately, our bias is positioned to the downside for the time being, largely due to the fact that we're trading from weekly supply. However, selling is somewhat difficult on the H4 timeframe, given that beyond 111.84, we have a nearby mid-level support at 111.50, followed closely by May's opening level at 111.29 and then the 111 handle! Not exactly ideal selling conditions!
With the above in mind, we'll remain flat and wait for further developments to be seen.
Data points to consider: US Housing data at 1.30pm GMT+1.
Levels to watch/live orders:
- Buys: Flat (stop loss: N/A).
- Sells: Flat (stop loss: N/A).
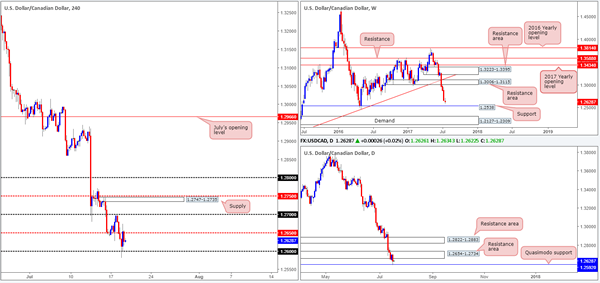
USD/CAD
For those who read Tuesday's report on the USD/CAD pair you may recall that our desk entered into a short position after the close of the near-full-bodied bearish candle from 1.27. The trade worked out exactly as planned, with us taking full profit around the 1.26 neighborhood. Well done to any of our readers who managed to jump aboard this move!
As you can see on the weekly timeframe, we are now coming incredibly close to connecting with the support level pegged at 1.2538. On the daily timeframe, nonetheless, we are seeing price trading from a Quasimodo support at 1.2592, after price ran through demand at 1.2654-1.2734 (now acting resistance area). Should the current support give way, there's another Quasimodo support seen waiting below at 1.2498.
Our suggestions: As of current price, we do not see much opportunity to trade. Trading long from the current daily Quasimodo support is chancy given the strength of the downtrend and, of course, the nearby daily resistance area lurking just above it. Selling on the other hand would be something we'd be interested in following a decisive H4 close below the 1.26 boundary, as the next target beyond here is the weekly support mentioned above at 1.2538.
Data points to consider: US Housing data and Canadian Manufacturing sales at 1.30pm. Crude oil inventories at 3.30pm GMT+1.
Levels to watch/live orders:
- Buys: Flat (Stop loss: N/A).
- Sells: Watch for H4 price to engulf the 1.26 handle and then look to trade any retest seen thereafter ([waiting for a H4 bear candle – preferably a full, or near full-bodied candle – to form following the retest is advised] stop loss: ideally beyond the candle's wick).
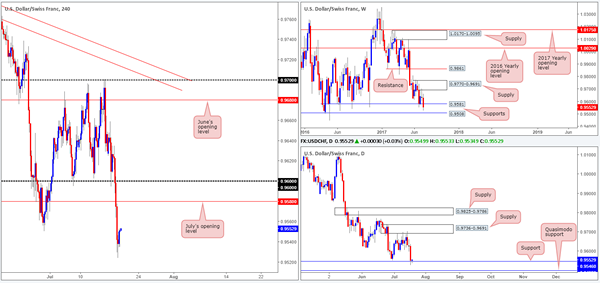
USD/CHF
In recent trading the USD/CHF fell sharply, consequently taking out the 0.96 handle and July's opening level at 0.9580. The unit bottomed after clocking a low of 0.9523 and has since been registering bullish candles. Helping price along its way, nevertheless, is a daily support currently in play coming in at 0.9546. While this is holding the market higher at the moment, our desk is not convinced. The reason? Well, weekly support at 0.9581 was recently consumed and shows space for price to move down to the next weekly support line coming in at 0.9508. Now, 0.9508 converges not only with the 0.95 handle on the H4 chart, but is also seen positioned nearby a daily Quasimodo support level at 0.9498 (the next downside target below the current daily support). For that reason, we are more drawn to the 0.95 handle for longs today.
Our suggestions: Given what we've noted above, our team has placed a pending buy order at 0.95, with a stop positioned below the daily Quasimodo apex (0.9443) at 0.9440. Yes, this is a rather large stop, but considering we are dealing with weekly and daily structures here, the risk is acceptable, in our humble opinion.
Data points to consider: US Housing data at 1.30pm GMT+1.
Levels to watch/live orders:
- Buys: 0.95 ([pending order] stop loss: 0.9440).
- Sells: Flat (Stop loss: N/A).
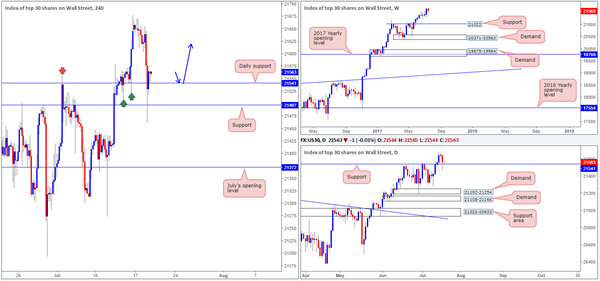
DOW 30
US stocks slipped lower on Tuesday, which saw the H4 candles aggressively surpass daily support at 21541 and test H4 support at 21497. As you can see, the day ended with price closing back above the daily support level, so there's a good chance that we may see the index rally from this point today.
What would be ideal is for H4 price to retest the daily support and hold firm. This, to us, would add credibility to this level and therefore open up the possibility of buying from here.
Our suggestions: Based on the above findings, a H4 retest of 21541 – coupled with a reasonably sized H4 bull candle, preferably a full, or near-full-bodied candle, would be enough evidence for us to confirm a long position as valid. In regard to take-profit targets, at this point we are quite open as we have yet to see what structure forms on approach to this number. Overall though, we do want to try and trail this market in an attempt to join the current uptrend.
Data points to consider: US Housing data at 1.30pm GMT+1.
Levels to watch/live orders:
- Buys: 21541 ([waiting for a H4 bull candle – preferably a full, or near full-bodied candle – to form is advised] stop loss: ideally beyond the candle's tail).
- Sells: Flat (stop loss: N/A).
GOLD
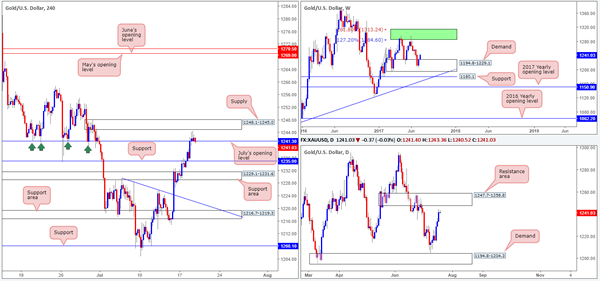
The dollar continued to plunge on Tuesday, consequently adding to gold's advance. Behind this recent up move is the weekly candles seen trading from weekly demand plotted at 1194.8-1229.1. While this may be encouraging for potential buyers, it might be worth noting that daily price is trading within touching distance of a resistance area coming in at 1247.7-1258.8.
Across on the H4 candles, we can also see that yesterday's flow managed to remove offers from July's opening level at 1241.3, and is now seen retesting this level as support. Buying from here, however, is difficult. Just ahead of the monthly level sits a H4 supply registered at 1248.1-1245.0, which happens to be glued to the underside of the aforementioned daily resistance area!
Our suggestions: In spite of weekly price showing promise to the upside, we cannot validate buying this market when so much structure is seen lurking above current price on the H4 and daily timeframes. With that being the case, we so no alternative but to hit the sidelines for now and return tomorrow where hopefully some development has been seen.
Levels to watch/live orders:
- Buys: Flat (stop loss: N/A).
- Sells: Flat (stop loss: N/A).
European Open Briefing: The Australian Dollar Remains Strong
Global Markets:
- Asian stock markets: Nikkei up 0.05 %, Shanghai Composite gained 0.80 %, Hang Seng rose 0.45 %, ASX 200 rallied 0.75 %
- Commodities: Gold at $1240 (-0.10 %), Silver at $16.22 (-0.25 %), WTI Oil at $46.35 (-0.10 %), Brent Oil at $48.80 (-0.10 %)
- Rates: US 10-year yield at 2.28, UK 10-year yield at 1.22, German 10-year yield at 0.56
News & Data:
- Japan Tankan Index 26.0 vs 26.0 previous
- Australia MI Leading Index -0.1 % vs 0.0 % previous
- PBoC Sets Yuan Mid-Point At 6.7451
- Dollar's decline, China optimism cheer Asia stocks, commodities – RTRS
Markets Update:
Overnight, the Euro retraced some of its gains from yesterday, although it remains bid overall. Support is seen at 1.15, followed by 1.1480 and stronger support at 1.1430. The EUR/USD is likely to consolidate ahead of tomorrow´s ECB meeting, where President Draghi might signal that QE will end soon.
GBP/USD traded 1.3020-40 overnight. The Pound came under pressure after yesterday's UK inflation data, but the broad USD weakness is keeping the pair above 1.30. Should 1.30 support break, a retracement towards 1.2920 is likely.
USD/JPY is consolidating around 112. The Bank of Japan will announce its rate decision tomorrow. No changes are expected, and the central bank is very likely to maintain its QE programme for a while. This should keep USD/JPY at least above 110.
The Australian Dollar remains strong. Solid Chinese economic data, rising commodity prices and a slightly hawkish RBA continue to support the currency, and AUD/USD is likely to test 0.80 soon.
Upcoming Events:
- 13:30 BST – US Building Permits
- 13:30 BST – US Housing Starts
- 15:30 BST – US Crude Oil Inventories
Market Update – Asian Session: Markets Quiet Ahead Of BOJ Tomorrow
Asia Summary
Asia markets are mixed, but mostly to the upside; with a quiet day of trade with little economic catalysts ahead of Bank of Japan (BOJ) policy decision tomorrow. BOJ is expected to cut inflation forecast and raise GDP forecast. Australia APRA announced stronger capital requirements by 2020, though all of the major banks assured the markets they would easily meet the requirements. Their shares rose, giving the ASX a boost. BHP released its production results, which failed to impress, much like Rio yesterday. This put some pressure on the smaller miners.
PBOC again injected through reverse repos, the 3rd consecutive injection over CNY100B and set the yuan reference rate at 6.7451, the strongest setting since October 2016. AUD/USD continued to be buoyed off yesterday’s more hawkish meeting minutes testing 0.7936.
Key economic data
(KR) SOUTH KOREA JUN PPI M/M: -0.4% V -0.2% PRIOR; Y/Y: 2.8% V 3.4% PRIOR
(AU) AUSTRALIA JUN WESTPAC LEADING INDEX M/M: -0.1% V 0.0% PRIOR
(MY) Malaysia Jun CPI Y/Y: 3.6% v 3.9%e
Speakers and Press
China
(CN) China Economic Information Daily Op Ed: Massive outflows of forex reserves to pay for irrational overseas mergers could have an impact on China's forex management system, could affect the stability of the yuan exchange rate
(CN) China can now censor images in one-on-one chats in real time and delete them before the receive can see them - financial press
Australia/New Zealand
(AU) Australia APRA announces "unquestionably strong" capital benchmarks; main banks need CET1 ratios of at least 10.5% by 2020
Korea
(KR) US Commerce Dept said to be probing some fiber imports from Korea and Taiwan; to announce preliminary injury ruling by Aug 11th - press
Japan
(JP) Renewed speculation that BOJ could cut its inflation forecast in its upcoming outlook report - financial press
(JP) Japan Chief Cabinet Sec Suga: Strong economic growth more important than a temporary deficit cut; reiterates govt view that strive for primary balance surplus in FY20/21
Other
(MX) S&P revises Mexico sovereign outlook to stable from negative; Affirms BBB+ rating
Asian Equity Indices/Futures (00:30ET)
Nikkei +0.1%, Hang Seng +0.5%, Shanghai Composite +0.8%, ASX200 +0.6%, Kospi -0.2%
Equity Futures: S&P500 +0.1%; Nasdaq +0.3%, Dax +0.1%, FTSE100 +0.1%
FX ranges/Commodities/Fixed Income (00:30ET)
EUR 1.1555-1.1536; JPY 112.14-111.88; AUD 0.7936-0.7909; NZD 0.7357-0.7341
Aug Gold -0.1% at 1,240/oz; Aug Crude Oil -0.3% at $46.28/brl; Sept Copper -0.1% at $2.72/lb
(AU) Australia Finance Ministry (AOFM) sells A$900M in 2.75% 2028 bonds; avg yield 2.7747% v 2.5124% prior; bid-to-cover 2.82x v 2.69x prior
(CN) China PBoC OMO: injects CNY140B in 7 and 14 day reverse repos v CNY200B prior (3rd consecutive injection over CNY100B)
USD/CNY (CN) PBOC SETS YUAN REFERENCE RATE AT 6.7451 V 6.7611 PRIOR (strongest setting since Oct 2016)
(KR) Bank of Korea (BOK) sells KRW2.3T in 2-yr monetary stabilization bonds; avg yield 1.66% v 1.67% prior
JGB (JP) Japan to sell ¥0.3T in enhanced liquidity auction
(CN) China MOFCOM sells 7-yr bonds; avg yield 3.6056%; bid-to-cover 3.76x
Equities notable movers
Australia
BHP,BHP.AU Reports Q4 iron ore production 60.0Mt v 61.5Mte v 54.0Mt q/q; -1.5%
Wellard Limited,WLD.AU Guides FY17 pretax loss A$65M to loss A$55M, ex-impairments on vessels; -31%
Hong Kong/China
China Shipping Development,1138.HK Guides H1 Net CNY800-900M; -57% to -51% y/y; -3.8%
Japan
Takata Corp,7312.JP Said that victims' lawyers calling it unjust to halt US air bag cases against carmakers – press; -23%
US markets on close: Dow -0.04%, S&P500 0.0%, Nasdaq +0.03%, Russell +0.2%
Best Sector in S&P500: Information Technology
Worst Sector in S&P500: Telecom
Biggest gainers: NFLX +13.5%; WYNN +2.9%; PLD +2.7%
Biggest losers: VNO -20%; HOG -5.9%; CMG -4.3%
At the close: VIX 9.89 (+0.0.7pts); Treasuries: 2-yr 1.35% (-0.6%), 10-yr 2.26% (-2.1%), 30-yr 2.85% (-1.5%)
US Market Summary
Stock were mixed today, focus was on the administration's failure to move forward with healthcare legislation and what that means for potential economic policy reforms. Treasuries were investors' favorites again, and they found more value in medium to long term notes. 10-year yield lost 5.5 bps, dropping to 2.26% , while 30-year bonds lost 6 bps in yield reaching 2.85%. 2s10s spread flattened by 4.5 bps, decreasing to 91 bps, and 10s30s spread remained steady at 59
US Afterhours Movers
SNI Discovery Communications said to be in combination talks with Scripps Networks - US financial press; +14.7% afterhours
MKC, RB.UK McCormick confirms to Acquire Reckitt Benckiser's Food Division for $4.2B (over $4.0B was speculated); +0.2% afterhours
VRTX Announces positive Phase 1, Phase 2 data from three different Triple combination regimens in people with Cystic Fibrosis who have one F508del mutation and one Minimal Function Mutation (F508del/Min); +24.6% afterhours
UAL Reports Q2 $2.75 v $2.65e, Rev $10.0B v $9.96Be; Guides Q3 PRASM -1% to +1%- Guides Q3 CASM 2.0-3.0%, capacity ~4.0%; -3.6% afterhours
EUR/USD Losing Momentum, GBP/USD Throwback Expected, Gold Upside Paused
EUR/USD losing momentum
The EUR/USD rallied in the yesterday's trading session and reached the 1.1582 level, the buyers weren't able to keep the price above the 1.1552 closing price and now is going down. The minor decreased could be temporary because is still located in the buyer's territory.
Has found temporary resistance and now could come down to test and retest some support levels before will resume the upside movement.
Technically is expected to climb much higher in the upcoming period after the impressive breakout above the 1.1466 long term resistance. Will turn to the downside only if the USDX will have enough energy to bounce back on the short term.
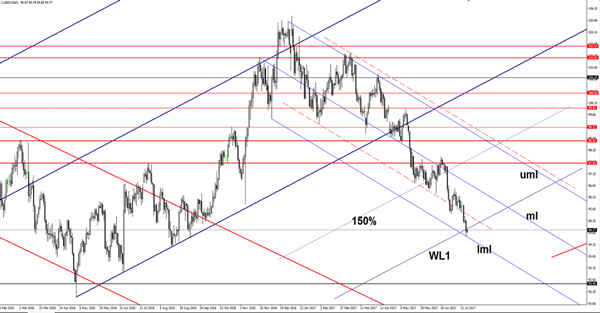
I've added the USDX's daily chart to show you what are the USD's perspectives in the upcoming period, has found temporary support at 94.49 level and now is fighting hard to recover. Has touched the lower median line (lml) of the descending dotted line and closed above this level, signaling an oversold.
USDX is pressuring the broken warning line (WL1) of the major ascending pitchfork, only a false breakout below this level will signal a reversal on the short term. Could increase towards the median line (ml) of the descending pitchfork if will stay above the lower median line (lml).
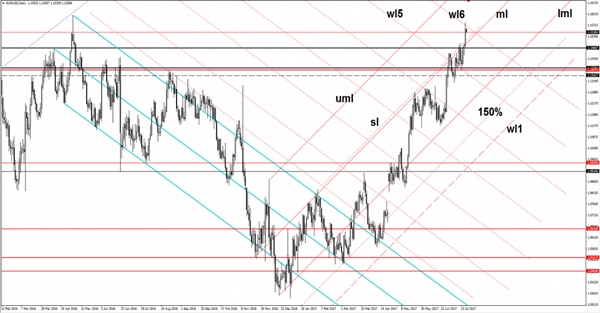
You can see that the USDX's minor rebound has sent the EUR/USD lower, price failed to close above the sixth warning line (wl6) and now could come to test and retest the median line (ml) of the ascending pitchfork and the sliding line (ascending dotted line).
The perspective remains bullish as long as is trading within the ascending pitchfork's body and most important above the median line (ml). The next major upside target will be at the 1.1615 swing high, I an to remind you that is trading inside of a major resistance area, but as I've said higher, the outlook is bullish.
GBP/USD throwback expected
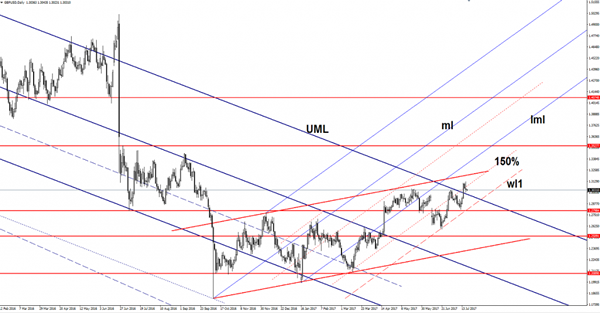
GBP/USD decreased a little in the last two days and could test and retest a former major dynamic resistance (resistance turned into support) before will climb much higher.
Price failed to stay above the 1.3112 level and above the 150% Fibonacci line and now is going down to retest the upper median line (UML) of the major descending pitchfork. A retest followed by an increase will bring us the opportunity to go long again on this pair.
Is trading within an ascending channel, could come to retest also the first warning line (wl1) of the minor ascending pitchfork before will climb towards fresh new highs.
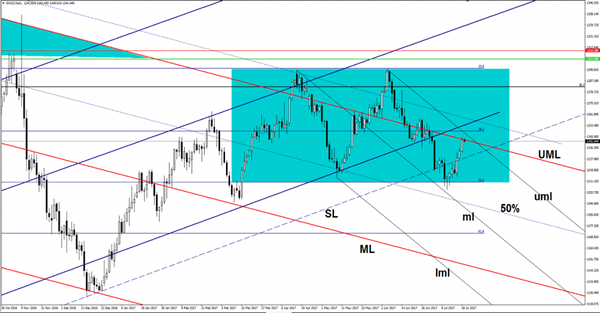
Gold upside paused
We have a rebound in play, which has touched the upper median line (UML) of the major descending pitchfork, this represents a major dynamic resistance, could retest also the upper median line (uml) of the minor descending pitchfork. The bias is somehow bearish as long as is trading under the mentioned resistance levels. Continues to move sideways, between the 23.6% and the 50% retracement levels, we'll have a clear direction after a valid breakout from this range. The bounce back was natural after the false breakdown below the 50% retracement level and after the failure to retest the median line (ml) of the minor descending pitchfork.