
Sample Category Title
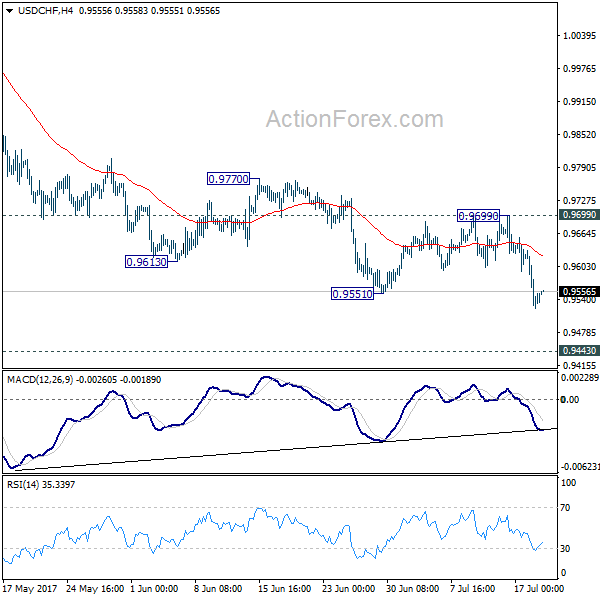
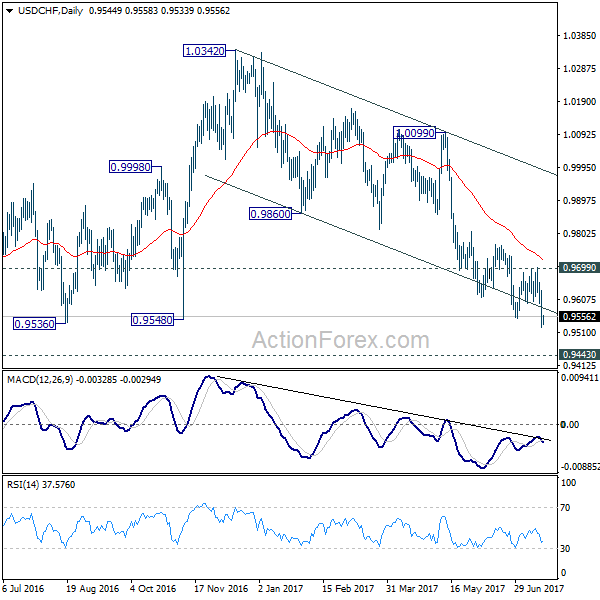
USD/CHF Daily Outlook
Daily Pivots: (S1) 0.9503; (P) 0.9569; (R1) 0.9614; More...
Intraday bias in USD/CHF remains on the downside for the moment. Current fall from 1.0342 should target 0.9443 key support level next. At this point, we'd expect strong support from there to bring rebound. Nonetheless, break of 0.9699 resistance is needed to indicate short term bottoming. Otherwise, outlook will remain bearish in case of recovery.
In the bigger picture, USD/CHF is still bounded in medium term range of 0.9443/1.0342 for the moment. Consolidative trading would likely continue and medium term outlook remains neutral. Break of 1.0342 key resistance is needed to confirm underlying bullish momentum in the pair. Meanwhile, downside attempts should be contained by 0.9443 key support level. However, sustained break of 0.9443 will carry larger bearish implication and target 0.9 handle.
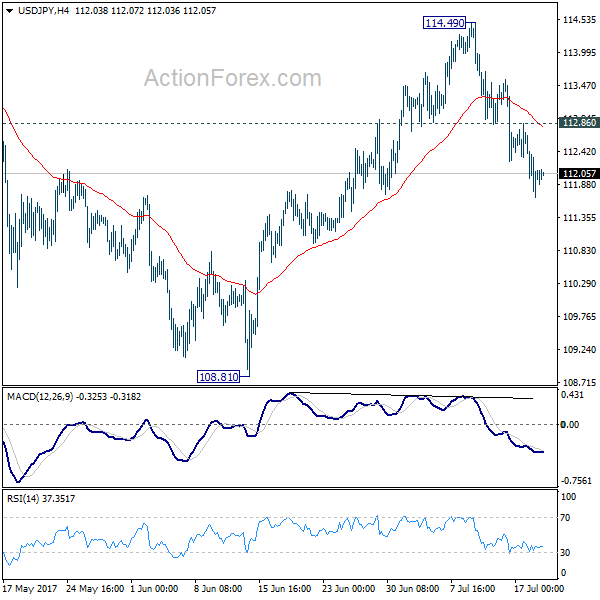
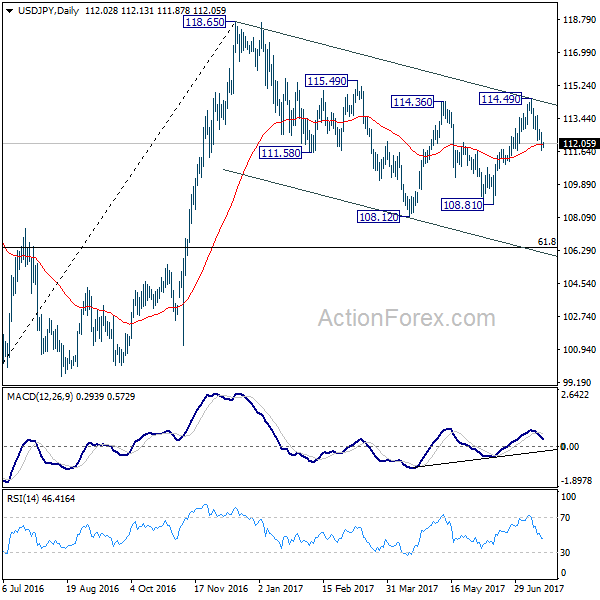
USD/JPY Daily Outlook
Daily Pivots: (S1) 111.60; (P) 112.13; (R1) 112.59; More...
Intraday bias in USD/JPY remains on the downside for the moment. Sustained break of 55 day EMA (now at 112.02) will extend the fall from 114.49 to 108.81 support. As noted before, whole correction from 118.65 is possibly still in progress. Break of 108.81 will confirm and target 61.8% retracement of 98.97 to 118.65 at 106.48. On the upside, above 112.86 minor resistance will turn intraday bias neutral first.
In the bigger picture, the corrective structure of the fall from 118.65 suggests that rise from 98.97 is not completed yet. Break of 118.65 will target a test on 125.85 high. At this point, it's uncertain whether rise from 98.97 is resuming the long term up trend from 75.56, or it's a leg in the consolidation from 125.85. Hence, we'll be cautious on topping as it approaches 125.85. If fall from 118.65 extends lower, down side should be contained by 61.8% retracement of 98.97 to 118.65 at 106.48 and bring rebound.
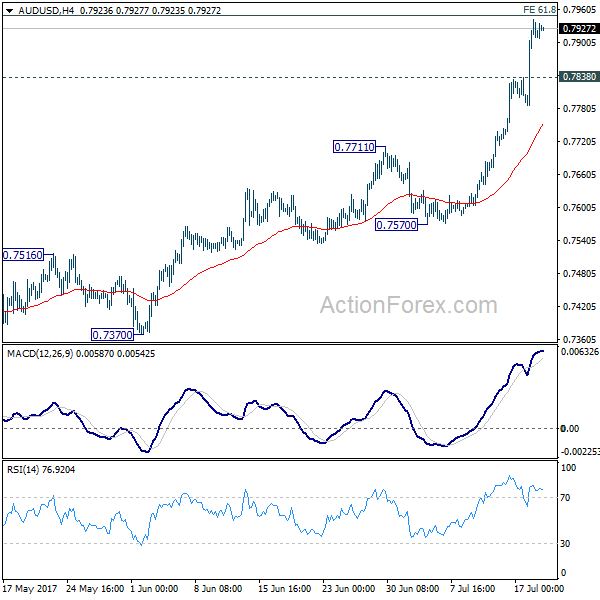
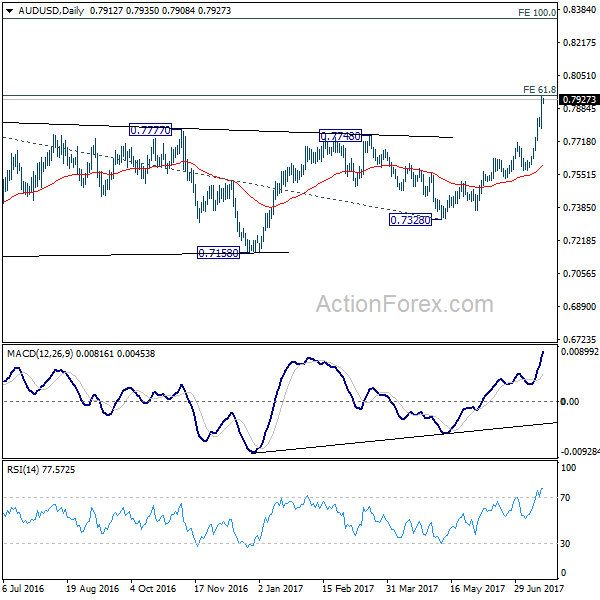
AUD/USD Daily Outlook
Daily Pivots: (S1) 0.7821; (P) 0.7881; (R1) 0.7977; More...
Intraday bias in AUD/USD remains on the upside for 61.8% projection of 0.6826 to 0.7833 from 0.7328 at 0.7950. Decisive break there will target 100% projection at 0.8335 next. On the downside, below 0.7838 minor support will turn intraday bias neutral and bring pull back. But downside should be contained by 0.7711 resistance turned support to bring rally resumption.
In the bigger picture, current development suggests that rebound from 0.6826 is developing into a medium term rise. There is no confirmation of trend reversal yet and we'll continue to treat such rebound as a corrective pattern. But in any case, further rise is now expected to 55 month EMA (now at 0.8100) or even further to 38.2% retracement of 1.1079 to 0.6826 at 0.8451. Break of 0.7328 support is needed to confirm completion of the rebound. Otherwise, further rise is now expected.
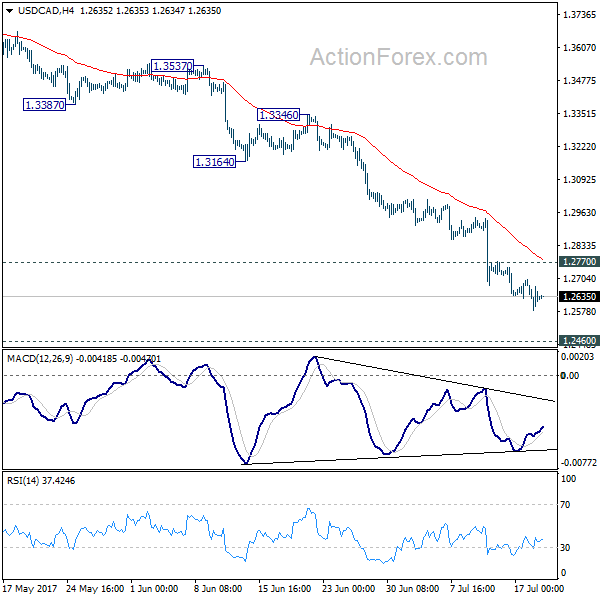
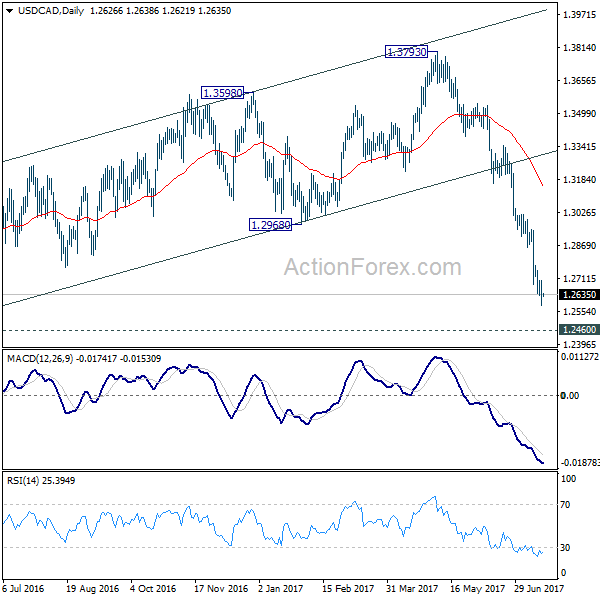
USD/CAD Daily Outlook
Daily Pivots: (S1) 1.2571; (P) 1.2636; (R1) 1.2692; More....
USD/CAD continues to lose downside momentum as seen in 4 hour MACD. But there is no sign of bottoming yet. Intraday bias stays on the downside. Current decline from 1.3793 should target a test on 1.2460 low next. Meanwhile, considering bullish convergence condition in 4 hour MACD, break of 1.2770 will indicate short term bottoming In such case, there will be lengthier consolidation before staging another decline.
In the bigger picture, price actions from 1.4689 medium term top are seen as a correction pattern. Fall from 1.3793 is seen as the third leg and should target 50% retracement of 0.9406 to 1.4869 at 1.2048. At this point, we'd look for strong support from there to contain downside and bring rebound. However, firm break there will target 100% projection of 1.4689 to 1.2460 from 1.3793 at 1.1564.
Dollar Hovers Around 10 Month Low While Stocks Hit Records
Dollar index continues to hover around 10 month low as the greenback stays generally weak, except versus Sterling. Treasury yields also extended recent pull back overnight. 10 year yield dropped -0.046 to close at 2.263, comparing to this month's high at 2.396. Markets saw the collapse of the second healthcare bill in US Senate as another sign of US President Trump's failure in pushing through his agenda. And it's doubtful when Trump would finally start working his pro-growth policies, including tax reforms, through the Congress. On the other hand, stocks were resilient on receding expectation of more policy tightening by Fed. Indeed, both NASDAQ and S&P 500 closed at record highs at 6344.31 and 2460.61 respectively.
Sterling maintains post CPI losses
Meanwhile, Sterling remains broadly weak after suffering deep selloff from CPI miss. BoE Governor Mark Carney said that the "big picture" of inflation remained the same even though CPI slowed from 2.9% yoy to 2.6% yoy in June. He also noted that the main driver of inflation is depreciation of the Pound. And, "that's what's pushing inflation up, and inflation will be above target for a period of time and today's figures are consistent with that." BoE hawks, on the other hand, have been saying that the driver of inflation has fundamentally changed. The debate between MPC members will continuing in the coming months. But for now, it's unlikely that more members would turn hawkish and vote for a hike.
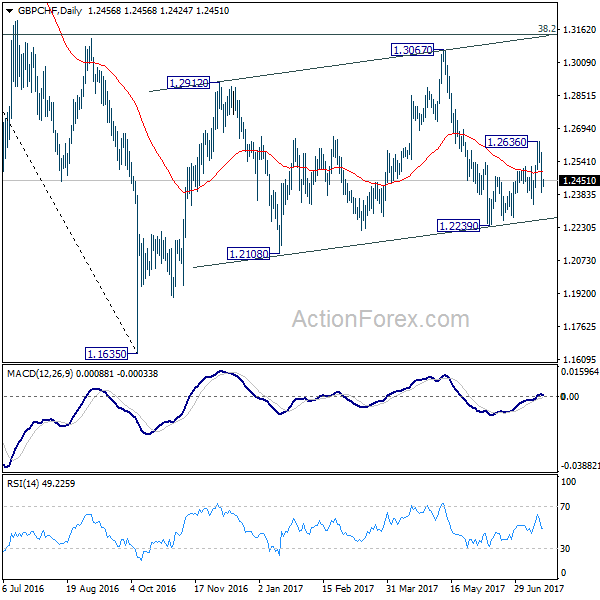
GBP/CHF is one of the biggest movers this week on selloff of Sterling. The development now argues that choppy rise from 1.2239 is a corrective move and could have completed at 1.2636. Deeper fall might now be seen back to 1.2239. Break there would extend the whole decline from 1.3067 and would target a test on 1.1635 low. As GBP/CHF, is limited below long term fibonacci level of 38.2% retracement of 1.5570 to 1.1635 at 1.3138. Price actions from 1.1635 also look corrective. Medium term outlook stays bearish for extending the down trend from 1.5570.
Euro firm ahead of ECB
Euro is, on the other hand, relatively firm as markets await ECB rate decision and press conference on Thursday. It's reported that ECB staff are looking at scenarios of future policy path and decisions could be made in September. The details might include the path tapering, extension of asset purchase as a slow pace, or a combination. There is no solid proposal for the moment and ECB policy makers are unlikely to change the language to signal a policy shift yet. Yet, it should be consensus that the central bank has to take the shift very carefully. Recent comments from ECB President Mario Draghi has also shot up the Euro and yields in Eurozone, that pushed global yields much higher.
Accord to a quarterly survey by ECB, banks in the region are set to expand lending in Q3. ECB said that "while most factors contributed to a net easing of credit standards on loans to enterprises in the second quarter of 2017, competitive pressure remained the main contributing factor." And, "for loans to households for house purchase and for consumer credit and other lending to households, competitive pressure and risk perceptions had an easing impact on credit standards."
Markets look into BoJ board shuffle
BoJ will also announce policy decision later in the week. While no change is expected by the central bank, the markets are eager to see how the reshuffle in the board would shape the balance. New member Goushi Kataoka is a known dove who advocate massive stimulus. He wrote in a research note at Mitsubishi UFJ Research and Consulting earlier this year that "full-blown monetary and fiscal policies coupled with a growth strategy are crucial to break completely out of prolonged economic stagnation." Another new member Hitoshi Suzuki is believed to be a neutral. On the other hand, the usual dissenters Takehiro Sato and Takahide Kiuchi left.
Light day ahead
On the data front, Australia Westpac leading index dropped -0.1% mom in June. Canada will release manufacturing shipments today. US will release housing starts and building permits.
USD/CAD Daily Outlook
Daily Pivots: (S1) 1.2571; (P) 1.2636; (R1) 1.2692; More....
USD/CAD continues to lose downside momentum as seen in 4 hour MACD. But there is no sign of bottoming yet. Intraday bias stays on the downside. Current decline from 1.3793 should target a test on 1.2460 low next. Meanwhile, considering bullish convergence condition in 4 hour MACD, break of 1.2770 will indicate short term bottoming In such case, there will be lengthier consolidation before staging another decline.
In the bigger picture, price actions from 1.4689 medium term top are seen as a correction pattern. Fall from 1.3793 is seen as the third leg and should target 50% retracement of 0.9406 to 1.4869 at 1.2048. At this point, we'd look for strong support from there to contain downside and bring rebound. However, firm break there will target 100% projection of 1.4689 to 1.2460 from 1.3793 at 1.1564.
Economic Indicators Update
| GMT | Ccy | Events | Actual | Forecast | Previous | Revised |
|---|---|---|---|---|---|---|
| 0:30 | AUD | Westpac Leading Index M/M Jun | -0.10% | 0.00% | ||
| 12:30 | CAD | Manufacturing Shipments M/M May | 0.70% | 1.10% | ||
| 12:30 | USD | Housing Starts Jun | 1.16M | 1.09M | ||
| 12:30 | USD | Building Permits Jun | 1.20M | 1.17M | ||
| 14:30 | USD | Crude Oil Inventories | -7.6M |
GOP Boosts Gold As Oil Consolidates
The GOP's infighting weakens the dollar, boosting gold, whilst oil consolidates its recent gains.
OIL
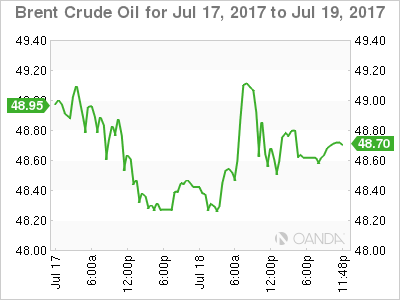
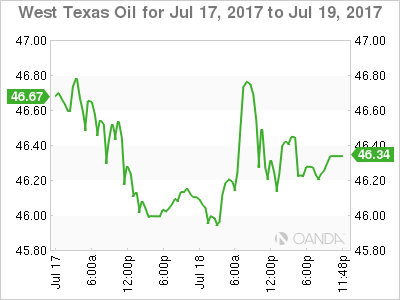
Oil flip flopped in a choppy one dollar range overnight with both Brent and WTI spot ending up almost unchanged for the New York session at 48.60 and 46.25 respectively. Crude rose initially on reports that the Saudi's had further cut production and with the U.S. dollar being sent to the naughty corner in general. The rally petered out in New York's afternoon. It mostly unwound after the American Petroleum Institutes, (API) inventory data came in at a disappointing +1.62 million barrels after last weeks goliath draw down.
The ranging nature of the past two days reflects our view that that positioning is now much more neutral in the oil futures markets. Having been so viciously whipsawed over the previous month, traders are tentative about holding strong views at these levels. More clarity may come tonight from the official U.S. Crude Inventories data where the street is looking for a -3.5 million barrel drawdown. A number less than this or even positive like the overnight API data may undo some of the good work in oil over the last week.
Brent spot trades at 48.60 this morning with support at 48.00 and resistance at 49.30.
WTI spot trades at 46.20 this morning with support at 45.75 and resistance at 47.20 followed by 48.00, the 100-day moving average.
GOLD
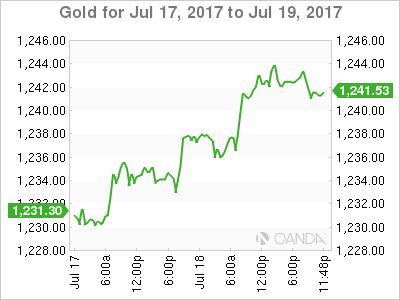
Gold continued its march higher overnight thanks to a confluence of positive factors. Gold rose from 1233.50 to close in New York 1242.70. Gold's rise was sustained by a generally weaker dollar post a dovish Governor Yellen last week. The reassessment by the street of the U.S. interest rate outlook to more dovish has seen gold's appeal as an asset markedly increase.
Political uncertainty is another factor that gold usually finds supportive, and Washington D.C. has been delivering it in spades. In this case, it has not been the rumours swirling around the President, but more the GOP's failure to yet again raise enough votes to repeal Obamacare. This has thrown the entire legislative agenda into doubt. With the GOP's inability to organise even a beer tasting in a brewery, let alone cross the road to the other side, investors have been deserting the Trump trade in droves, and this has been supportive of gold.
Gold is trading at 1241.00 in early Asia with some short term profiting taking seen initially. Resistance sits initially at 1245.00 followed by the 100-day moving average at 1247.50. A daily close above the latter being a bullish technical development. Initial support rests at 1240.00 followed by 1232.00 and then the 200-day moving average at 1230.40. It would probably take a daily close under the last level to make the street reassess its bullish view.
Market Morning Briefing: The Markets May Wait Quietly
STOCKS
Dow, Dax and Nifty are facing some corrective dips while Shanghai looks bullish while Nikkei remains indecisive just now. The next 2-3 sessions could give some clarity on further movements in the price indices.
Dow (21574.73, -0.25%) is trading slightly lower today. 21500-21600 has been a crucial long term resistance and it would be necessary for the index to sustain above 21600 in order to continue the upward rally. While below 21600, there could be chances of a sharp correction towards 21400 or even lower in the near term.
Dax (12430.39, -1.25%) fell sharply but is trading above immediate support near 12380. While 12380 holds, a bounce back towards 12800 is possible in the medium term. Only in case it breaks below 12380, we would have to shift our focus to lower levels of 12200 for the coming sessions.
Shanghai (3215.02, +0.86%) has been rising sharply in the past 2-sessions moving up to our target of 3220. There is scope of further rise towards 3240-3260 in the coming sessions.
Nikkei (20025.22, +0.13%) is stuck within the 19900-20300 region since the last one month and continues to consolidate sideways. A rise back towards 20200 is possible in the near term. We wait for a break on either side of the range for more directional clarity.
Nifty (9827.15, -0.90%) came down from levels near 9900 yesterday but could possibly recover in the next few sessions. While above 9750, trend remains firmly up which could be accompanied by some corrective dips.
COMMODITIES
While Dollar Index (94.52) failed to rebound, Bullion has strengthened again against Dollar yesterday. Gold (1240) and Silver (16.24) are trading well above their crucial support at 1231 and 16.20 respectively. A break above 1245 is necessary for gold to remain bullish towards 1260 for the near term else a fall below 1230 could take it lower towards 1220. Silver is trading within the range of 16.20-16.50 and only a close above 16.50 could negate our midterm bearish view. As dollar index is highly oversold, it will be difficult for Bullion to maintain this short term bullish momentum.
Muted price action had been seen in Copper (2.72) for last couple of trading sessions. It is trading within a range of 2.66-78. Only above 2.78, higher resistances of 2.80 can come into consideration. In the medium term 2.55-57 are going to be a strong support and we will remain bullish while it is trading above those levels.
Both Brent (48.84) and WTI (46.38) moved nowhere as market is waiting for today’s U.S weekly crude inventory data (8:00 pm IST) with an expectation of a shortage (-3.6 MB) in inventory and prices could move according to the outcome. If the anticipation of -3.6 M Barrel of shortage will match the actual outcome then that could be beneficial for both Brent and WTI. Otherwise a surplus or a less than expected shortage could bring bearish possibilities into consideration. Thus 48.80 (Brent) and 46.70 (WTI) could be the levels where the price action has to be checked on a Daily and weekly closing basis to assess the future price direction.
FOREX
The markets may wait quietly for the ECFB and BOJ meet tomorrow before taking the next major step.
The net movement of Euro (1.1539) in the last 24 hours is almost zero as it waits for the ECB policy meet tomorrow. The trend remains firmly up but it must be noted that the net position in Euro is the largest since 2011 and any surprise from the central bank or any other corner may trigger a very sharp correction. Similarly, the Dollar Index (94.76) may have attracted too many shorts. These two crowded trades may invite nasty surprises eventually as the previous historical instances show. Therefore high caution warranted at the current levels this week.
Euro has strong resistance in the band of 1.16-1.17 and Dollar Index has major support near 94.15-00.
Dollar-Yen (112.09) has registered a low of 111.65, not too far from our downside target of 111.35. With no clear reversal signs visible yet, the lower support of 111.00 may be tested before any major short covering emerges.
Aussie (0.7925) is rising very sharply towards our target of 0.8150-75 and the bullish momentum remains intact above the support near 0.7835-00. The target may be achieved by the next week.
Pound (1.3028) is in a minor corrective mode after hitting a high of 1.3125. A pause here can be good for the currency for its technical strength which may help it later to rise above 1.3125 and rally towards 1.32-1.34.
Dollar-Rupee (64.33) has been quiet between 64.2850-3650 due to RBI buying Dollars on dips and the fall in the Nifty yesterday. Although Dollar-Rupee remains in a downtrend, some amount of buying should be expected just above 64.20.
INTEREST RATES
The German yields are trading lower and could fall some more in the near term. The 10Yr (0.56%) could move towards 0.50% while the 30Yr (1.30%) could come off towards 1.18% in the near term.
The UK yields continue to move down and look bearish just now. The 10Yr (1.21%) and the 20Yr (1.75%) are down from 1.24% and 1.78% and could fall some more in the near term. This could possibly bring down Pound in the next few sessions.
The German-US 10Yr (-1.71%) is just below channel resistance which could push it back towards -1.75% in the near term. This could also indicate a small dip in Euro from levels near 1.16.
The US-Japan 10Yr (2.19%) is falling and could test levels near 2.09% pulling down Dollar Yen towards 111.50 or lower in the near term
Soft Inflation Sends Sterling Lower
Pressures for the BoE to raise rates to fend runaway inflation were eased overnight, as CPI disappointed expectations and producer prices were mixed.
Whilst the numbers overall were not bad by modern standards, this marks the first slowdown since October after hitting a 4-year high in May. The key issue here is that BoE are concerned with inflation overshooting, so any signs of softness is seen by traders as less reason for them to hike or reduce balacne sheet. Despite the setback, Carney said CPI remain in line with the BoE’s projections which is expected to overshoot for some time. The debate over whether or when they may hike hinges around how far inflation overshoots and for how long it remains. After 3 members dissented at the last meeting it appeared Kristin Forbes had drummed up support in her argument that inflation was to overshoot the bank’s projections further and for longer. Yet signals from the BoE have since been mixed, with Carney seemingly shifting between hawkish and dovish between meetings.
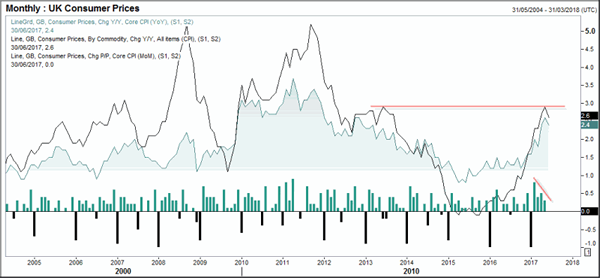
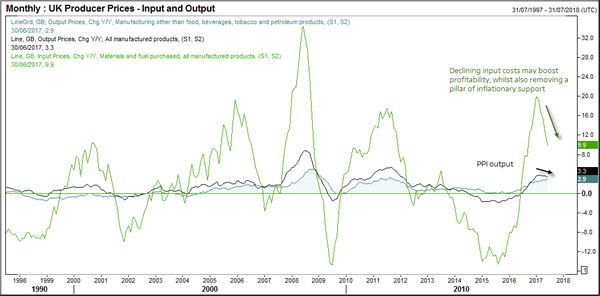
Producer prices fared better with output increasing to 2.9% YoY compared with 2.8% prior and core output MoM% beating expectations to rise 0.2% (versus 0% forecast and 0.1% prior). Broad PPI hit the consensus of 3.3% YoY, which is down from 3.6%. Input prices were mixed as they declined -0.4%, although this was above expectations and prior which sat at -1% and -0.7% respectively. Fuel purchases were the biggest drag on the reads which declined -1.5% MoM, with material purchases declining -0.2% MoM.
GBPAUD provided one of the larger moves overnight, second only to the decline of GBPCHF. We have covered GBPAUD in our recent video but we continue to believe there is more downside potential here. The same can be said for GBPCHF as this is the risk-off play around Brexit. For GBPAUD we are taking advantage of the diverging sentiment surrounding Australia and the UK, following yesterday’s RBA minutes and unfavourable coverage for the UK government in Brexit talks.
The bearish momentum following the break of the rising channel is packing up pace to suggest a similar move we saw from the 1.765 high to the 1.661 low. We have provided the 50% retracement of yesterday’s range as these can become useful areas of resistance upon a retracement. This can in turn aid with trade entry for a sell-limit or stop placement for a sell-stop order of your choosing. Yet before piece can test the 50%, we also have the monthly S1 and 14th April low to content with which provides a potential resistance zone between 1.645-1.657
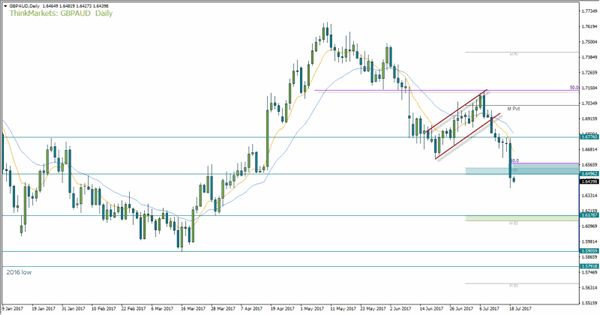
Our next target area sits around the 1.62 areas which is near the monthly S2 and 30th March low. If we are now witnessing the beginning of an impulsive move, this assumes an eventual break below 1.59 and the 2016 low of 1.5790. From a fundamental perspective, what may aid this development is the growing realisation from the UK government that are not in the controlling seat whatsoever whilst inflation continues to undershoot expectations (less pressure for BoE to rise). From Australia’s perspective, if economic data continues to be okay overall whilst US data disappoints, then GBPAUD downside may move faster than expected.
EUR/CHF Could Turn To The Downside, AUD/USD Is The Upside Movement Completed? EUR/GBP False Breakdown?
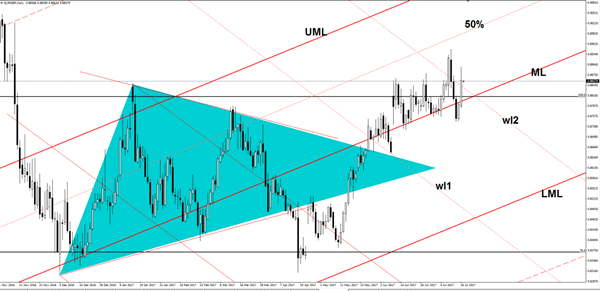
EUR/CHF could turn to the downside
Price decreased in the yesterday's session and invalidated the breakout above a dynamic resistance, maintains a bullish perspective, but we may have a minor retreat in the upcoming days. I've said in the previous reports that we may have another leg lower on the short term as the pair touched a strong resistance area.
However, the retreat could be only temporary because could come down to test and retest some support levels in the upcoming period. Continues to stay much above the 1.1000 psychological level signalling that the bulls area still in the game, a correction is somehow natural after the impressive rally. Could jump much higher anytime, so is not recommended to go short on this pair at this moment.
We had several false breakouts above the upper median line (UML) of the major ascending pitchfork and above the median line (ml) of the minor ascending pitchfork, signalling an overbough. The failure to climb above these levels could bring a minor correction on the Daily chart, the rejection could send the rate towards the warning line (WL1) and towards the lower median line (lml) of the minor ascending pitchfork, where he could find support again.
Could be attracted by the confluence area formed at the intersection between the lower median line (lml) with the warning line (descending dotted line). We may have another bullish momentum from there.
The upside movement will resume only if will jump and close above the 1.1072 previous high, otherwise could decrease even towards the median line (ML) of the major ascending pitchfork. Has opened with a minor gap down today, signalling that the bears are getting stronger on the short term.
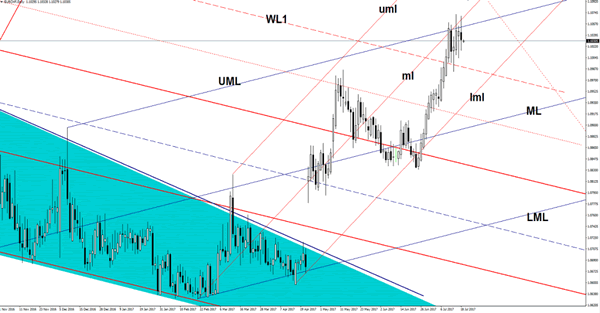
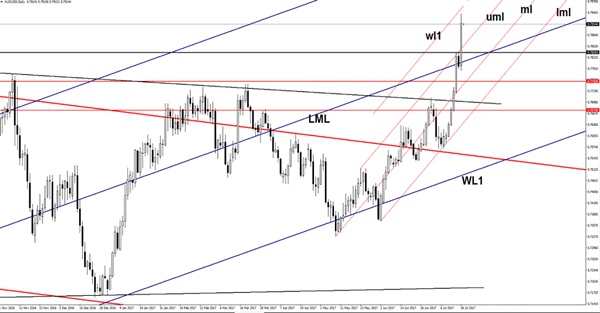
AUD/USD is the upside movement completed?
The AUD/USD rallied aggressively in the yesterday's trading session and jumped much above 0.7900 psychological level, but found strong resistance at the 0.7942 level. Maintains a bullish perspective, despite a minor retreat. Actually a decrease will be natural after the impressive rally.
The greenback was demolished by the USDX's impressive drop, the index plunged much below the 95.00 psychological level and reached the 94.49 level. USDX touched also a strong dynamic support, but is premature to say that will be strong enough to stop the bearish momentum.
Price found resistance right below the first warning line (wl1) of the minor ascending pitchfork and now could decrease towards the upper median line (uml). Has touched the May 2015 highs today, could climb much higher as long as is trading above the lower median line (LML) of the major ascending pitchfork.
EUR/GBP false breakdown?
Looks like that we had a false breakdown below the median line (ML) of the major ascending pitchfork and below the 100% Fibonacci level. Has come back above the second warning line (wl2) of the descending pitchfork, we'll have a great buying opportunity if will stay above this broken obstacle and if will come to retest the ML.
EUR/USD Channel Breakout
Remember last week, we had EUR/USD reaching channel resistance?
Here's a refresher of the chart if your memory is a little hazy on hump day (we can all relate, don't worry!):
EUR/USD Daily:
As you can see, this was the third touch of the daily channel resistance level. Just keep in mind that price is still 250 pips or so away from the horizontal level that makes the top of the horizontal range that we're also watching, but it was hugely significant resistance none the less.
The point we made around that chart was this:
If you're already long off that previous hourly resistance turned support level, then you're sitting pretty right now and can afford to hold for a higher time frame break out.
It was this EUR/USD intraday breakout and retest of resistance as support that gave us that line and very well done to those of you that managed to hold your nerve. You certainly got paid in the end!
I've used a 4 hour chart below, simply because it shows the daily channel breakout the clearest. But of course you can look at it on whatever time frame suits you.
EUR/USD 4 Hourly:
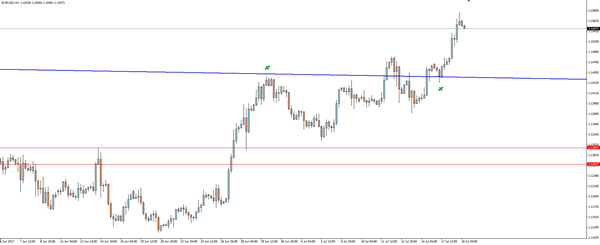
A clear breakout, (another) retest of previous resistance as support and then a momentum push higher.
If you're a technical trader, this entire narrative is pure art.
Best of probabilities to you.