Sample Category Title
UK Inflation Growth Slows Amid Slump In Oil Prices
'Falling inflation alleviates the squeeze on household finances – though pay is still shrinking in real terms for now. Last week's labour market update from the ONS showed wages growing by less than inflation for a third consecutive month.' - Ben Brettell, Hargreaves Lansdown
Britain's inflation fell unexpectedly in June from a four-year high reached in the previous month. The Office of National Statistics reported that the country's Consumer Price Index dropped 2.6% year-over-year, missing expectations for an unchanged reading of 2.9%, while the monthly rate slipped from 0.3% to 0.2% in the in June. The Core CPI, which excludes volatile items such as food and fuel, registered a weaker-than-expected reading of 2.4%, following May's 2.6% figure. The surprise fall, mainly driven by lower prices of oil and certain recreational and cultural goods, was partially offset by a rise in prices of furnishings and furniture. The strong decrease in the value of the British Pound after Brexit raised costs of imported goods, suggesting that inflation would show at least 3% pace of growth this year. Though, the UK economy being heavily dependent on consumers is expected to face further effects of subdued spending due to outpaced wage growth. Moreover, the weakness in recent reports hinted that the Bank of England is less likely to raise interest rates in the near term.
German ZEW Economic Sentiment Deteriorates Slightly In July
'The outlook for the German economic growth in the coming six months continues to be positive. This is now also reflected in the survey results for the eurozone.' - Achim Wambach, ZEW
The mood among German investors about the performance of the country's economy fell slightly in July. The Mannheim-based ZEW Institute reported on Tuesday that its Economic Sentiment Index for Germany dropped to 17.5, falling short of expectations for a decrease to 17.8 from May's 18.6 figure. Still, the report suggested that the outlook for the Euro zone's largest economy continued to be optimistic, with economists anticipating to see a solid economic expansion in the Q2 after growing 0.6% in the March quarter amid stronger private investments, rebounding exports and higher household spending. Meanwhile, the ZEW economic sentiment for the Euro zone's development fell to 35.6 for July, retreating from 22-month highs seen in the previous months. However, the Current Conditions Index marked a strong increase to 28.7 from 20.5 registered previously, supported by monthly improvements in expectations for both Italy and France. Overall, still strong economic expectations are set to diminish the need for the European Central Bank's expansionary monetary policy.
Technical Outlook: USDJPY – Bears Take A Breather Above Strong Supports But Downside Remains At Risk
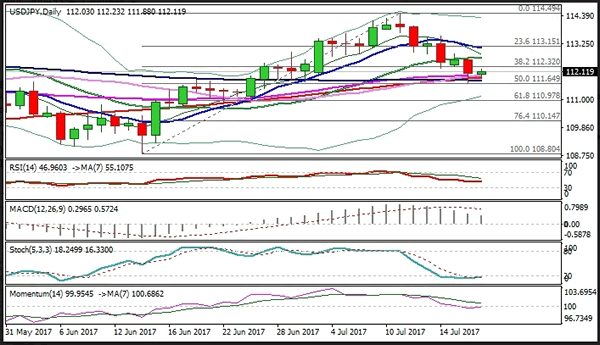
The pair is consolidating above solid support at 111.64 (daily Kijun-sen/50% of 108.80/114.49 rally) where Tuesday's fall found footstep. Bearish acceleration also cracked a plethora of supports provided by daily MA's (laying in 112.00/111.76 zone) but failed to close below and generate fresh bearish signal. Stronger upticks could be expected as slow stochastic is oversold on daily chart and reversing higher. Falling hourly cloud (spanned between 112.37 and 112.67) weighs and should cap extended upticks, with cloud top being reinforced by 20SMA. Eventual break below 111.64 pivot would signal fresh weakness and open 110.97 support (Fibo 61.8% of 108.80/114.49 rally) while extension above 112.75 (Fibo 38.2% of 114.49/111.64 pullback) would generate bullish signal and open way for fresh recovery. BoJ policy meeting on Thursday is in focus, with central bank expected to keep policy unchanged but may tweak forecast.
Res: 112.23, 112.37, 112.67, 112.75
Sup: 111.88, 111.64, 111.13, 110.97
USD/JPY Candlesticks and Ichimoku Analysis
Weekly
• Last Candlesticks pattern: Marubozu
• Time of formation: 14 Nov 2016
• Trend bias: Down
Daily
• Last Candlesticks pattern: Shooting star
• Time of formation: 15 Feb 2017
• Trend bias: Down
USD/JPY – 112.09
Although the greenback surged to as high as 114.50 early last week, lack of follow through buying on break of previous resistance at 114.37 and the subsequent sharp retreat suggest top has been formed there and consolidation with downside bias is seen for test of the Kijun-Sen (now at 111.66), a daily close below there would add credence to this view and extend weakness to the lower Kumo (now at 111.08), then towards 110.70. Having said that, as broad outlook remains consolidative, reckon downside would be limited to 110.00 and 109.40 support should remain intact.
On the upside, whilst initial recovery to 112.80 is likely, reckon upside would be limited to the Tenkan-Sen (now at 113.09) and bring another decline later. Above 113.55-60 would defer and risk a stronger rebound to 114.00, however, price should falter below said resistance at 114.50 and bring another decline later. Above 114.50 would extend the rebound from 108.13 to 114.65, then towards resistance at 115.51 which is likely to hold from here.
Recommendation : Sell again at 112.70 for 110.70 with stop above 113.70.
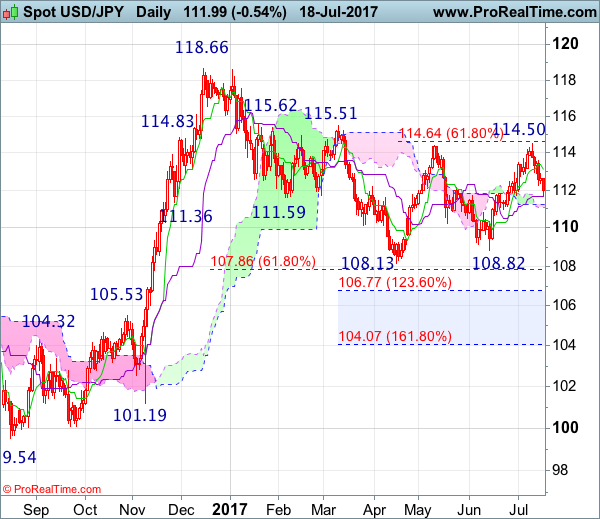
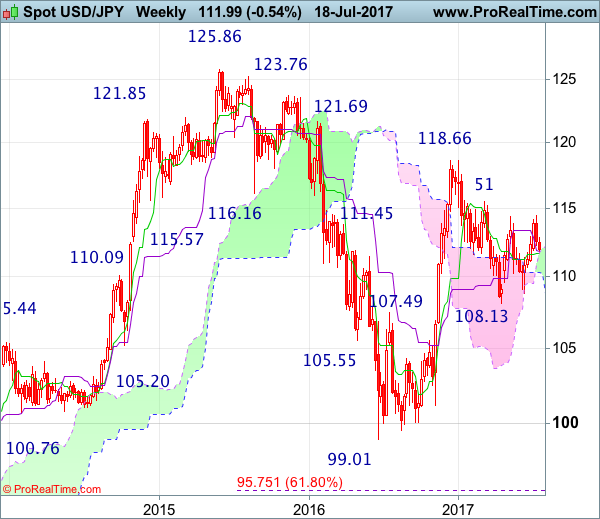
On the weekly chart, although dollar rose marginally to 114.50 last week, the subsequent retreat formed a black candlestick, suggesting top is possibly formed there and consolidation with downside bias is seen for weakness to the Tenkan-Sen (now at 111.66), below there would extend fall to 111.00, then test of 110.70, however, reckon the lower Kumo (now at 110.35) would limit downside and price should stay well above support at 108.82, bring recovery later.
On the upside, although recovery to 112.70 cannot be ruled out, reckon upside would be limited to 113.00 and bring another decline later to aforesaid downside targets. Above 113.55-60 would risk another test of said resistance at 114.50 but only break there would signal the rebound from 108.13 is still in progress for gain towards resistance at 115.51 but a weekly close above there is needed to signal the fall from 118.66 top has ended at 108.13, then headway to 116.00-10 would follow but resistance at 117.53 should hold from here.
Daily Technical Analysis: USDJPY Descending Trendline Marks The Downtrend
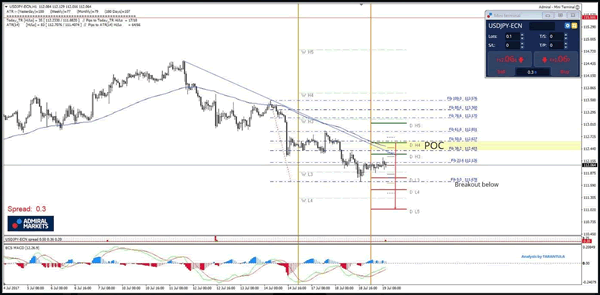
The USD/JPY has been dropping, making a descending zig-zag pattern which marks the downtrend. The POC zone 112.40-62 (D H4, Trend line, ATR pivot, EMA89) could reject the price towards 111.70 and if the 111.65 breaks to the downside 111.40 and 111.00 should be next. If we don't see a retracement towards the POC, pay attention to 111.65 and possible breakout below. However if the price breaks above 112.70 we might see a retest of 113.00-113.15 zone.
Forex Technical Analysis: EUR/USD, USD/JPY, GBP/USD
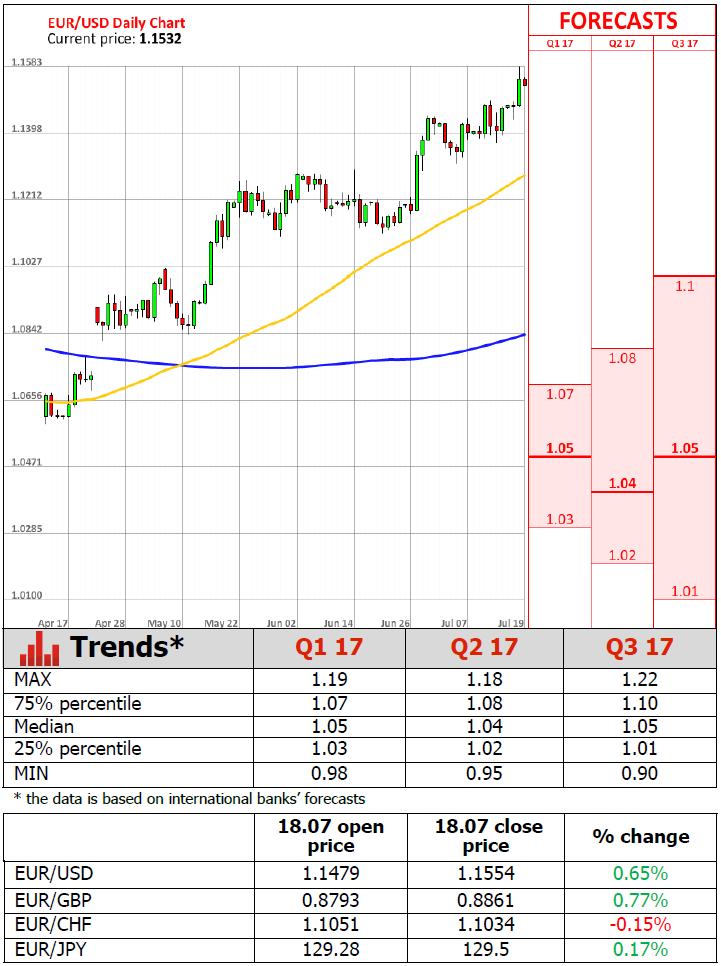
EUR/USD
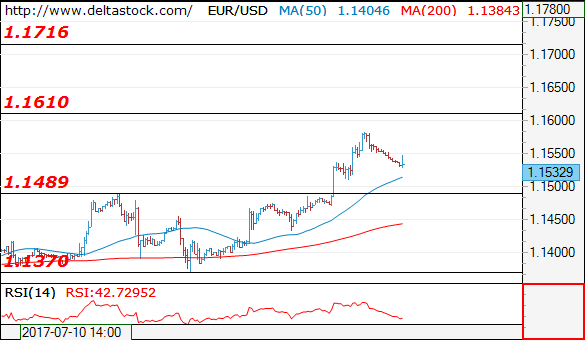
Current level - 1.1532
The recent reversal at 1.1582 signals a slight bearish bias, for a test of 1.1490 support area. Current slide should be considered corrective on the senior frames, preceding another leg upwards, to 1.1720 area.
| Resistance | Support | ||
| intraday | intraweek | intraday | intraweek |
| 1.1550 | 1.1610 | 1.1490 | 1.1370 |
| 1.1610 | 1.1720 | 1.1370 | 1.1290 |
USD/JPY
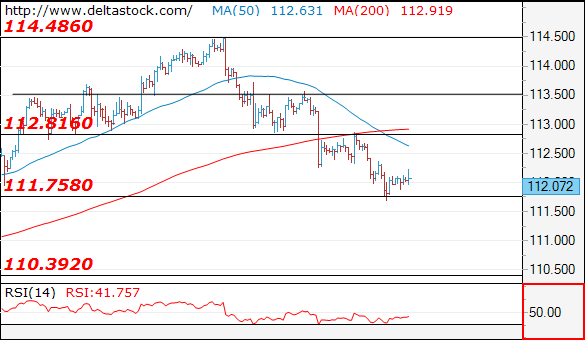
Current level - 112.07
The downtrend is intact with an initial resistance at 112.40 and crucial level at 112.80. I favor a break through 111.75, towards 110.30 area.
| Resistance | Support | ||
| intraday | intraweek | intraday | intraweek |
| 112.80 | 114.50 | 111.75 | 111.75 |
| 113.50 | 115.50 | 110.30 | 110.20 |
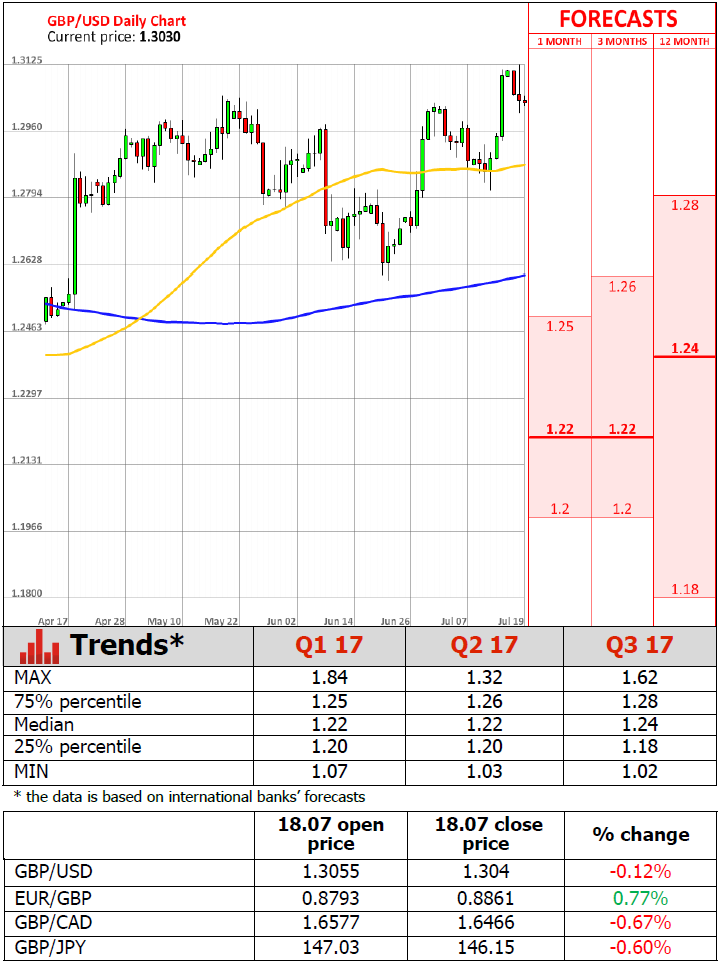
GBP/USD
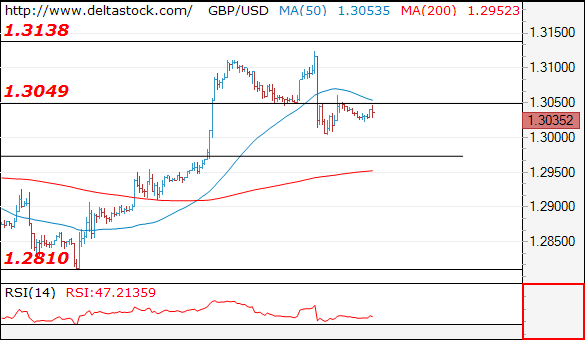
Current level - 1.3035
The second test below 1.3130 resistance failed as well and the intraday bias is bearish, for a tight test of 1.2970-80 support zone. Minor intraday hurdle lies at 1.3050.
| Resistance | Support | ||
| intraday | intraweek | intraday | intraweek |
| 1.3050 | 1.3260 | 1.3000 | 1.2810 |
| 1.3130 | 1.3500 | 1.2970 | 1.2480 |
Technical Outlook: GBPUSD – Hourly Cloud Base Holds For Now But Near-Term Risk Is Skewed Lower
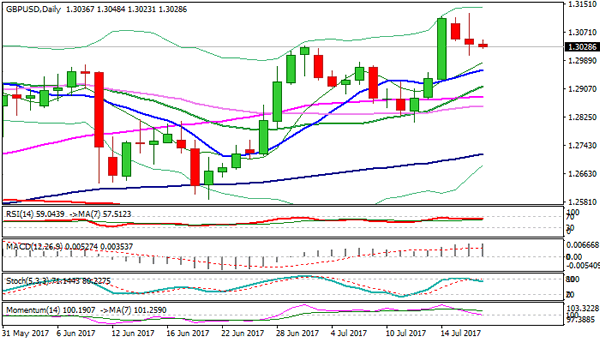
Cable stays at the back foot on Wednesday and consolidating within narrow range at 1.3040 zone, after Tuesday's sharp fall on weak UK CPI data found footstep at 1.3000 zone.
Near-term action is so far holding above hourly cloud base (1.3026) which marks key support along with psychological 1.3000 level.
While cloud base is holding, the price is expected to range within hourly cloud (1.3026/1.3074), with lift above cloud to signal an end of corrective phase and shift focus higher.
Eventual close above 1.3109 (Fibo 38.2% of 1.5016/1.1930 descend) is needed to signal bullish continuation. Otherwise, increased downside risk could be expected on sustained break below hourly cloud and 1.3000 handle. The notion is supported by reversal of slow stochastic from o/b territory on daily chart.
Close below 1.3010 (Fibo 38.2% of 1.2824/1.3125 upleg) is needed to generate stronger bearish signal for deeper pullback from fresh high at 1.3125. With no data from UK today, technicals are expected to be the main driver of GBPUSD pair.
Res: 1.3048, 1.3076, 1.3109, 1.3125
Sup: 1.3023, 1.3000, 1.2968, 1.2939
USDJPY Intra-Day Neutral, Records Bearish Cross
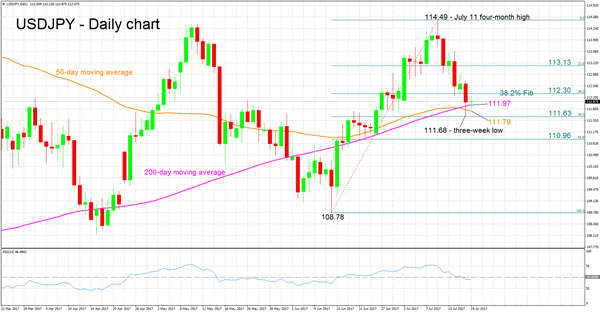
USDJPY hit a three-week low of 111.68 during yesterday's trading. The pair experienced significant declines since reaching a four-month high of 114.49 on July 11.
The RSI is currently at 46, close to the 50 neutral-perceived level. In addition, the indicator has flatlined, projecting neither a positive, nor a negative intra-day direction.
On the upside, the area around the 38.2% Fibonacci retracement level (June 14 – July 11 upleg) at 112.30 could provide resistance. Further up, the 113 handle, combined with the 23.6% Fibonacci mark at 113.13, might form an additional resistance area.
On the downside, the 200-day moving average (MA) and 50% Fibonacci level, ranging from 111.97 to 111.63, could offer support. Notice that this range also encapsulates the current level of the 50-day MA as well as yesterday's three-week low. Moreover, bear in mind that the 200-day MA was briefly violated today. Should the price continue declining, the 61.8% Fibonacci mark at 110.96 would be eyed next.
In the wider picture, the pair has recorded a bearish cross this week when the 50-day MA moved above the 200-day one. This is generally perceived as a positive medium-term signal. However, it is too early to judge the strength of this signal – a move below both MAs would reinforce it. For the time being, the pair remains predominantly neutral in the medium-term given the significant sideways movement since the start of the year.
Markets Calm Ahead Of ECB, BoJ Meetings, Oil Pressured On US Inventories
It has been a quiet overnight session ahead of what could be a stormy Thursday with the European Central Bank and the Bank of Japan holding their policy meetings. Most majors traded in a narrow range, while oil prices recorded the biggest move of the day.
The Australian and New Zealand dollars continued gaining against their US counterpart during the Asian session. Aussie/dollar was up to last trade at 0.7932, supported by comments perceived to be hawkish from the Reserve Bank of Australia’s policy meeting minutes and higher commodity prices.
The greenback was steady against the yen ahead of the Asian markets close, having traded in a relatively narrow range of 111.87-112.23. The US currency has been impacted negatively from both political and economic developments. The latest news on the failure to repeal and replace Obamacare, after two more Republican Senators opposed the latest bill proposal, sent the dollar tumbling against all major currencies. The news came after Friday’s disappointing inflation and retail sales figures. The markets are skeptical about future interest rate hikes considering the lack of inflation pressures and fear of the Trump administration failing to pass any legislation which could spur growth. The yield on 10-year US Treasuries is up one basis point to 2.27%, though down seven basis points this week after dropping five basis points last week.
The euro has been pressured during Asian trading as some profit taking might have taken place ahead of the ECB policy meeting tomorrow. It will be ECB President Mario Draghi’s first public appearance following his relatively hawkish comments in Sintra, Portugal, which sent the euro to new highs against the dollar. News broke out overnight about the ECB examining its options concerning its stimulus package, in order to make a decision in the autumn. Traders will be closely monitoring the meeting tomorrowas it could significantly move the euro against its peers. Euro/dollar was last trading at 1.1534.
Sterling was flat against the US dollar during the Asian session. Pound/dollar was last trading at 1.3037.
Crude oil prices were the biggest movers during session, with both WTI and Brent falling about half-a-percent. Oil prices pulled back, as investors awaited fresh data on US crude inventories, which are seen to have increased last week. WTI was last trading at $46.15 a barrel while Brent was at $48.61.
Gold has been under slight pressure today, following a strong rally for three days. The precious metal was last trading at $1,240.00 an ounce.
While the Asian session was quiet due to a lack of economic releases, the US session could get busier amid the release of building permits issued in June as well as housing starts. Oil traders will likely be busy with the release of US crude oil inventories in the early US session.
Trade Idea : USD/CHF – Exit long entered at 0.9555
USD/CHF - 0.9647
Most recent candlesticks pattern : N/A
Trend : Near term down
Tenkan-Sen level : 0.9549
Kijun-Sen level : 0.9564
Ichimoku cloud top : 0.9644
Ichimoku cloud bottom : 0.9617
Original strategy :
Bought at 0.9555, Target: 0.9655, Stop: 0.9520
Position : - Long at 0.9555
Target : - 0.9655
Stop : - 0.9520
New strategy :
Exit long entered at 0.9555,
Position : - Long at 0.9555
Target : -
Stop : -
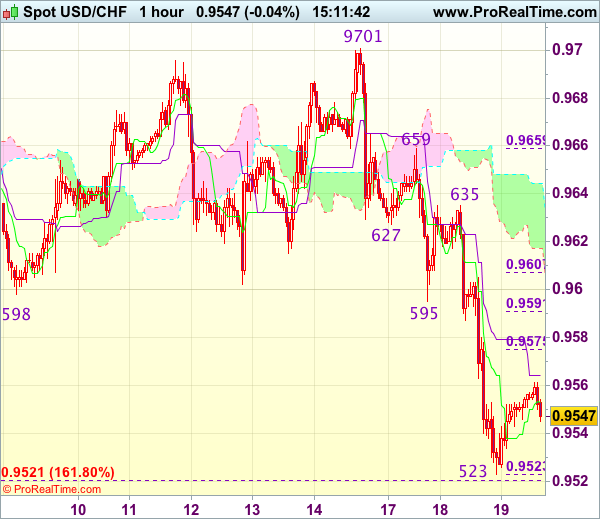
Although the greenback recovered after falling to 0.9523 yesterday, near term downside risk remains and below said support would extend recent selloff to 0.9500 and possibly towards 0.9475-80, however, loss of near term downward momentum should prevent sharp fall below latter level and reckon 0.9440-50 would hold from here, risk from there is seen for another rebound later.
In view of this, would be prudent to exit long entered at 0.9555 and stand aside for now. Above 0.9575 (38.2% Fibonacci retracement of 0.9659-0.9523) would bring a stronger recovery to previous support at 0.9595 but reckon upside would be limited to 0.9605-10 (61.8% Fibonacci retracement) and resistance at 0.9635 should remain intact, bring another decline later.