

Sample Category Title
Dollar Index (DXY) Elliott Wave Forecast: Bullish Sequence Calls for Extended Gains
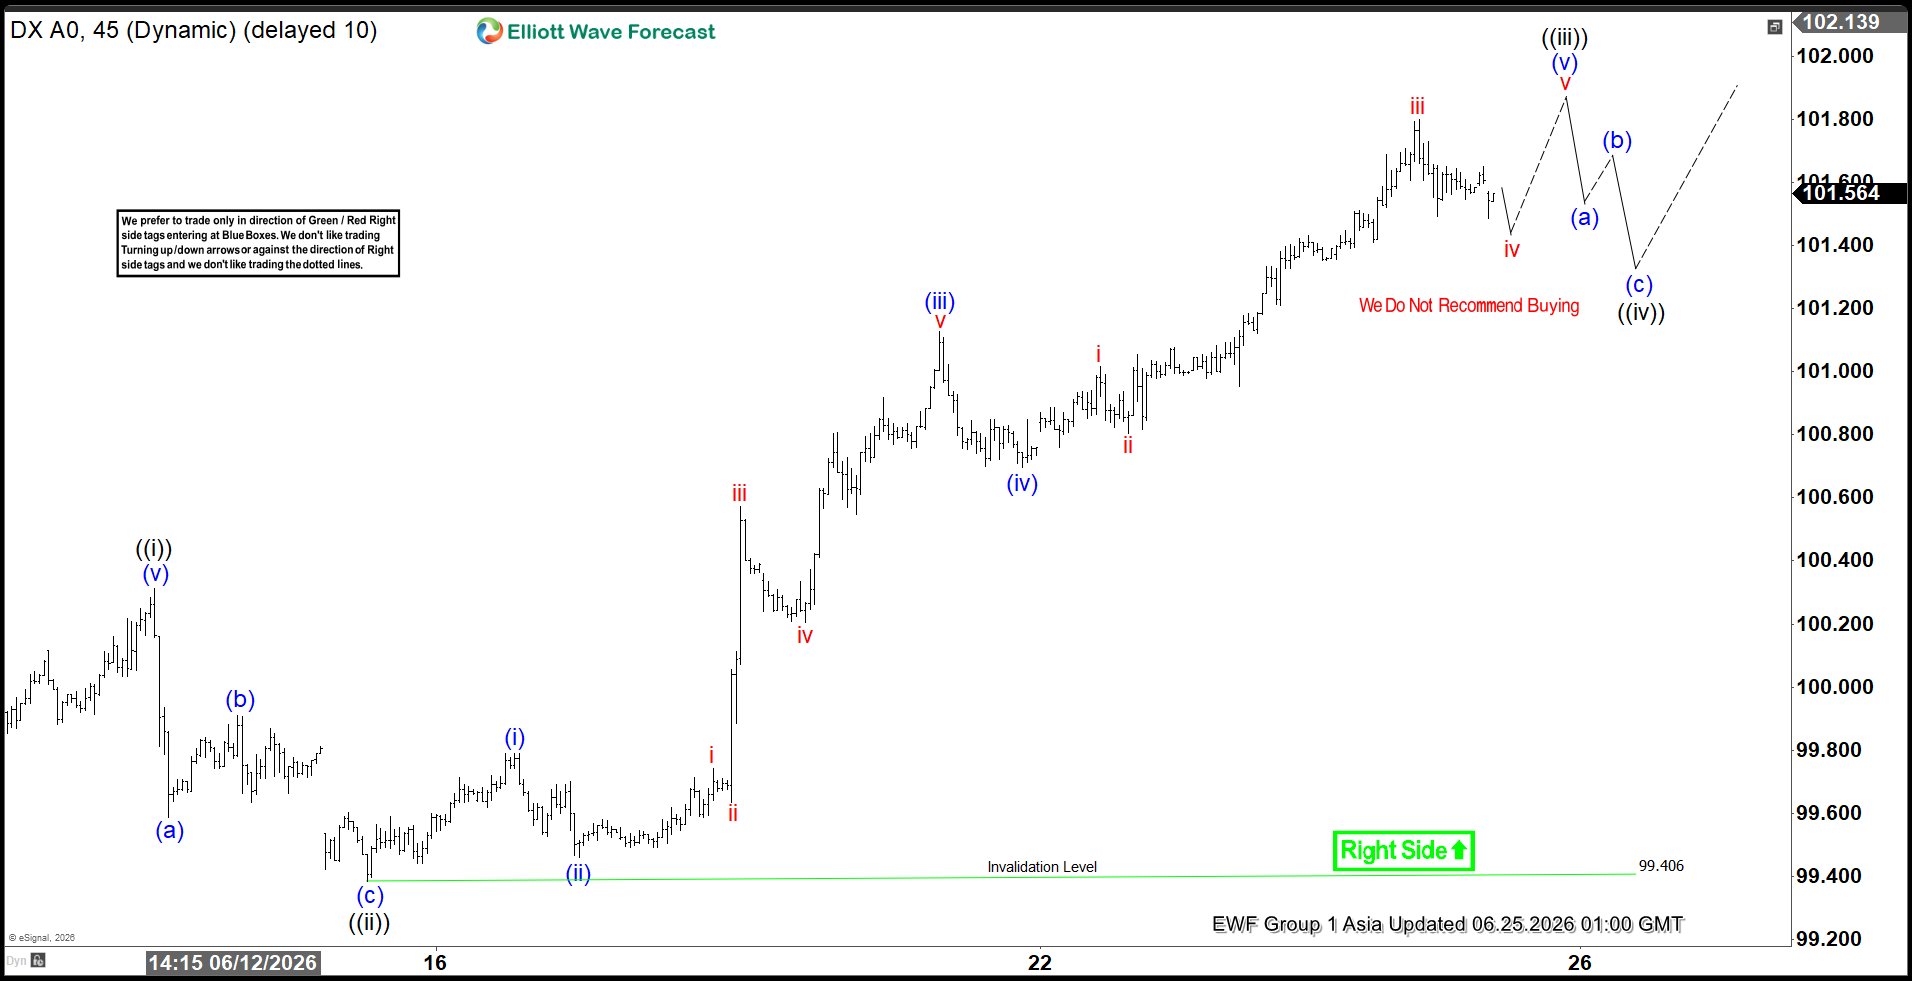
The Dollar Index (DXY) maintains an incomplete bullish sequence from the January 27, 2026 low, supporting expectations for further upside. The projected target lies within the 100%–161.8% Fibonacci extension range, measured from that low, pointing toward 102.7–106.0. This zone provides a clear technical framework for anticipating continued strength.
From a short‑term perspective, the rally that began on May 29 is unfolding as a five‑wave impulsive Elliott Wave structure. Within this advance, wave ((i)) concluded at 100.31, followed by a corrective pullback in wave ((ii)) that ended at 99.38. The subsequent progression has carried the Index higher in wave ((iii)), which itself forms a smaller degree impulse.
From wave ((ii)), wave (i) terminated at 99.79, while wave (ii) retraced to 99.46. The Index then extended upward in wave (iii) to 101.12, before wave (iv) dipped modestly to 100.69. One more push higher is expected to complete wave (v) of ((iii)). After that, a corrective phase in wave ((iv)) should unfold, addressing the cycle from the June 15 low before resuming the broader advance.
Near term, as long as the pivotal support at 99.40 remains intact, pullbacks are expected to attract buyers. These corrections should unfold in the typical three, seven, or eleven‑swing sequences, reinforcing the bullish bias and supporting the view of continued strength in the Dollar Index.
Dollar Index (DXY) 45-Minute Elliott Wave Chart
DXY Elliott Wave Video:
https://www.youtube.com/watch?v=7GIsntAyx4A
Asia Open: Micron Earnings Beat Sparks Global Semiconductor Rally, USD Remains Firm
Key takeaways
- Micron’s blockbuster earnings have reaffirmed that AI memory demand remains exceptionally strong. Record quarterly revenue, a substantial earnings beat, and robust guidance reinforce the view that high-bandwidth memory (HBM) and AI data centre spending remain supply-constrained despite broader macro uncertainty.
- The AI investment cycle has regained momentum after a sharp valuation reset. Micron’s results suggest the recent semiconductor selloff was driven more by positioning and valuation concerns than by deteriorating AI fundamentals, triggering a broad recovery across global chip stocks.
- Falling oil prices continue to improve the macro backdrop for growth assets. The continued unwinding of the Middle East geopolitical risk premium is easing inflation concerns and reducing input costs, partially offsetting the headwind from higher-for-longer interest rates.
- Attention now shifts to US Core PCE inflation. While Micron has significantly improved sentiment toward AI equities, today’s inflation data remains the key macro catalyst determining whether Treasury yields and the US dollar will continue to cap further upside in technology stocks.
- Chart of the day: WTI crude bearish breakdown below the 200-day moving average, with further potential short-term weakness ahead, below $75.25, a key short-term resistance level.
Chart of the day - WTI crude bearish breakdown below key 200-day MA
Fig. 1: West Texas Oil CFD minor trend as of 25 Jun 2026 (Source: TradingView). The information presented is historical information, and past performance is not indicative of future performance.
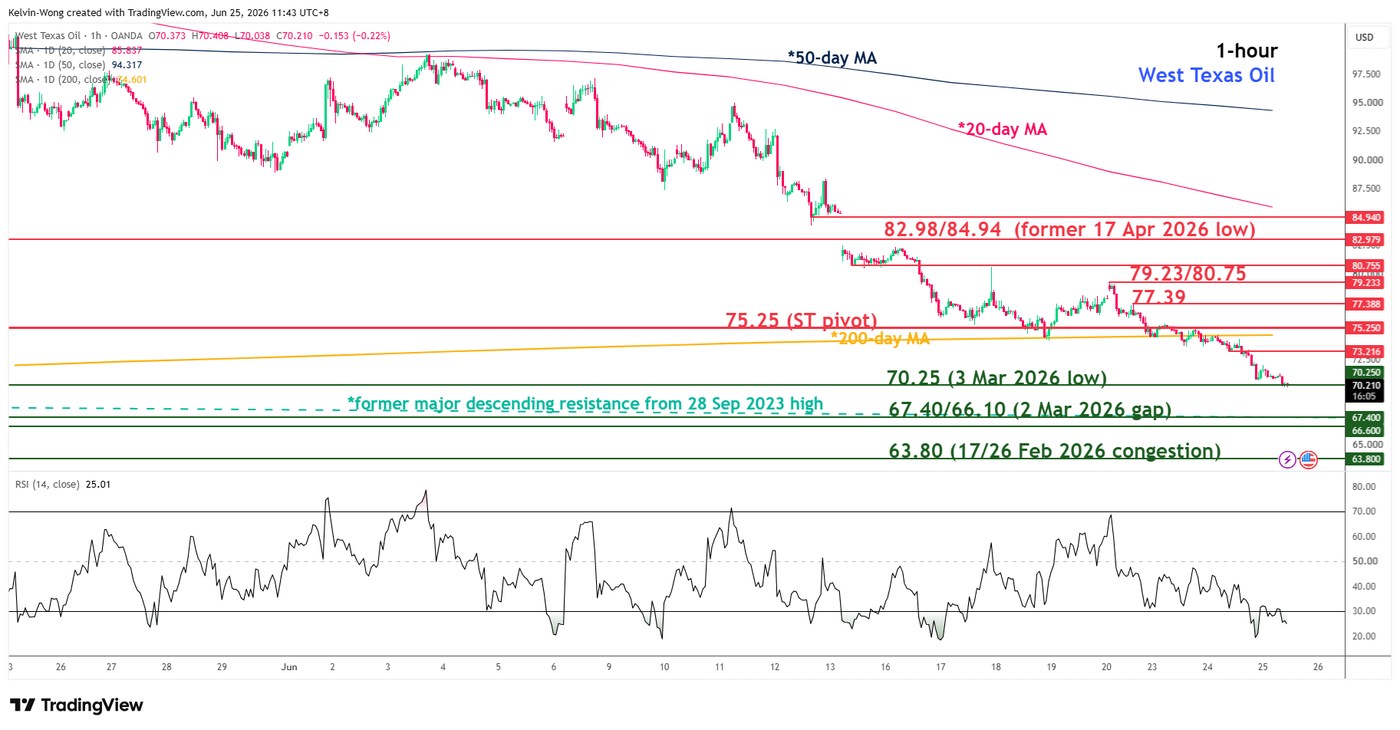
The ongoing 4-week weakness in the price action of the West Texas Oil CFD (a proxy for WTI crude oil futures) since the 18 May 2025 high of $109.74/bbl culminated in a bearish breakdown of its key 200-day moving average on Wednesday, 24 June 2026.
The further deterioration in the technical structure of the West Texas Oil CFD reinforces at least a near-term weakness in oil prices.
Watch the $75.25/bbl key short-term pivotal resistance for a potential further drop, exposing the next intermediate supports at $67.40/66.10 and $63.80 (see Fig. 1).
However, a clearance above $75.25 invalidates the bearish scenario, opening the door to a minor corrective rebound towards the next intermediate resistances at $77.39 and $79.23/80.75.
Top macro headlines
- Micron smashes estimates with blockbuster Q3 results and bullish AI outlook: Micron Technology Inc. delivered a monumental fiscal third-quarter earnings beat after the close. Driven by insatiable generative AI demand for high-bandwidth memory (HBM) and data-centre DRAM, the chipmaker guided Q4 revenues to an unprecedented $50 billion (plus or minus $1 billion), sending its stock soaring over 15% in extended trading and reinflating the broader tech complex, in turn, triggering a recovery of 1.5% on the Nasdaq 100 E-mini futures in today’s Asian session.
- Wall Street Finished mixed in the regular session before an after-hours tech surge: Before Micron’s earnings release, major U.S. indexes exhibited highly fragmented behaviour as investors balanced stretched megacap tech multiples against cyclical value plays. The S&P 500 closed down a minor 0.1% to settle at 7,358, and the tech-heavy Nasdaq 100 slid 0.4% to finish at 29,220. Conversely, the Dow Jones Industrial Average gained 182.06 points (0.4%) to close at 51,854, supported by rotation into financials and homebuilders.
- Crude slumps beneath $78 as Strait of Hormuz transit normalisation deepens: Energy futures contracts extended their downward path as maritime shipping telemetry confirmed that commercial vessels have normalised transits through the Persian Gulf bottleneck. The formal operationalisation of the US-Iran 60-day roadmap and associated temporary petroleum export waivers triggered broad systemic liquidations of long hedges, pushing front-month Brent futures toward $73.38/bbl (-4.8%) and WTI to settle at $69.87/bbl (-4.4%), unwinding the structural war premium.
- Gold slumps 2.7% to test psychological floors amid aggressive yield pressures: Spot gold experienced a sharp rout, declining 2.7% to settle a whisker below the key $4,000/oz psychological level at $3,999/oz on Wednesday, 24 June. The metal faced persistent liquidation pressure on its asset portfolios, with capital reallocated from yielding safe havens into nominal-yielding assets ahead of the highly anticipated US Personal Consumption Expenditures (PCE) price index release later today.
Key macro themes
- The structural separation of core AI demand from broad cyclical pressures: Micron Technology’s historic earnings and revenue print demonstrates a profound structural bifurcation within global capital expenditure. While traditional industrial proxies like FedEx are flashing signals of slowing global trade volumes and corporate margin compression, physical layer AI infrastructure remains entirely insulated. Because top-tier hyperscalers are fully booking advanced HBM nodes throughout calendar year 2027, chip demand behaves independently of baseline macroeconomic cycles, validating the multi-trillion-dollar valuation expansion across specialised hardware nodes.
- The transience of geopolitical risk premiums in commodity markets: The continued decline in international energy benchmarks underscores how quickly systemic trend-following funds will withdraw once physical supply paths normalise. The implementation of the US-Iran temporary waiver has converted localised anxieties about maritime scarcity into an immediate prompt-market inventory buffer. As crude contracts trade out of their war premium, the broader macro outlook gains an implicit shield against supply-side inflation, offsetting hawkish central bank liabilities.
- Intraday multiple compression followed by high-beta volatility release: The sharp regular-session profit-taking across Wall Street growth names, followed by Micron’s explosive 15% after-hours rally, illustrates the extreme sensitivity of modern financial markets to real-time information flow. Operating under a higher-for-longer baseline cost of capital, public equity indices are intensely compressing multiples during regular cash hours whenever concrete forward-looking data is absent. However, once a key structural anchor delivers a clean, undeniable demand beat, institutional capital rapidly re-enters high-beta growth ecosystems, compressing short positioning.
Global markets impact (last 24 hours)
Equities: Regular-session trading saw the S&P 500 edge down 0.1% and the Nasdaq-100 drop 0.4%. However, Micron’s massive post-market Q3 beat sent its shares up 15% to $1,213 in after-hours trading, triggering a wave of buying that lifted major semiconductor and hardware indices across the Asia-Pacific region. The Dow Jones (DJIA) added 0.4% during cash hours. The E-mini futures of the S&P 500 and Nasdaq 100 rebounded by 0.4% and 1.6% in today’s Asian session.
Fixed Income: Global bond curves experienced minor stabilisation. The short-duration US 2-year Treasury yield fluctuated near 4.15% while the benchmark US 10-year Treasury yield consolidated around 4.40%. Portfolios maintained a steady posture, adjusting for the upcoming sovereign note supply and highly anticipated US PCE inflation data out later today.
FX: The US Dollar Index (DXY) maintained its bullish tone, extending its gains by 0.2% to settle at 101.36, a 13-month high on Wednesday, 26 June. In the past 24 hours, the Australian and New Zealand dollars have been the weakest among the major currencies, dropping by 0.1% and 0.2% against the greenback to trade at 0.6893 and 0.5641 in today’s Asian session.
Commodities: Front-month Brent crude futures fell to $73.38/bbl as the normalisation of the Gulf shipping transit normalised localised risk premiums. In today’s Asian session, it extended its losses by 1.3% to $72.88/bbl, its lowest level since early March 2026.
Spot gold prices remained soft and extending its decline by 0.4% in today’s Asian session to trade at $3,981/oz intraday, a 7-month low, driven by capital shifting away from non-yielding hedges toward higher-yielding alternatives.
Asia Pacific impact
- Asian tech centres positioned for substantial rebound on Micron: The explosive after-hours performance of Micron is set to trigger intensive upward tracking across North Asian electronics centres. South Korea’s chip heavyweights Samsung Electronics and SK Hynix, alongside Taiwan’s semiconductor giants, face significant upside momentum as the verified revenue records ease concerns about localised AI hardware spending limits. South Korea’s KOSPI (+6%), Taiwan’s TAIEX (+1%), Japan’s Nikkei 225 (+3.7%), China’s CSI 300 (+0.7%), Singapore’s STI (+0.2%). In contrast, Hong Kong’s Hang Seng Index (-1.1%) and Australia’s ASX 200 (-0.1%) underperformed.
- Yen consolidates extensively near multi-decade intervention floor: The Japanese yen remains under intense pressure against the greenback, pinning USD/JPY near 161.70, below a key major resistance at 161.95. Wide interest rate differentials continue to favour the US dollar, keeping Bank of Japan policy authorities highly vigilant for localised measures to smooth volatility if speculative yen dumping accelerates.
- Regional importers absorb lower near-term input energy outlays: Energy-dependent bourses across the APAC region continue to capture real-time current-account benefits from the downward trend in Brent crude prices, lowering input costs for raw manufacturing materials and softening the immediate impact of local currency depreciation against the broad-based strength of the US dollar.
Top 3 economic releases/events to watch today
- Germany GfK Consumer Confidence (Jul) - 2:00 pm SGT (consensus: -27.6, Jun: -29.8) Impact: EUR/USD, EUR crosses, DAX
- US Core PCE Inflation Index (May) - 8:30 pm (SGT) (consensus: 3.4% y/y, Apr: 3.3% y/y) Impact: All asset classes
- Fed Speak (Williams) - Friday, 3:40 am (SGT) Impact: USD, shorter-term US Treasuries, US stock indices
Silver Breaks Below $60, Can $50 Hold?
The battle in Silver has entered a far more important stage. Breaking below $60 is psychologically significant, but the market's attention is already shifting to another level roughly ten dollars lower. Around $50 sits one of the strongest combinations of technical and fundamental support on Silver's chart. Whether that area survives the current wave of selling is now the center of focus.
The immediate culprit is the Dollar. As markets become increasingly convinced that the Federal Reserve is returning to tightening, capital has continued flowing into the Greenback at the expense of precious metals. The debate has evolved rapidly over the past week. Deutsche Bank now expects two Fed rate hikes this year, in September and December. BofA has gone even further, forecasting hikes in September, October and December, making it the most hawkish major Wall Street house. Even though both banks expect the Fed to pause throughout 2027, the prospect of several more hikes this year has been enough to send Dollar sharply higher and precious metals sharply lower.
The Case for $50 Holding
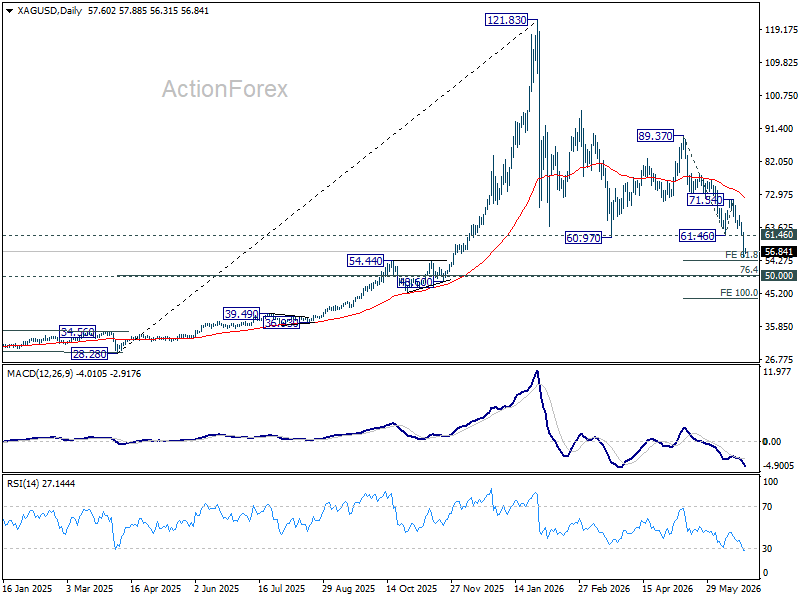
For Silver, attention is rapidly shifting from the break below $60 to whether the much more important $50 area can withstand the current selling pressure. From a technical angle, there is a compelling argument that it should. The region lies within the fourth-wave consolidation (48.60 to 54.44) of the five-wave advance from the 2025 low at 28.28 to the record high at 121.83. It also coincides closely with the 76.4% retracement of that rally at 50.35, creating an important cluster of long-term support.
Fundamentally, Silver also enjoys an advantage that Gold does not. While both metals are suffering from higher real yields and a stronger Dollar, Silver remains a critical industrial commodity. The market is expected to record a sixth consecutive annual structural supply deficit, while demand from AI data-center construction, electric vehicles and renewable energy projects continues to provide longer-term support. Those structural drivers suggest buyers could emerge around the $50 area even if prices briefly trade below that level.
The Risks to the $50 Floor
However, downside risks remain significant. Gold has already broken below the key $4,000 psychological threshold for the first time since late last year, and further weakness there would likely drag the entire precious metals complex lower. In addition, a sharper-than-expected slowdown in global growth caused by tighter Fed policy could erode Silver's industrial demand premium. In a hard-landing scenario, Silver could behave more like base metals such as copper and zinc than a traditional precious metal.
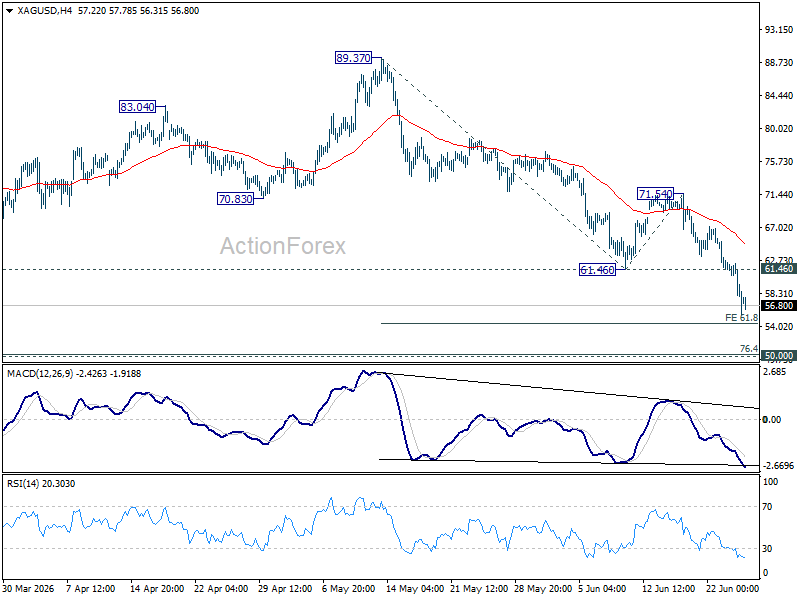
Technically, next near term target for Silver is 61.8% projection of 89.37 to 61.46 from 71.54 at 54.29. Selling pressure may begin to moderate below that level as bargain hunters return, potentially establishing a medium-term trading range between 50 support and the former support at 61.46, now resistance.
But if downside momentum accelerates through 54.29 and ultimately breaks the 50 support cluster decisively, the 100% projection at $43.63 would come firmly into view, signaling that the longer-term correction has entered a much deeper phase.
BoJ’s Tamura Lays Out Tightening Roadmap to 2%
Bank of Japan board member Naoki Tamura laid out his clearest roadmap yet for further policy normalization on Thursday, saying the central bank's baseline should be to raise interest rates by 25 basis points every few months until the policy rate reaches around 2%, which he views as a neutral level. Tamura said, "what I envisage as a baseline path is raising the policy interest rate by 0.25 percentage points at intervals of a few months toward the neutral interest rate level of 2 percent," highlighting the BoJ's increasingly hawkish stance following last week's rate hike to 1.0%.
Tamura argued that inflation risks have become more pronounced, with underlying inflation already reaching the Bank's 2% target and inflation expectations continuing to rise. He noted that companies are passing on higher import costs "more quickly, significantly and broadly" than after Russia's invasion of Ukraine in 2022, reflecting a structural shift in corporate pricing behavior. While the conflict in the Middle East has contributed to higher energy costs, he stressed that upside inflation risks warrant attention regardless of how the geopolitical situation evolves.
Tamura also left the door open to a faster pace of tightening if inflation pressures prove more persistent. "If the chance of upside price risks materializing heightens, it's necessary to accelerate the pace of rate hikes without hesitation by increasing the frequency or size of rate hikes," he said. Although Tamura is widely regarded as one of the BoJ's most hawkish policymakers, his remarks reinforce the message from last week's policy meeting and Wednesday's Summary of Opinions that the debate within the Board has shifted firmly toward how quickly, rather than whether, rates should continue moving higher.
Australia Employment Beats Forecasts, But April Revision Tempers Strength
Australia's labor market rebounded in May, with employment rising by 40.3k, above expectations of a 30.5k increase, while the unemployment rate edged down from 4.5% to 4.4% as expected. The participation rate also ticked higher from 66.6% to 66.7%, pointing to resilience in labor supply. However, the headline gain was partly offset by a sharp downward revision to April's figures, with the previously reported -18.6k decline revised to a much steeper -40.7k contraction.
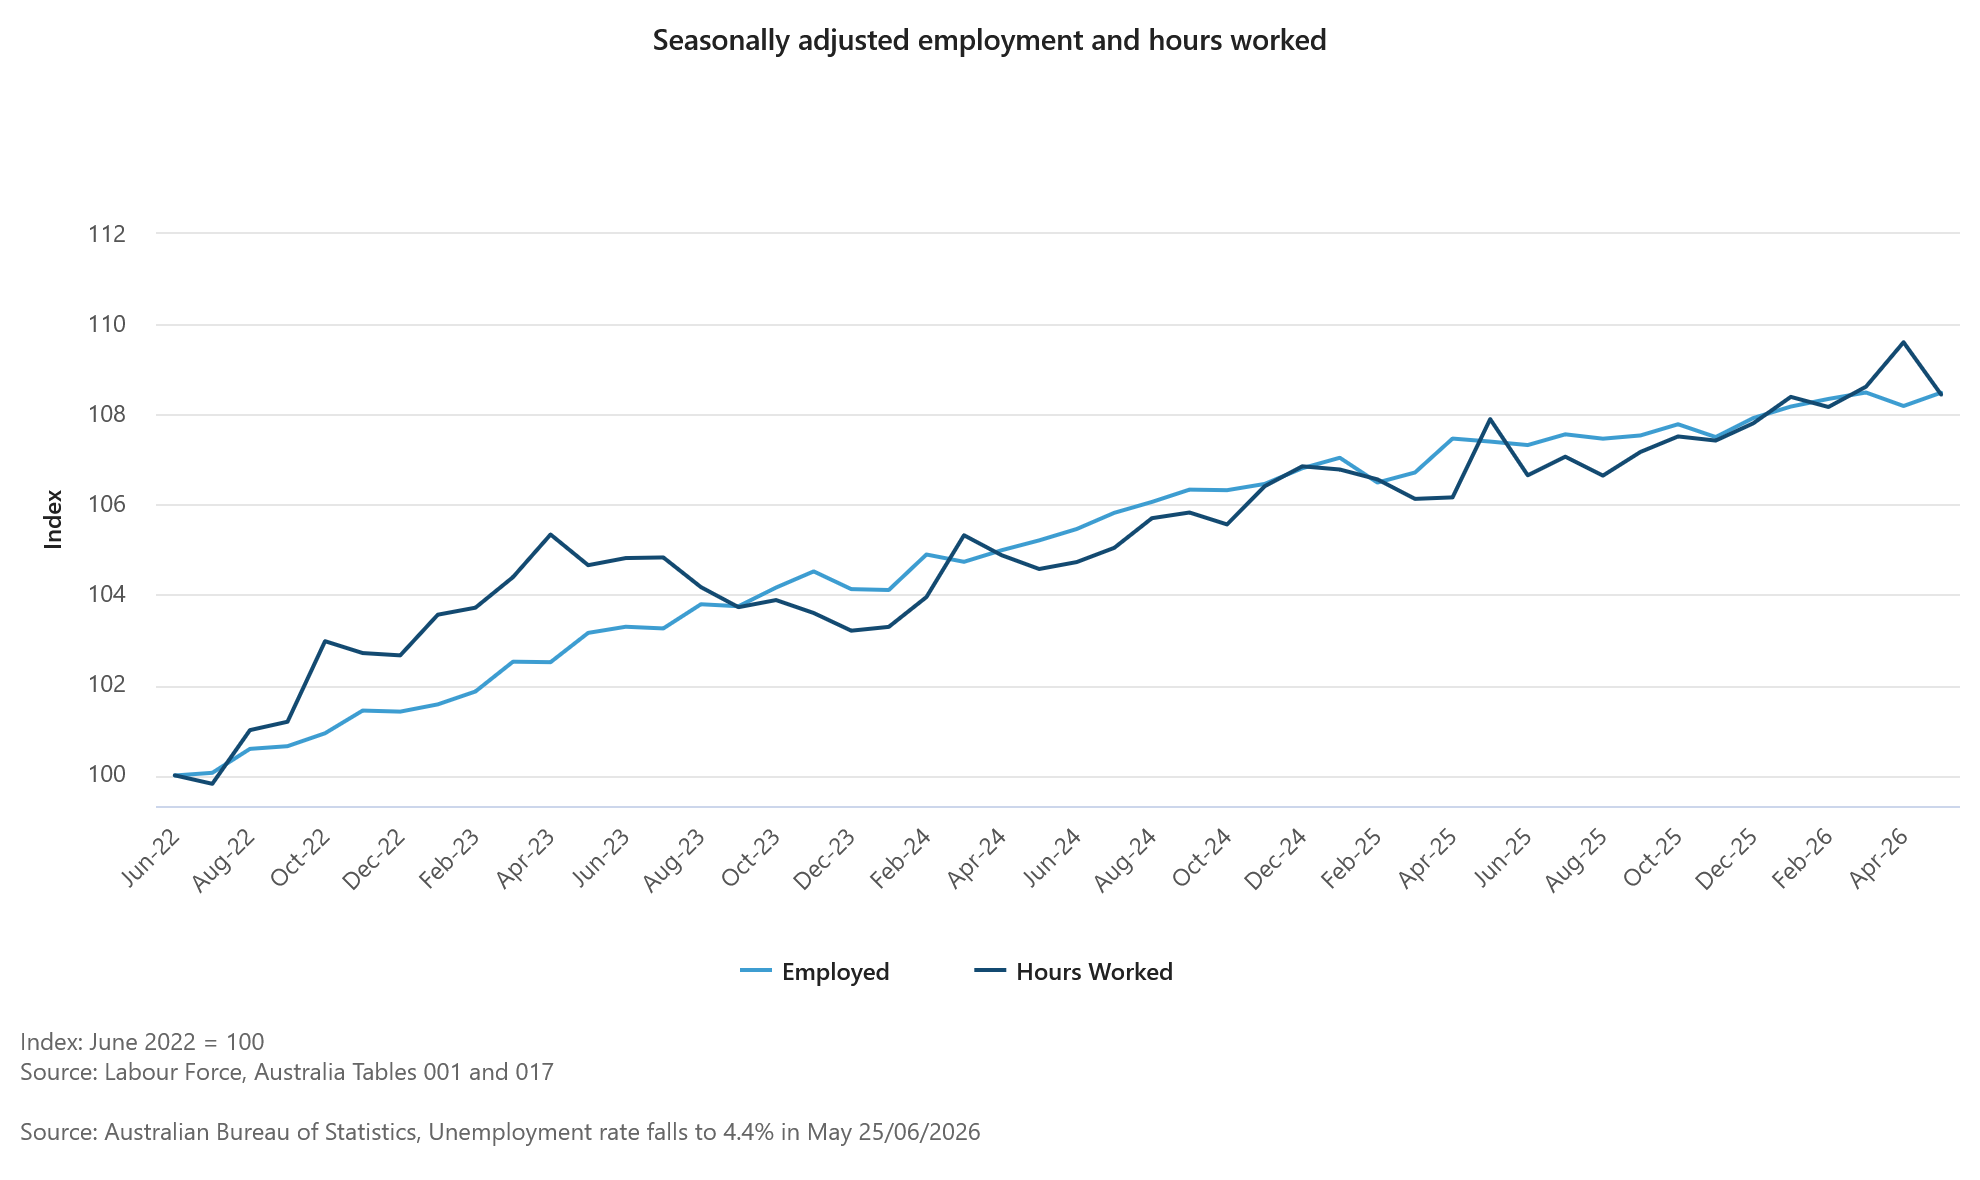
The composition of employment growth was also mixed. Full-time employment increased by just 5k, while part-time positions accounted for the bulk of the recovery with a 35k gain. Meanwhile, monthly hours worked fell -1.1% mom after rising 0.9% mom in April, suggesting overall labor demand was softer than the headline employment figures alone might indicate.
ABS head of labor statistics Sean Crick said the rebound reflected an easing in the backlog of unemployed people waiting to start new jobs. "Over the past few months, we have recorded higher proportions of unemployed people waiting to start jobs who then remained unemployed in the following month," he said. "The backlog of people waiting to start a job has eased in May, contributing to the 40,000 rise in employment and 18,000 fall in unemployed persons."
Crick also noted that April's unusually strong hours worked reflected fewer people taking Easter leave, with May's decline bringing hours worked "back in line with employment growth since the end of the pandemic in June 2022."
Overall, the report suggests the labor market remains relatively resilient, but softer hours worked and the large revision to April may temper expectations of a significantly stronger labor market.
Data Summary Table
| Indicator | April | May | Expectation |
|---|---|---|---|
| Employment Change | -40.7k (revised from -18.6k) |
+40.3k | +30.5k |
| Unemployment Rate | 4.5% | 4.4% | 4.4% |
| Participation Rate | 66.6% | 66.7% | |
| Monthly Hours Worked | +0.9% m/m | -1.1% m/m |
Employment Breakdown
| Category | May Outcome |
|---|---|
| Total Employment | +40.3k |
| Full-time Jobs | +5.0k |
| Part-time Jobs | +35.0k |
| Unemployed Persons | -18.0k |
| Participation Rate | Increased to 66.7% |
Back to the Future: RBNZ to Scale Back OCR Hikes as Energy Price Worries Recede
- Recent developments mean that the RBNZ's outlook for the OCR has likely moved back towards that forecast in the February MPS.
- We are similarly updating our forecasts to reflect the unexpectedly quick resolution of the Iran conflict and associated significant decline in the price of oil and refined fuels prices and related commodities.
- We now see headline inflation peaking at 4.0% in the June quarter this year and ending 2026 at 3.5% - possibly lower if the most recent fall in oil prices is sustained.
- We have marked up our 2026 GDP growth forecast to 2.0% from 1.5% previously, although this remains lower than our pre-war forecast.
- We affirm our view that the OCR will be held at 2.25% at the upcoming 8 July meeting. Indeed, we expect this decision to be far less contentious than in May, and don't rule out that this decision is made by consensus and so without a vote.
- We also affirm our view that the RBNZ will begin to tighten at the September MPS. However, beyond September, we now expect just one further tightening this year - rather than two - which will probably occur at the December MPS meeting.
- Relative to pre-conflict forecasts made by both Westpac and the RBNZ, this implies one extra OCR increase in 2026. This is justified by the more elevated path for inflation relative to that expected in early 2026.
- We have reduced the forecast peak in the OCR to 4% and thus retain the same pattern of OCR changes through 2027. A lower peak OCR is consistent with the smaller and shorter duration oil related supply shock now assumed.
- There are two-sided risks around this profile that depend on how quickly the economy recovers through the second half of 2026 and the pace at which underlying inflation pressures recede.
- Downside risks persist for the New Zealand dollar as interest rate differentials are likely to weigh on the exchange rate given much higher US and Australian policy rates. We will review our FX forecasts next month in the July Market Outlook produced jointly with our Australian colleagues.
A Revised Economic Outlook Is Warranted
A great deal has changed since early May when we last reviewed our forecasts for the global and domestic economies - more than the market appears to have appreciated considering the continued pricing of a RBNZ rate hike at next month's policy review. The key issue has been the unexpectedly quick progress on reducing Persian Gulf tensions and the potential for a faster return of shipping flows in the Strait of Hormuz, with resultant improvements in trade flows of oil, petrochemical products and natural gas, as well as a range of other key products (such as fertiliser).
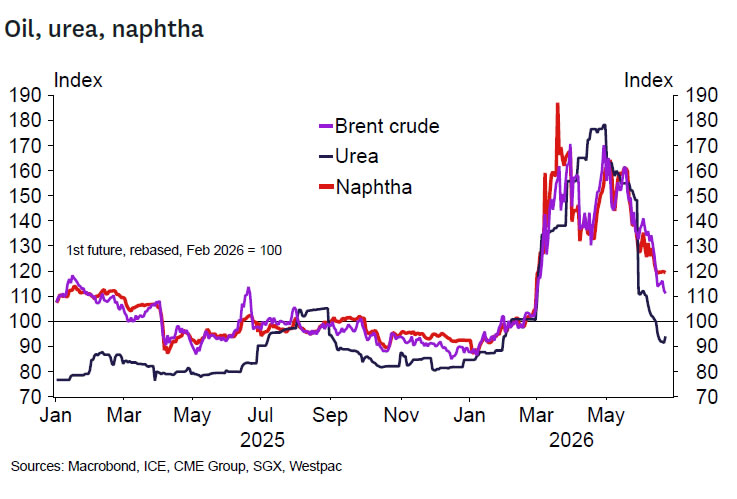
While it is premature to conclude that tensions in the region will be durably settled, there are sufficient signs that diplomatic efforts are well underway such that a decent period of ceasefire and more normal shipping flows is in prospect. Hence, it's appropriate to incorporate this new information into our New Zealand macroeconomic view.
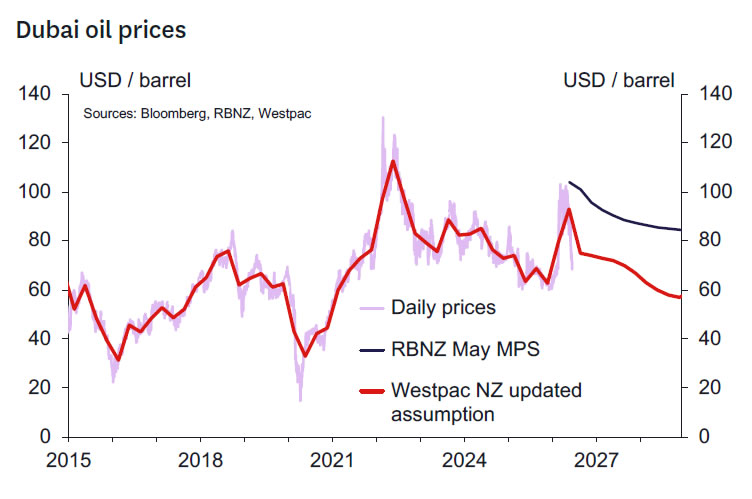
The key updates to our assumptions relate to the assumed level and future path for oil and refined fuels prices. These have converged much more rapidly than expected to levels we previously didn't expect to see until mid-2027. Brent crude oil is currently trading around US $73/bbl, close to the levels we saw prior to the war. We expect that prices will ease further over 2027 to $69/bbl. Refined fuels prices have been easing more gradually, but have still fallen substantially from a peak of US $195 bbl in March to US $110 bbl at the time of writing (vs around US $92/bbl prior to the war). Refined fuel prices are expected to continue easing back over the coming months, falling to US $102 bbl by the end of this year and US $90 bbl by the end of 2027.
Importantly, oil prices are now much lower than the RBNZ assumed in the May forecasts.
We have also accounted for recent economic data on GDP, selected price indices, and other higher frequency data on output when reviewing our economic view. We have not reviewed our global economic forecasts, or the exchange rate forecasts (aside from updating the starting point for the exchange rate) as these will next be reviewed, in conjunction with our Australian colleagues when we prepare our July Market Outlook publication forecasts.
We also have not included the implications of the new fiscal position revealed in Budget 26. Having said that we think the implications are likely modest and will be fully incorporated into our forecasts when we prepare our next Economic Overview in late August.
GDP Growth - Recovery to Resume Sooner
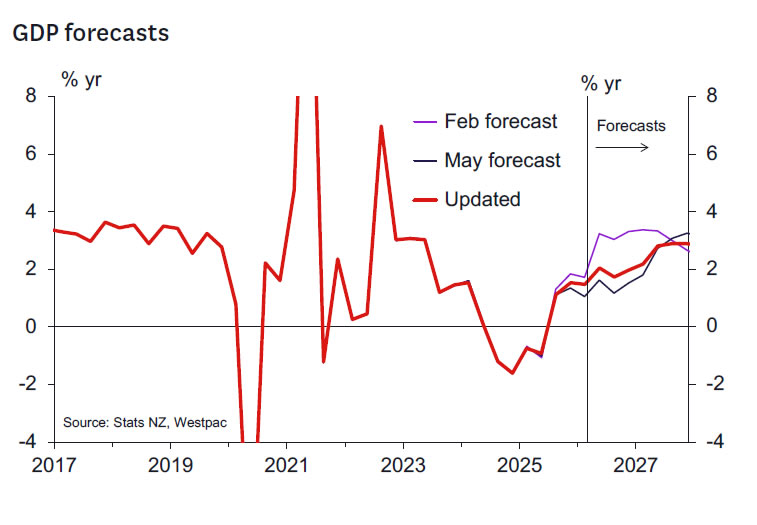
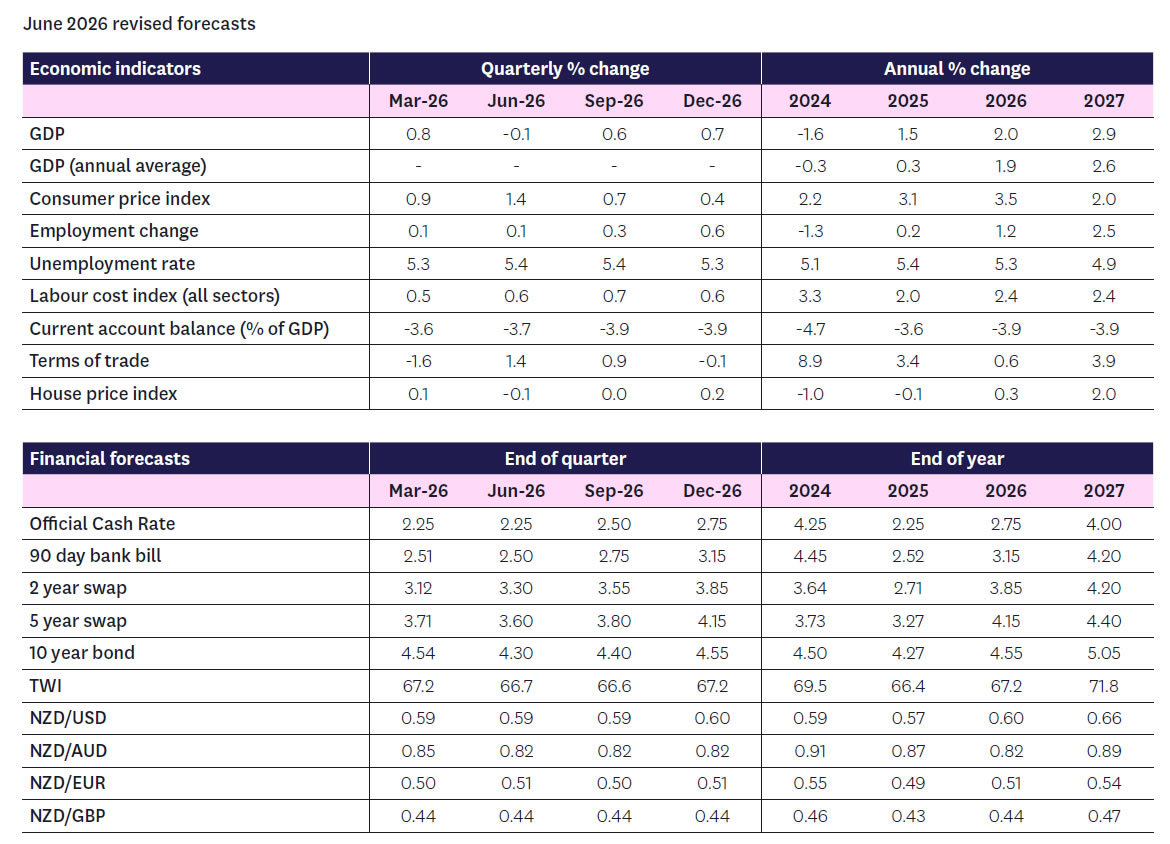
We have upgraded our GDP forecasts for both the June quarter - the peak of the oil shock impact - and over the second half of this year. Much of this reflects a bringing-forward of the timing of the economy's recovery as the oil shock fades, so we now expect a slightly slower rate of growth through 2027. GDP growth for 2026 is now forecast to be 2% and 2.9% in 2027.
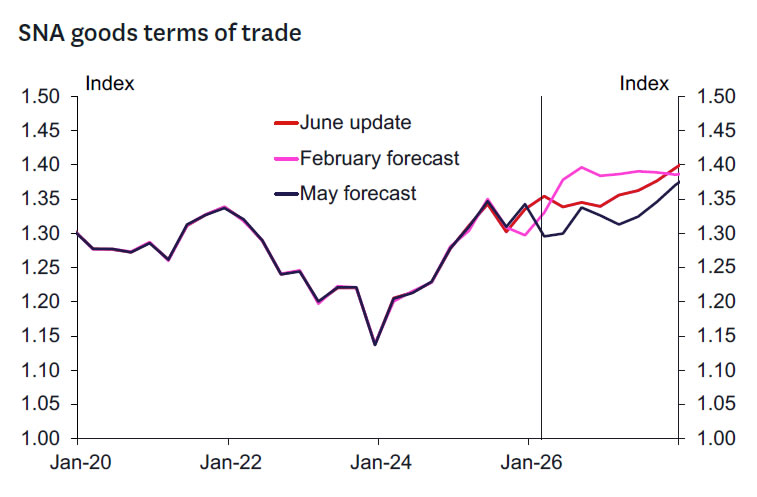
A review of the most recent data suggests that the economy held its ground through the peak of the oil price shock in April and May, faring a bit better than we had assumed in our last forecast update. We now expect GDP to fall by just 0.1% for the June quarter, from our previous forecast of -0.3%.
We should note that both forecasts include an allowance for the seasonal distortions that remain an issue in the GDP data. Our new forecast implies an underlying growth pace of around +0.2%, with seasonal factors knocking 0.3% off the reported result.
With oil prices receding faster than we'd assumed, the economy is set to resume its pre-conflict recovery path sooner as well. We expect quarterly growth to pick up to 0.6% and 0.7% in the September and December quarters, from 0.4% and 0.6% previously. Altogether that would see the economy grow by 2.0% over the course of this year, compared to our previous forecast of 1.5%. That's still some way below the 3.3% growth that we were expecting this year prior to the Iran conflict, which will still prove to be a significant setback to the momentum that was otherwise building in the economy.
Labour Market - Hiring to Resume
With a stronger GDP outlook for this year, we now expect a lower peak and a quicker turnaround in the unemployment rate over the next year. We still expect some softness in the jobs market in the near term - the uncertainty generated by the Iran conflict has likely led some businesses to hold off on hiring decisions. The high-frequency jobs data so far suggests that we're on track for flat rather than falling employment over the June quarter. But that won't be enough to absorb the growth in the working-age population, so we expect to see the unemployment rate tick up again to 5.4% after having eased to 5.3% in the March quarter.
Beyond that though, we see less risk of a further rise in unemployment over the coming quarters. Our forecast now peaks at 5.4% through the middle part of this year, easing to 5.3% by year-end and 4.9% by the end of 2027 (the latter forecast is unchanged).
Housing - Still Moving Sideways
We have revised up modestly our forecasts for house price growth in 2026. Recent house price data confirms a flat profile for house prices in recent months and a similarly flat path for the days to sell a property. Looking forward, we anticipate a mildly more positive tone to return to the market as consumer and business sentiment improves with falling energy prices. Previously we had thought we might see a relatively weak outcome for September quarter house prices, but now it seems more like a flat outcome is closer to the mark. Weaker expectations for RBNZ OCR hikes have translated through to lower mortgage rates in recent weeks which should also assist sentiment.
We now expect very modest house price growth of 0.6% in 2026 (previously we expected a modest 1% fall). We still expect prices to rise by 2% over 2027. We continue to expect house prices in the regions to outperform those in the major North Island urban centres as it will take some time for the services sector to pick up and the labour market to strengthen to the point where we see a decent fall in the unemployment rate (now forecast to begin late in 2026 and picking up pace through 2027).
Inflation - Lower Peak, Quicker Reduction
In response to the faster than expected fall in oil prices, we have pulled down our inflation forecasts. We now expect that annual inflation will peak at 4.0% in the June quarter (down from the peak of 4.5% we assumed in our May forecasts), slowing to 3.5% in the December quarter - possibly lower if oil prices remain as low as they are today. That would be well below the 4.1% rate the RBNZ assumed for year-end inflation in its recent May MPS projections.
The earlier than expected fall in global oil prices has already flowed through to lower prices at the pump for New Zealand consumers. The average price of 91 unleaded around the country has fallen to $3.02/ltr (down nearly $0.50/ltr from its peak in May), while diesel has fallen to $2.56 (down more than $1/ltr). Further price falls are likely given current spot energy prices. Those lower oil prices have directly shaved about 0.5ppts off our year-end inflation forecasts.
We have also dialled back assumed second round inflation effects reflecting the smaller and shorter duration cost shock. That's taken about 0.2ppts off our inflation forecasts. We retain around 50% of the second-round effects included in previous CPI forecasts as although oil prices have fallen substantially, they are still well above the levels we saw prior to the conflict. We will review these estimates as we receive more definitive CPI data in coming quarters.
More generally, we think that subdued demand has constrained how far many businesses have been able to raise their prices despite increases in operating costs.
Looking to 2027, inflation is expected to drop back as the impact of the oil price shock dissipates. Indeed, given base effects associated with this year's oil shock, headline inflation will briefly dip below 2% in 2027, before rising as the economy recovers.
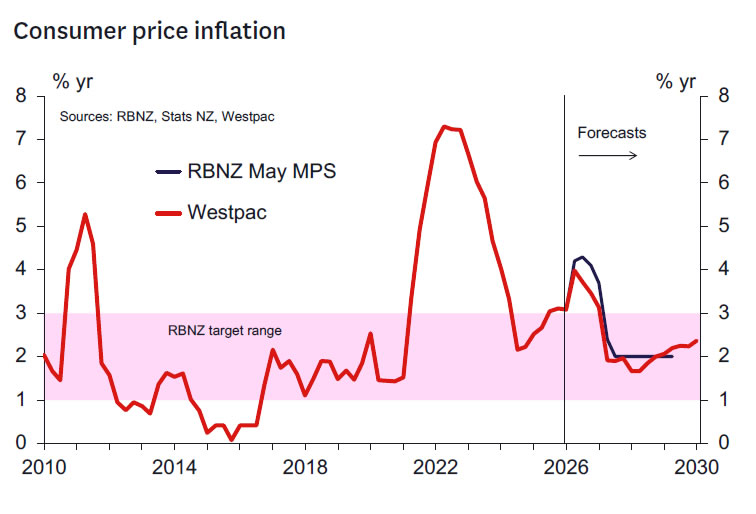
Smoothing through the volatility associated with fuel prices, core inflation has lingered at firm levels over the past few years despite the softness in economic activity. The average of the RBNZ's suite of core inflation measures sat at 2.3% in the March quarter. Inflation excluding food and fuel prices, is currently around 3% and it is expected to linger close to the top of the RBNZ target band for the remainder of this year, before easing over 2027.
Monetary Policy - Less Urgency Required
Our forecasts imply the RBNZ's outlook for the OCR will likely move back towards the economic outlook envisioned back at the February MPS (when the Bank expected at most one 25bp hike this year). This would imply much less urgency to raise the OCR compared to the view in the May MPS (which had assumed two to three 25bps hikes this year).
The key question is: just how far will the RBNZ have moved? We think it reasonable that the RBNZ will likely have taken at least one 25bp hike out of its internal projections and will likely now be projecting one to two 25bp OCR hikes this year. Hence, we don't think the RBNZ will have reverted all the way back to its pre-Iran war views - in part because the inflation outlook remains significantly elevated for a while yet relative to what the RBNZ expected back in February. But nevertheless, the significant shift in circumstances since May should imply a significant shift in the forward stance.
So, what does this imply for the upcoming 8 July meeting? We think that the sharp fall in energy prices and the resulting improvement in the inflation outlook will have undermined the case for pre-emptive action. The hawks on the MPC may well still see a strong case for OCR increases this year but will likely be significantly comforted by the big change in the immediate inflation outlook as it must imply lower risks of persistently high inflation. At the least, the argument for moving earlier will look a lot weaker than back in May when those views were ultimately outweighed by the dovish camp. There's a significant chance that the hawkish bloc opts for no change in the OCR in July while remaining open for OCR hikes later in 2026.
The more dovish MPC members that wanted to see more evidence of enduring second-round inflation impacts in May will likely have hardened their views. Indeed, with the key June CPI, labour market and QSBO reports all due between the RBNZ's July and September meetings, together with the next round of inflation expectations surveys, there seems little to be lost in waiting to see what these key reports reveal (and to see whether the current US-Iran negotiations progress to a durable final deal). We don't think we have learned much about the extent of second-round inflation impacts since May aside from the fact that the short-term inflation outlook now looks far less threatening than then. And of course, there is more tangible evidence the economy stalled in the June quarter (the RBNZ's June quarter Nowcast indicates flat Q2 growth). Looking ahead, as discussed previously, there are likely good reasons to expect a stronger H2 2026 growth performance than felt back in May, but this is likely to still need to be confirmed by data and still likely to be far weaker than hoped for in early 2026 when even then just one OCR hike for 2026 was said to be on the cards. We don't think that any of the doves are likely to want to shift camp to the hawk's side in the July meeting.
A key argument market participants seem to rely on is the sense that the RBNZ may have almost promised a July hike back in May. We don't think this is accurate as the MPC will always fiercely note that any forward guidance on the OCR will be data dependent. We understand that mathematically, the RBNZ May forecast for an average OCR for the September 2026 quarter at 2.51% seems consistent with a July hike. But this will not have been a non-data dependent promise. In most cases, the RBNZ's short term OCR forecasts provide broad guidance on the likely direction of the OCR rather than a definitive forecast and have historically proven to be a poor guide to the next policy decision. More importantly, the Governor's words when describing the outlook are likely to be more prescient. The Governor noted that an increase in the OCR seemed likely "in coming meetings" - this is not a promise of an OCR increase in July. This is rather an expression of the intention to lift the OCR later in the year - and even that intention will (and should!) be data dependent.
Therefore, we affirm our view that the RBNZ will hold the OCR at 2.25% at the 8 July meeting. In fact, we expect this to be far less contentious than the May decision, and do not rule out the possibility that this decision is reached by consensus and so without a vote.
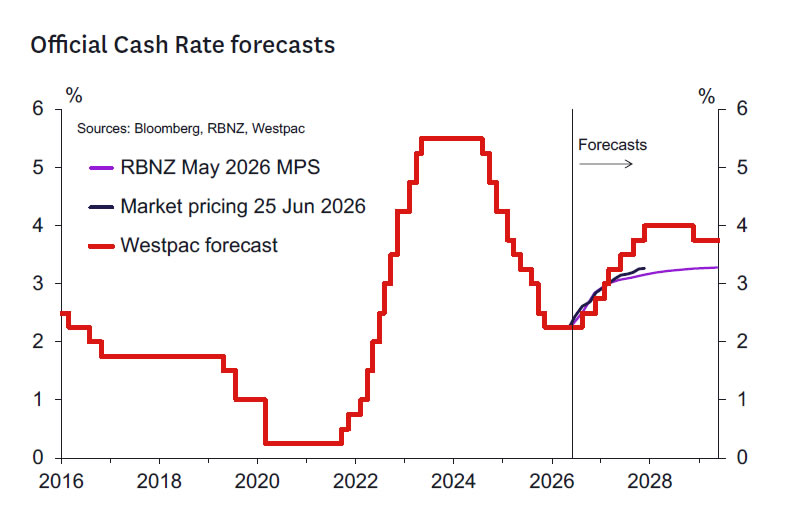
Looking beyond July, it remains reasonable to expect the RBNZ to tentatively begin lifting the OCR at the September MPS meeting and move again once more towards neutral settings before the end of the year - most probably at the December MPS meeting. But even these forecasts are not a slam dunk and have two-sided risks. Should the June quarter CPI provide benign in terms of core inflation measures then the RBNZ could leave the OCR unchanged until December. If the CPI runs hot, then we could still see the three 25bp rate hikes that we forecast before today.
Our central view implies one fewer hike this year than we had forecast most recently but one more than we had forecast prior to the conflict. This is justified by the more elevated path for inflation relative to that expected in early 2026. We have retained the same OCR changes that we had previously forecast to occur in 2027 and so the OCR is now forecast to peak 25bps lower at 4.0%. A lower peak OCR is consistent with the smaller and shorter duration oil-related supply shock now assumed. Our view on the neutral OCR remains at 3.75%.
In this update we have made no change to our FX forecasts. Downside risks persist for the New Zealand dollar as interest rate differentials are likely to weigh on the exchange rate given much higher US and Australian policy rates. We will review our FX forecasts next month in the July Market Outlook produced jointly with our Australian colleagues.
GBP/USD Back on the Defensive as US GDP Looms Large
Key Highlights
- GBP/USD extended losses and traded below 1.3200.
- The bears might remain active near 1.3200 and 1.3250 on the 4-hour chart.
- Gold prices declined sharply to a new multi-week low below $4,000.
- The US GDP could grow by 1.6% in Q1 2026.
GBP/USD Technical Analysis
The British Pound faced rejection near 1.3275 against the US Dollar. GBP/USD reacted to the downside and traded below 1.3200.
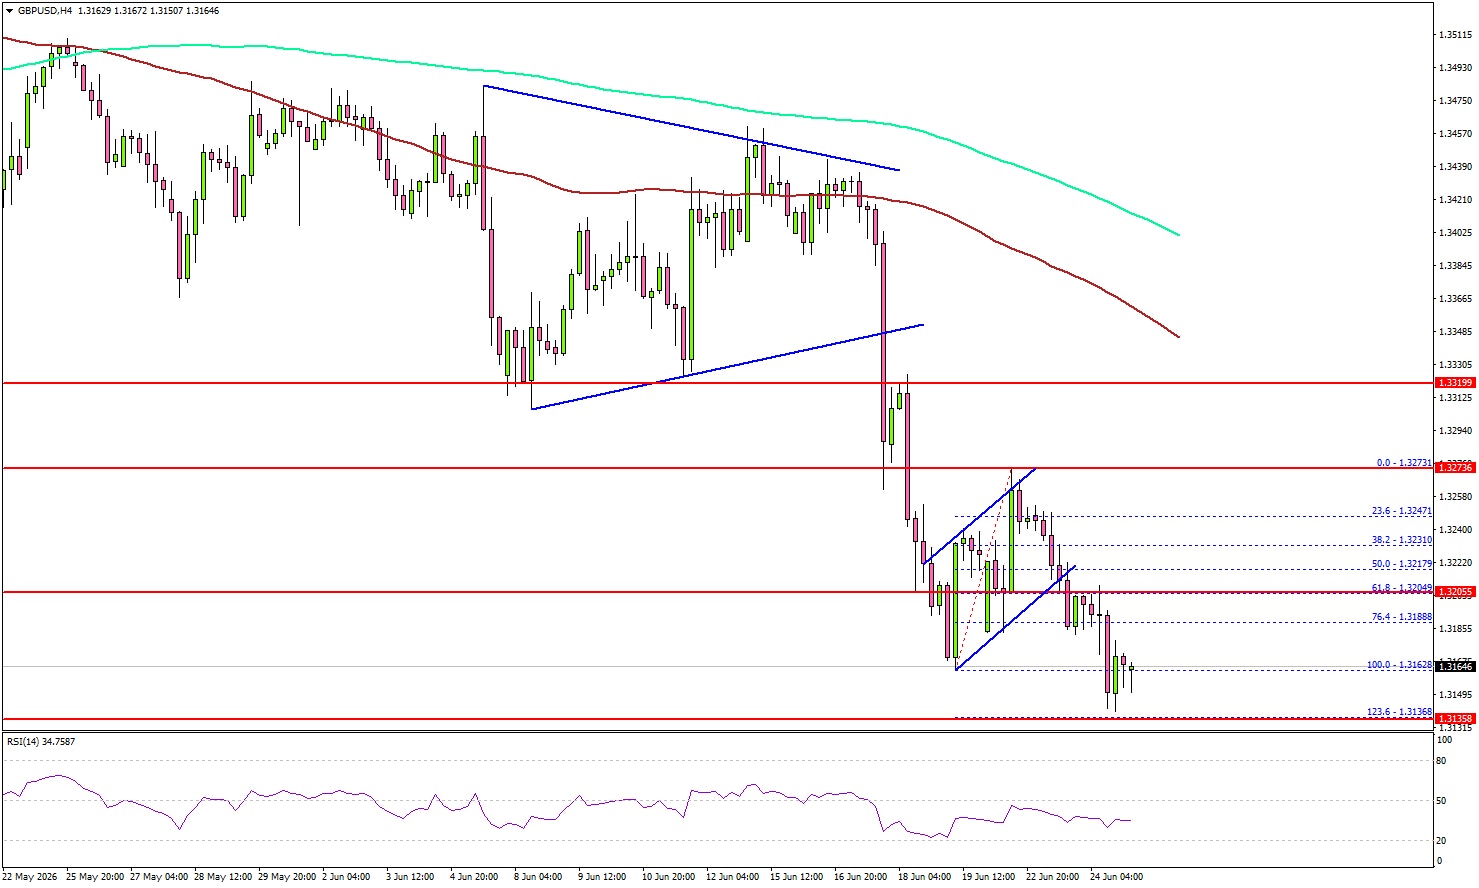
Looking at the 4-hour chart, the pair settled below 1.3200, the 100 simple moving average (red, 4-hour), and the 200 simple moving average (green, 4-hour). The bears even pushed the pair to a new multi-week low below 1.3150.
The greenback seems to be gaining strength ahead of the US GDP data. If the bears remain in action, the pair could dip further below 1.3120.
The first major support could be near 1.3050. The main support might be 1.3000. A downside break and close below 1.3000 might spark bearish moves. In the mentioned case, the bears could aim for a test of 1.2880.
If there is a recovery wave, GBP/USD could face resistance at 1.3200. The next major resistance might be 1.3250. A close above 1.3250 could open the doors for a larger increase. In the stated case, the bulls could aim for a move to 1.3350.
Looking at Gold, the bears remained in action, pushed the price below $4,000, and might continue to pressure the market in the near term.
Upcoming Key Economic Events:
- US Gross Domestic Product for Q1 2026 – Forecast 1.6% versus previous 1.6%.
- US Personal Income for May 2026 (MoM) - Forecast +0.4%, versus 0% previous.
- US Initial Jobless Claims - Forecast 225K, versus 226K previous.
- US Durable Goods Orders for May 2026 – Forecast -4.3% versus +8.0% previous.
Platinum Wave Analysis
Platinum: ⬇️ Sell
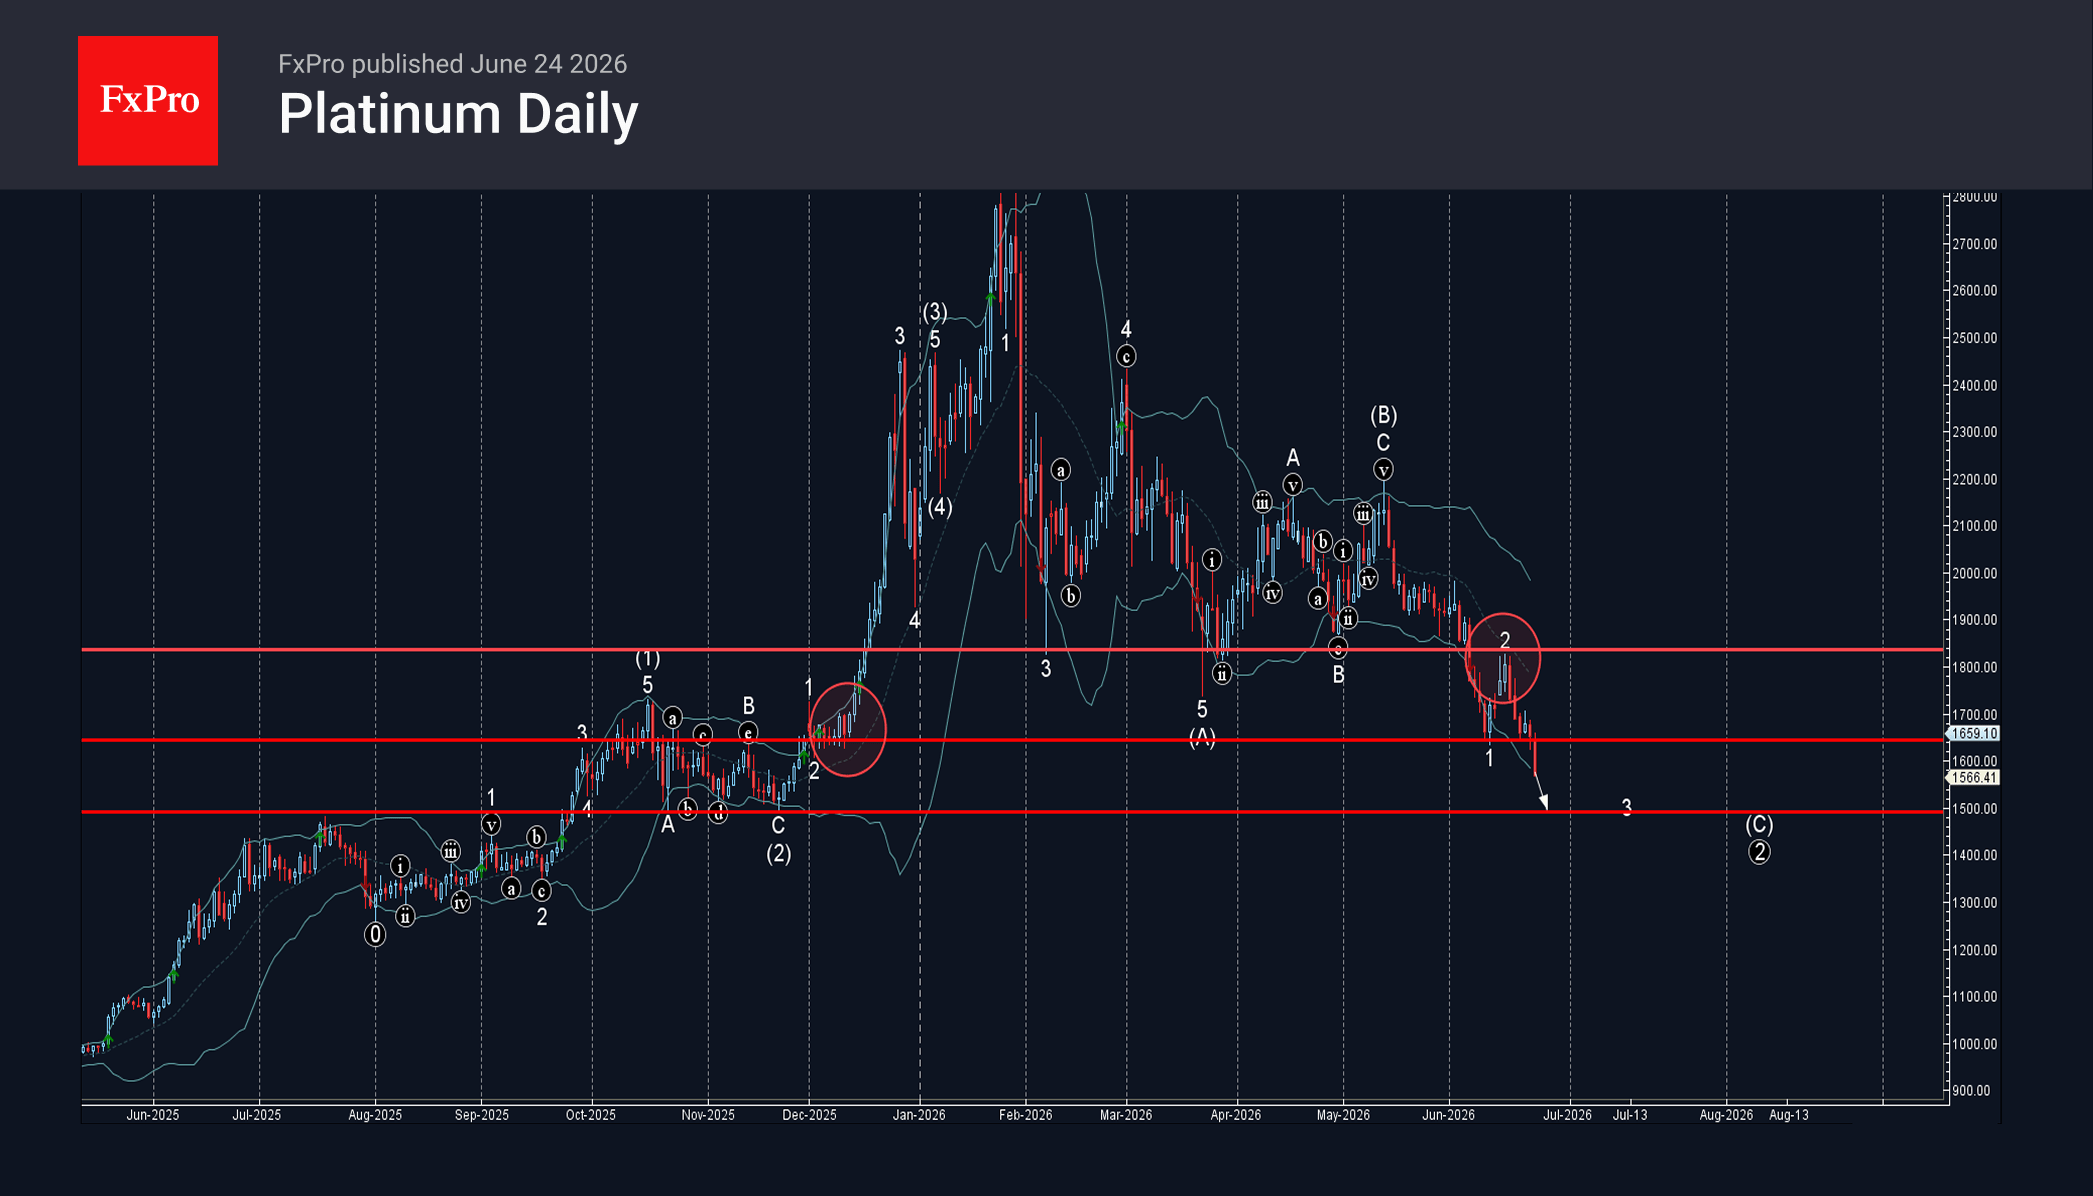
– Platinum broke support level 1645.00
– Likely to fall to support level 1500.00
Platinum under the bearish pressure after the earlier breakout of the support level 1645.00, which has been reversing the price from December.
The breakout of the support level 1645.00 continues the active minor impulse wave 3 of the higher impulse wave (C) from May.
Given the strong daily downtrend, Platinum can be expected to fall to the next major support level 1500.00 (target for the completion of wave 3), which has been revering the price from October.
WTI Crude Oil Wave Analysis
WTI Crude Oil: ⬇️ Sell
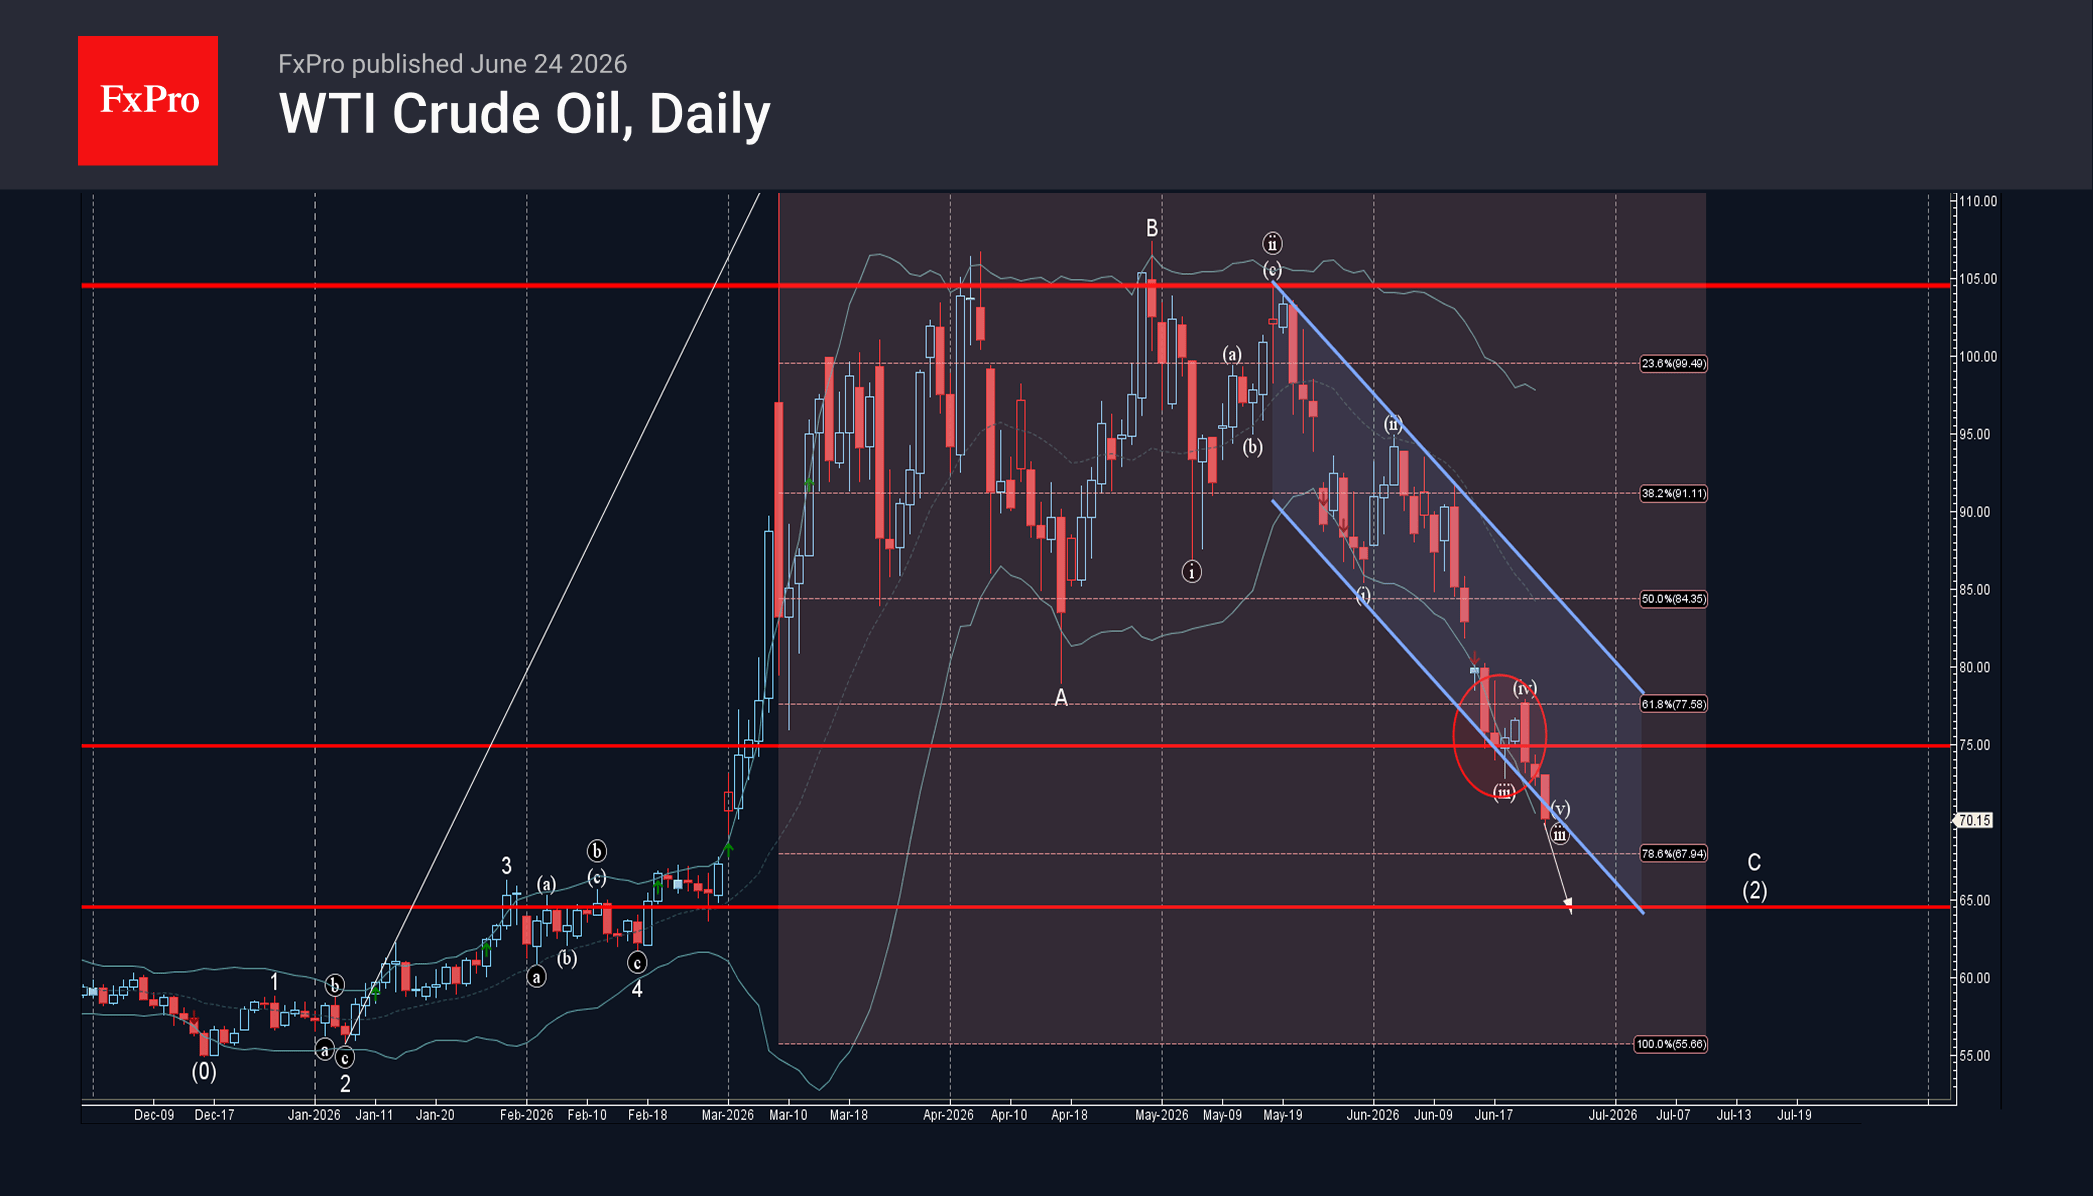
– WTI Crude Oil broke support level 75.00
– Likely to fall to support level 65.00
WTI Crude Oil recently broke the support zone between the support level 75.00, support trendline of the daily down channel from May and the 61.8% Fibonacci correction of the upward impulse from January.
The breakup of this support zone accelerated the active impulse wave C of the intermediate ABC correction (2) from March.
WTI Crude Oil can be expected to fall further to the next support level 65.00 (target for the completion of the active impulse wave C).
Eco Data 6/25/26
| GMT | Ccy | Events | Act | Cons | Prev | Rev |
|---|---|---|---|---|---|---|
| 01:30 | AUD | Employment Change May | 40.3K | 30.5K | -18.6K | -40.7K |
| 01:30 | AUD | Unemployment Rate May | 4.40% | 4.40% | 4.50% | |
| 06:00 | EUR | Germany GfK Consumer Confidence Jul | -29.2 | -28 | -29.8 | -29.7 |
| 12:30 | USD | Initial Jobless Claims (Jun 19) | 215K | 225K | 226K | 227K |
| 12:30 | USD | Personal Income M/M May | 0.70% | 0.40% | 0.00% | |
| 12:30 | USD | Personal Spending May | 0.70% | 0.60% | 0.50% | 0.40% |
| 12:30 | USD | PCE Price Index M/M May | 0.40% | 0.50% | 0.40% | |
| 12:30 | USD | PCE Price Index Y/Y May | 4.10% | 4.10% | 3.80% | |
| 12:30 | USD | Core PCE Price Index M/M May | 0.30% | 0.30% | 0.20% | |
| 12:30 | USD | Core PCE Price Index Y/Y May | 3.40% | 3.40% | 3.30% | |
| 12:30 | USD | Durable Goods Orders May | -4.50% | -4.70% | 8.00% | 8.50% |
| 12:30 | USD | Durable Goods Orders ex Transport May | 1.30% | 0.50% | 1.10% | 1.40% |
| 12:30 | USD | GDP Annualized Q1 F | 2.10% | 1.60% | 1.60% | |
| 12:30 | USD | GDP Price Index Q1 F | 3.60% | 3.50% | 3.50% | |
| 14:30 | USD | Natural Gas Storage (Jun 19) | 76B | 67B | 73B |
| 01:30 | AUD |
| Employment Change May | |
| Actual | 40.3K |
| Consensus | 30.5K |
| Previous | -18.6K |
| Revised | -40.7K |
| 01:30 | AUD |
| Unemployment Rate May | |
| Actual | 4.40% |
| Consensus | 4.40% |
| Previous | 4.50% |
| 06:00 | EUR |
| Germany GfK Consumer Confidence Jul | |
| Actual | -29.2 |
| Consensus | -28 |
| Previous | -29.8 |
| Revised | -29.7 |
| 12:30 | USD |
| Initial Jobless Claims (Jun 19) | |
| Actual | 215K |
| Consensus | 225K |
| Previous | 226K |
| Revised | 227K |
| 12:30 | USD |
| Personal Income M/M May | |
| Actual | 0.70% |
| Consensus | 0.40% |
| Previous | 0.00% |
| 12:30 | USD |
| Personal Spending May | |
| Actual | 0.70% |
| Consensus | 0.60% |
| Previous | 0.50% |
| Revised | 0.40% |
| 12:30 | USD |
| PCE Price Index M/M May | |
| Actual | 0.40% |
| Consensus | 0.50% |
| Previous | 0.40% |
| 12:30 | USD |
| PCE Price Index Y/Y May | |
| Actual | 4.10% |
| Consensus | 4.10% |
| Previous | 3.80% |
| 12:30 | USD |
| Core PCE Price Index M/M May | |
| Actual | 0.30% |
| Consensus | 0.30% |
| Previous | 0.20% |
| 12:30 | USD |
| Core PCE Price Index Y/Y May | |
| Actual | 3.40% |
| Consensus | 3.40% |
| Previous | 3.30% |
| 12:30 | USD |
| Durable Goods Orders May | |
| Actual | -4.50% |
| Consensus | -4.70% |
| Previous | 8.00% |
| Revised | 8.50% |
| 12:30 | USD |
| Durable Goods Orders ex Transport May | |
| Actual | 1.30% |
| Consensus | 0.50% |
| Previous | 1.10% |
| Revised | 1.40% |
| 12:30 | USD |
| GDP Annualized Q1 F | |
| Actual | 2.10% |
| Consensus | 1.60% |
| Previous | 1.60% |
| 12:30 | USD |
| GDP Price Index Q1 F | |
| Actual | 3.60% |
| Consensus | 3.50% |
| Previous | 3.50% |
| 14:30 | USD |
| Natural Gas Storage (Jun 19) | |
| Actual | 76B |
| Consensus | 67B |
| Previous | 73B |