

Sample Category Title
Brent Oil Falls to Pre-War Levels as Supply Normalization Provides Relief
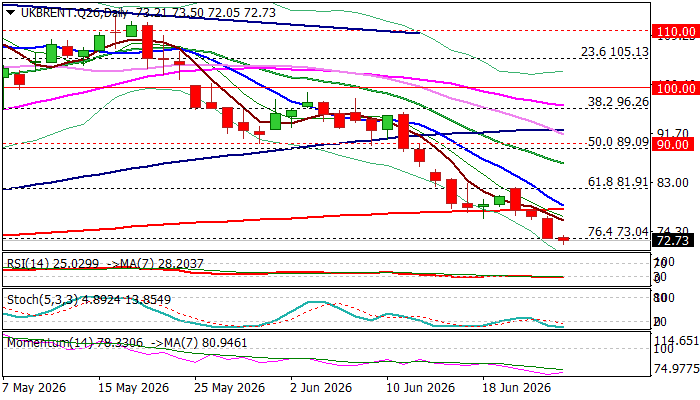
Brent oil price hit pre-war levels (last traded on February 27) in early Thursday’s trading, as re-opening of Hormuz strait (20 million barrels passed through only yesterday) provides strong relief and continues to deflate oil prices.
Analysts estimate that situation is going to completely normalize in next couple of weeks, with increased production from Iran (after the US temporarily lifted sanctions) to boost oil supply, mainly to China, the world’s biggest oil importer and the biggest buyer of Iranian oil.
Fresh acceleration lower that extends into fourth straight day, cracked target at $73.04 (Fibo 76.4% of $58.70/$119.47 rally) and eyes next significant support at $70 (psychological), though oversold conditions on daily chart suggest that traders may opt for a partial profit taking.
Daily studies remain in full bearish configuration (strong negative momentum / multiple MA bear-crosses, with converging 10/200DMAs about to form death cross) maintaining downside pressure.
Violation of $70 to expose targets at $69.15 and $66.80 in extension, with upticks to face strong resistance at $78.16 (200DMA) which should cap and guard upper breakpoint at $81.91 (recent tops / broken Fibo 61.8%).
Res: 74.46; 75.76; 77.03; 78.16
Sup: 72.05; 70.43; 70.00; 69.15
Bitcoin Has Formed a Double Bottom at $59K
Market Overview
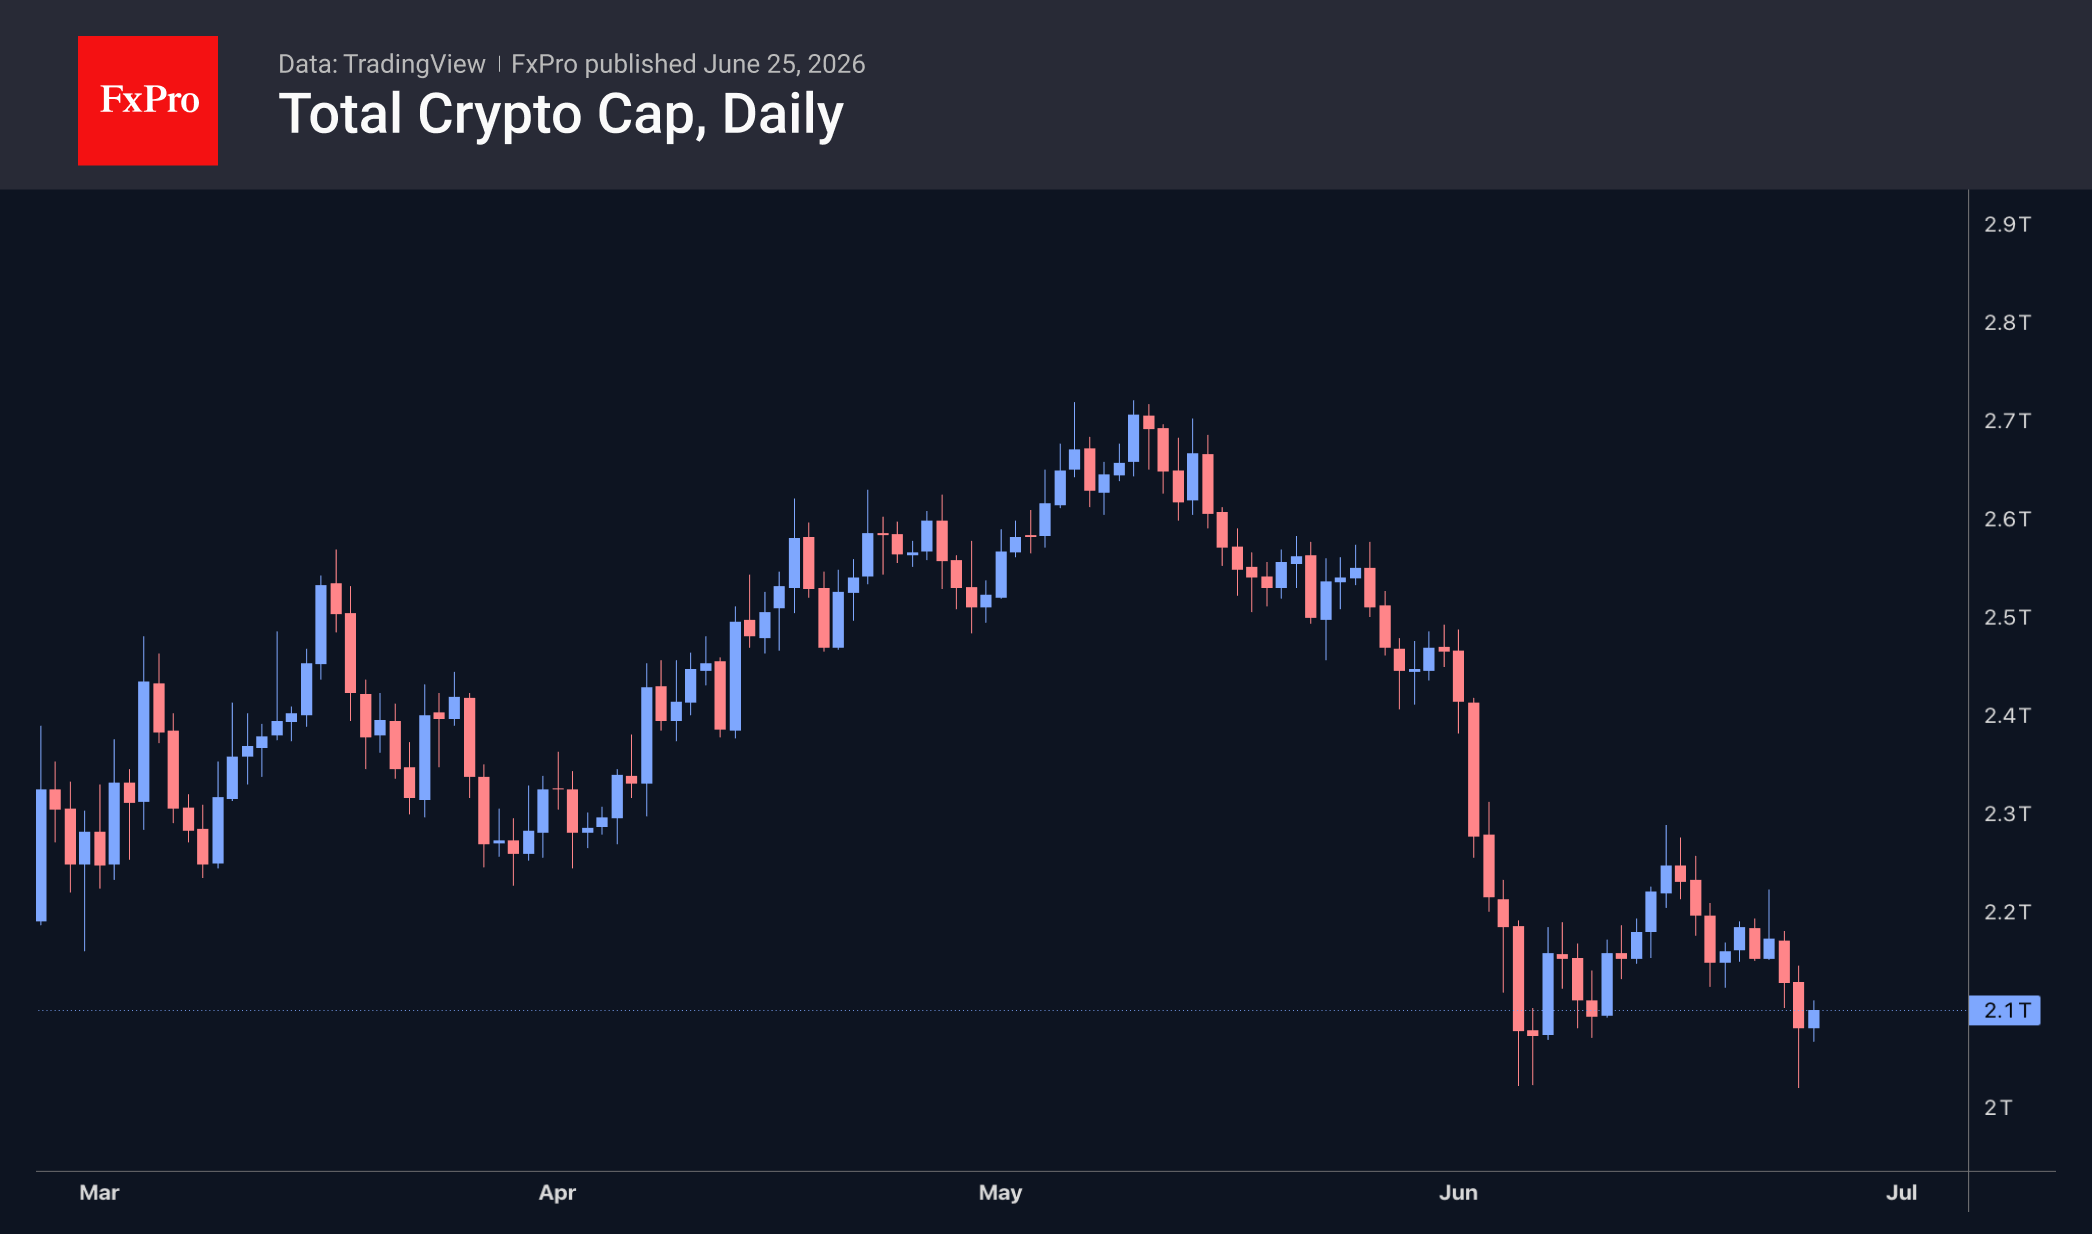
The crypto market has fallen 1.4% over the past 24 hours, retreating to $2.12T as it continues its gradual return to the lows seen at the start of June. Notably, this time, cryptocurrencies were in no hurry to rebound alongside the stock market, preferring to wait for a more confident recovery to take shape. Over the past 24 hours, the top gainers were Aave (+14.2%), Internet Computer (+3.6%) and Gram (formerly Toncoin, +2.9%). The biggest declines were SushiSwap (-7.7%), Theta Network (-7.5%) and IOTA (-5.7%).
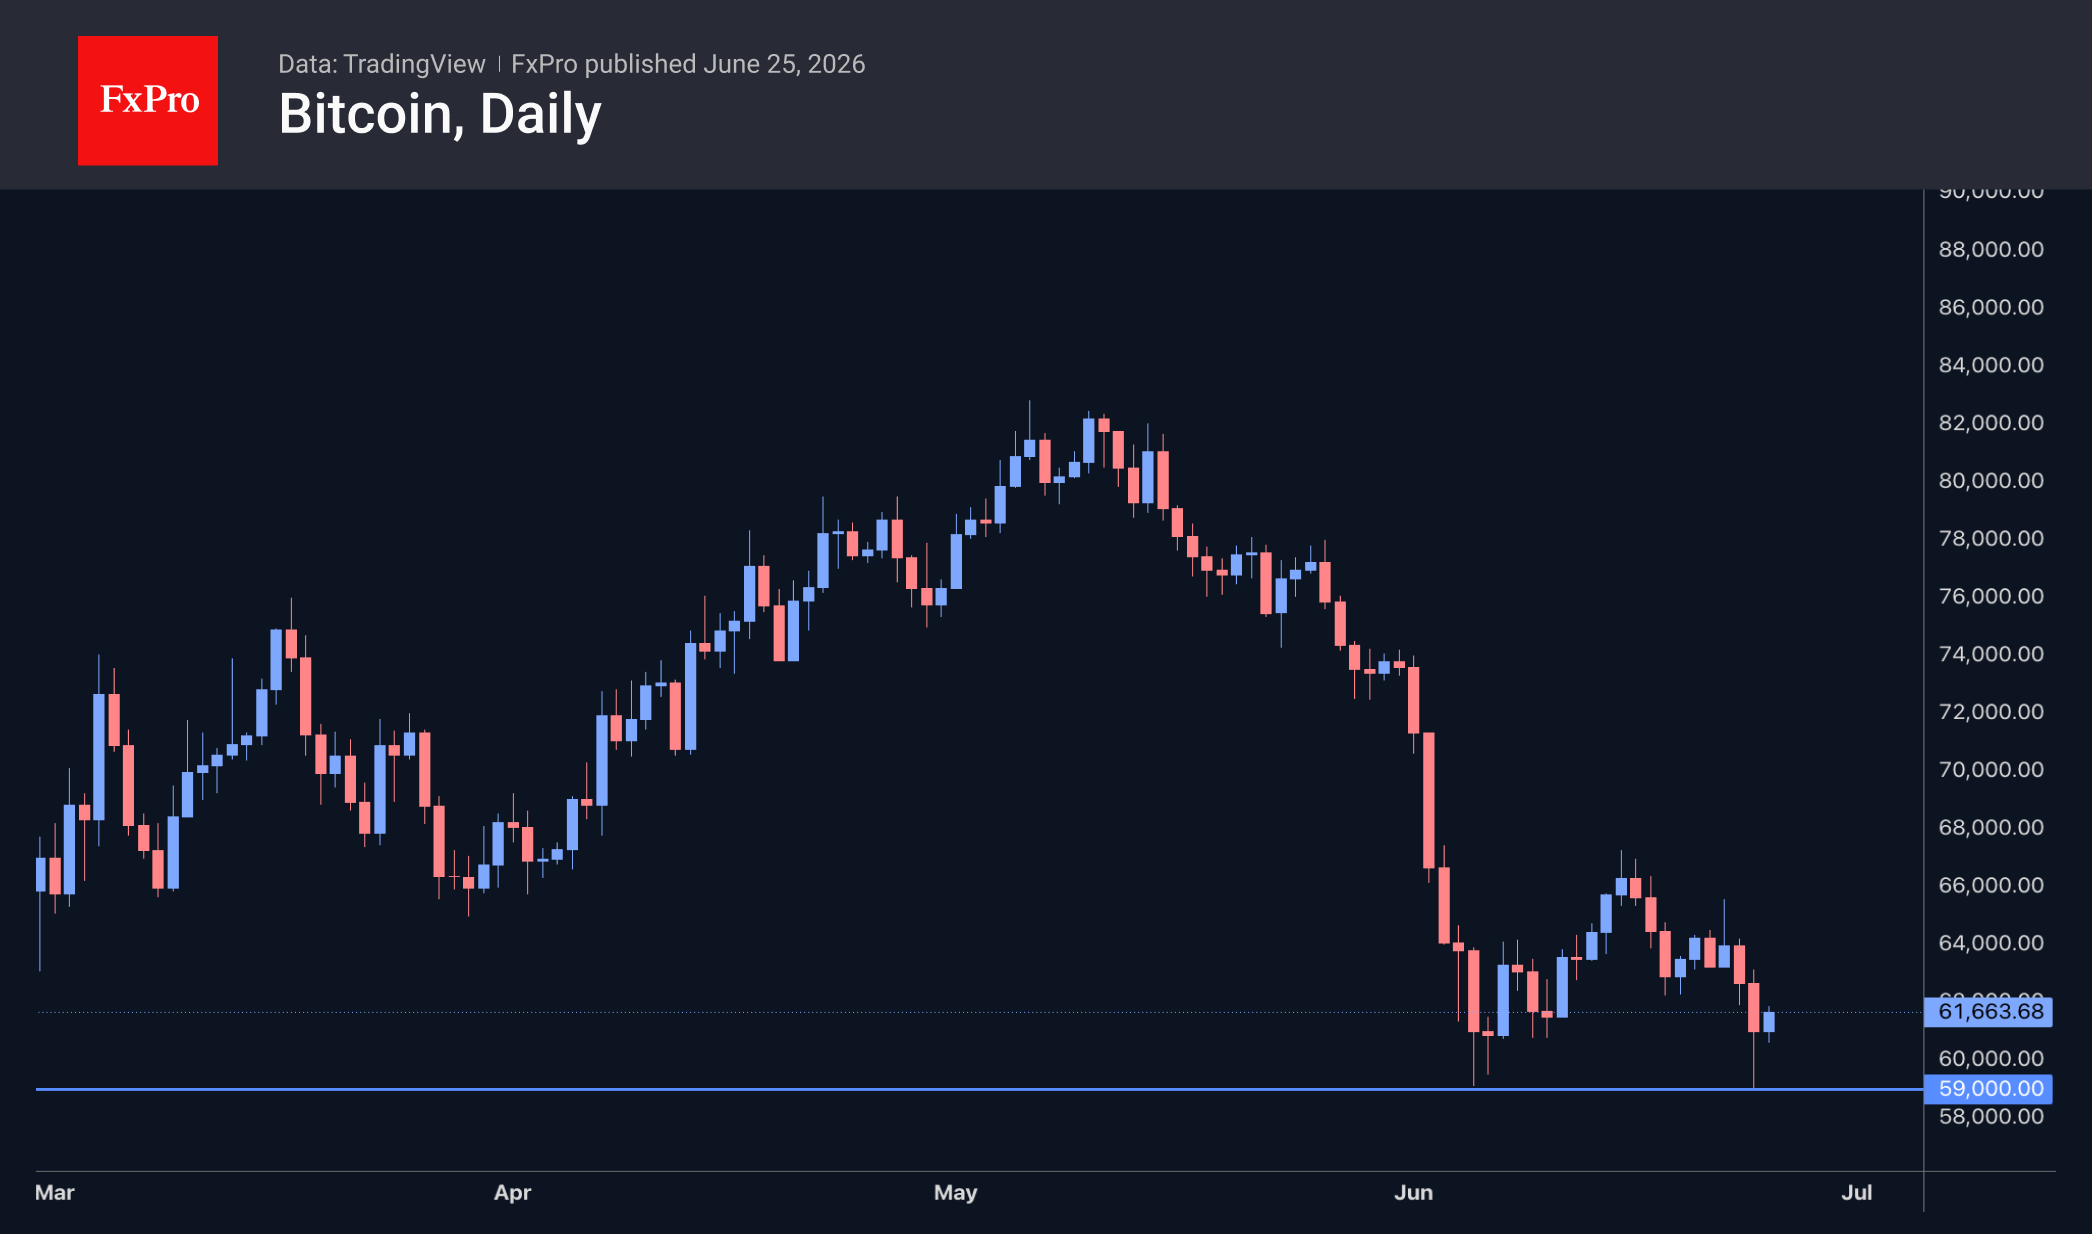
Bitcoin re-tested its early-June lows, touching $59K at the low point of Wednesday’s sell-off. This was followed by a decisive rebound, fuelling the bulls’ hopes of a double bottom forming. Should the rebound continue, the nearest upside potential is $67K, mirroring the movement seen in the first half of the month. For now, however, we are sticking to the ‘boring scenario’ described earlier, involving several weeks of consolidation near the 200-week moving average. This is trending higher and currently sits near $62.2K, with a likelihood of reaching $68K by October.
News Background
Strategy’s (STRC) preference shares have traded below their $100 par value for almost a month. Since the start of 2026, Strategy’s US-dollar cash reserves have fallen by 38 per cent. Over the same period, annual dividend liabilities have risen almost fourfold to $1.2 billion. Any attempt to quickly replenish the reserves by selling BTC would ‘destroy’ the company’s shareholder value.
Activity on the Bitcoin network has reached its highest level in the past two years, according to Glassnode. The rise in transaction volume is atypical for bear market phases and was triggered by the Runes protocol, which allows fungible tokens to be issued and transferred directly on the BTC network.
Bitcoin can be a useful way to diversify an investment portfolio when its share of total assets does not exceed 1–2 per cent, according to BlackRock. The investment firm advises investors to approach this asset with caution.
The Ethereum Foundation (EF) has announced a major reorganisation, unveiled an updated governance structure, and moved into cost-cutting mode, reducing its budget by 40 per cent. A former EF coordinator recently stated that around $30 million per year is required to support the network’s core infrastructure.
MoneyGram, one of the largest money transfer operators, has become a validator on the Solana network. Joining the Solana ecosystem will enable MoneyGram to expand its range of financial services using blockchain technology.
The FxPro Analyst Team
AUD/USD Stabilizes as Inflation, Jobs and Spending Keep August RBA Hike Alive
Australia's latest economic data were supposed to answer one question: has April's oil shock weakened the economy enough to keep the Reserve Bank of Australia comfortably on hold?
Instead, they delivered a more complicated answer.
AUD/USD has begun to stabilize after a sharp selloff this week, reflecting a data flow that was mixed at first glance but surprisingly consistent underneath. Headline inflation eased, yet core inflation accelerated. Employment rebounded, even if the quality of hiring softened. Most importantly, household spending bounced back strongly, suggesting consumers have largely absorbed the hit from higher energy prices.
Inflation remains the biggest challenge for policymakers. Annual CPI slowed to 4.0% from 4.2%, helped by lower fuel prices. But that is unlikely to provide much comfort to the RBA. Its preferred trimmed mean inflation measure accelerated to 3.6%, while services inflation picked up to 3.7%, showing that domestic price pressures remain stubborn despite improving energy costs. In other words, imported inflation may be easing, but home-grown inflation is proving harder to tame.
The labor market offered a similarly balanced picture. Employment rose by a stronger-than-expected 40.3k and unemployment edged down to 4.4%, but April's job losses were revised substantially deeper. Full-time employment increased by only 5k, with most hiring concentrated in part-time work, while hours worked declined -1.1% over the month. The report does not point to an overheating jobs market, but neither does it suggest labor conditions are deteriorating rapidly.
Perhaps the most significant report received the least attention. Household spending rebounded 1.3% mom in May after April's -1.7% mom decline, with all nine spending categories recording gains. That broad-based recovery indicates domestic demand has regained much of the ground lost during the oil-price shock, raising the possibility that stronger consumption could keep underlying inflation elevated over coming months.
The combined message from this week's releases is that the RBA's job has become more difficult rather than easier. A softer headline inflation reading alone might have strengthened the case for staying on hold. But resilient demand, sticky core inflation and a labor market that continues to hold together mean another rate hike in August remains very much in play, though not confirmed
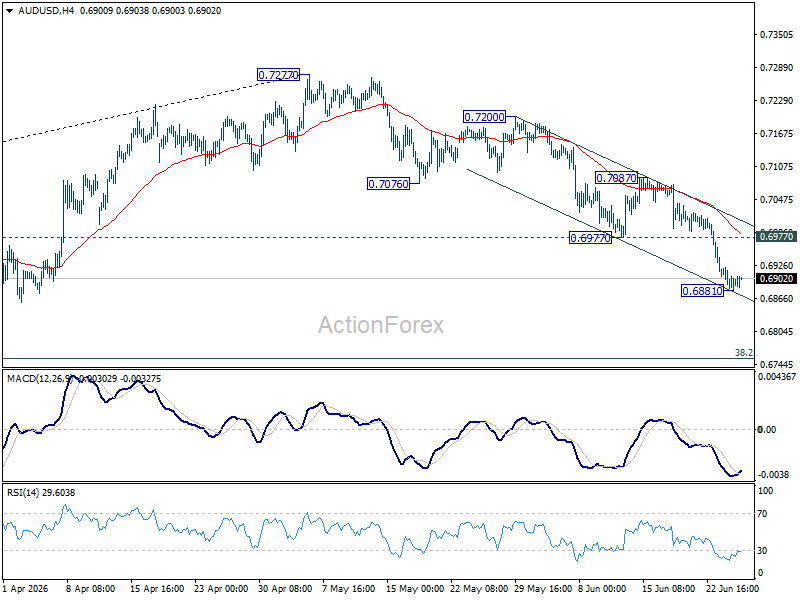
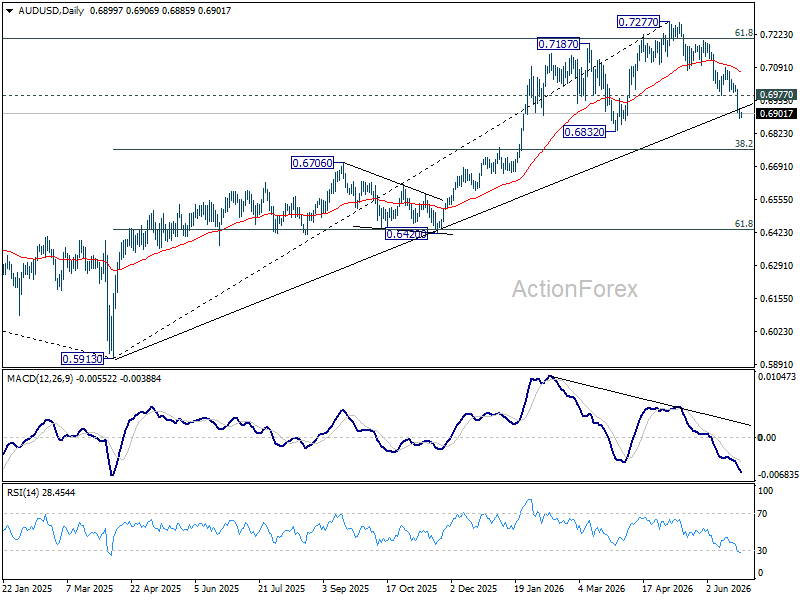
Technically, AUD/USD may have established a temporary low at 0.6881, allowing for a period of consolidation. However, any recovery is likely to remain capped below 0.6977, now acting as resistance. The broader decline from 0.7277 is still viewed as a correction of the rally from the 2025 low at 0.5913, with scope for a deeper fall toward the 38.2% retracement at 0.6756 before a more sustainable bottom is formed.
Schnabel: ECB Will Need More Rate Hikes Despite Middle East Ceasefire
European Central Bank Executive Board member Isabel Schnabel reinforced the ECB's hawkish stance on Thursday, arguing that the recent ceasefire in the Middle East does not diminish the need for further policy tightening. "The ceasefire is no reason for monetary policymakers to let their guard down," she said in an Interview with Die Zeit, warning that while oil prices have retreated from their recent peaks, medium-term energy prices remain elevated and uncertainty is still high. Schnabel also defended the ECB's June rate hike, saying the decision "was appropriate in all the scenarios we considered, including a milder scenario in which oil prices normalise rapidly."
Looking ahead, Schnabel made clear that additional tightening remains her baseline expectation. "From today's perspective, we will need to raise interest rates further in order to bring inflation back to our two percent target over the medium term," she said. At the same time, she emphasized that policymakers are not following a predetermined path, adding that "the extent and timing of further measures will depend on how the conflict, the economy and inflation evolve." Her remarks are consistent with market expectations that the ECB will proceed cautiously while retaining a tightening bias.
Schnabel argued that the central bank's priority is preventing higher energy prices from feeding into broader inflation through wages and corporate pricing. "It was necessary to prevent elevated medium-term energy prices from causing second-round effects and even higher inflation," she said, warning that policymakers "can't let it get to a point where prices and wages enter into a mutually reinforcing spiral." While acknowledging that higher borrowing costs will weigh on growth, Schnabel maintained that interest rates are "not yet restrictive," reinforcing the message that the ECB believes further policy normalization will still be needed even if geopolitical tensions continue to ease.
Bitcoin: Corrective Channel Broken as Traders Turn More Active
Bitcoin has come under the influence of several factors simultaneously. The wave of selling at the beginning of June was linked to Strategy's first disclosed Bitcoin sale in several years, a prolonged series of outflows from spot ETFs, and a large transfer of funds from a Mt. Gox wallet to a new address. The run of outflows from US spot Bitcoin ETFs became one of the longest and largest since these products were launched in January 2024.
Bloomberg Intelligence analyst James Seyffart noted that around $9 billion has exited Bitcoin ETFs since their peak, although most long-term fund investors have chosen to maintain their positions.
Technical picture
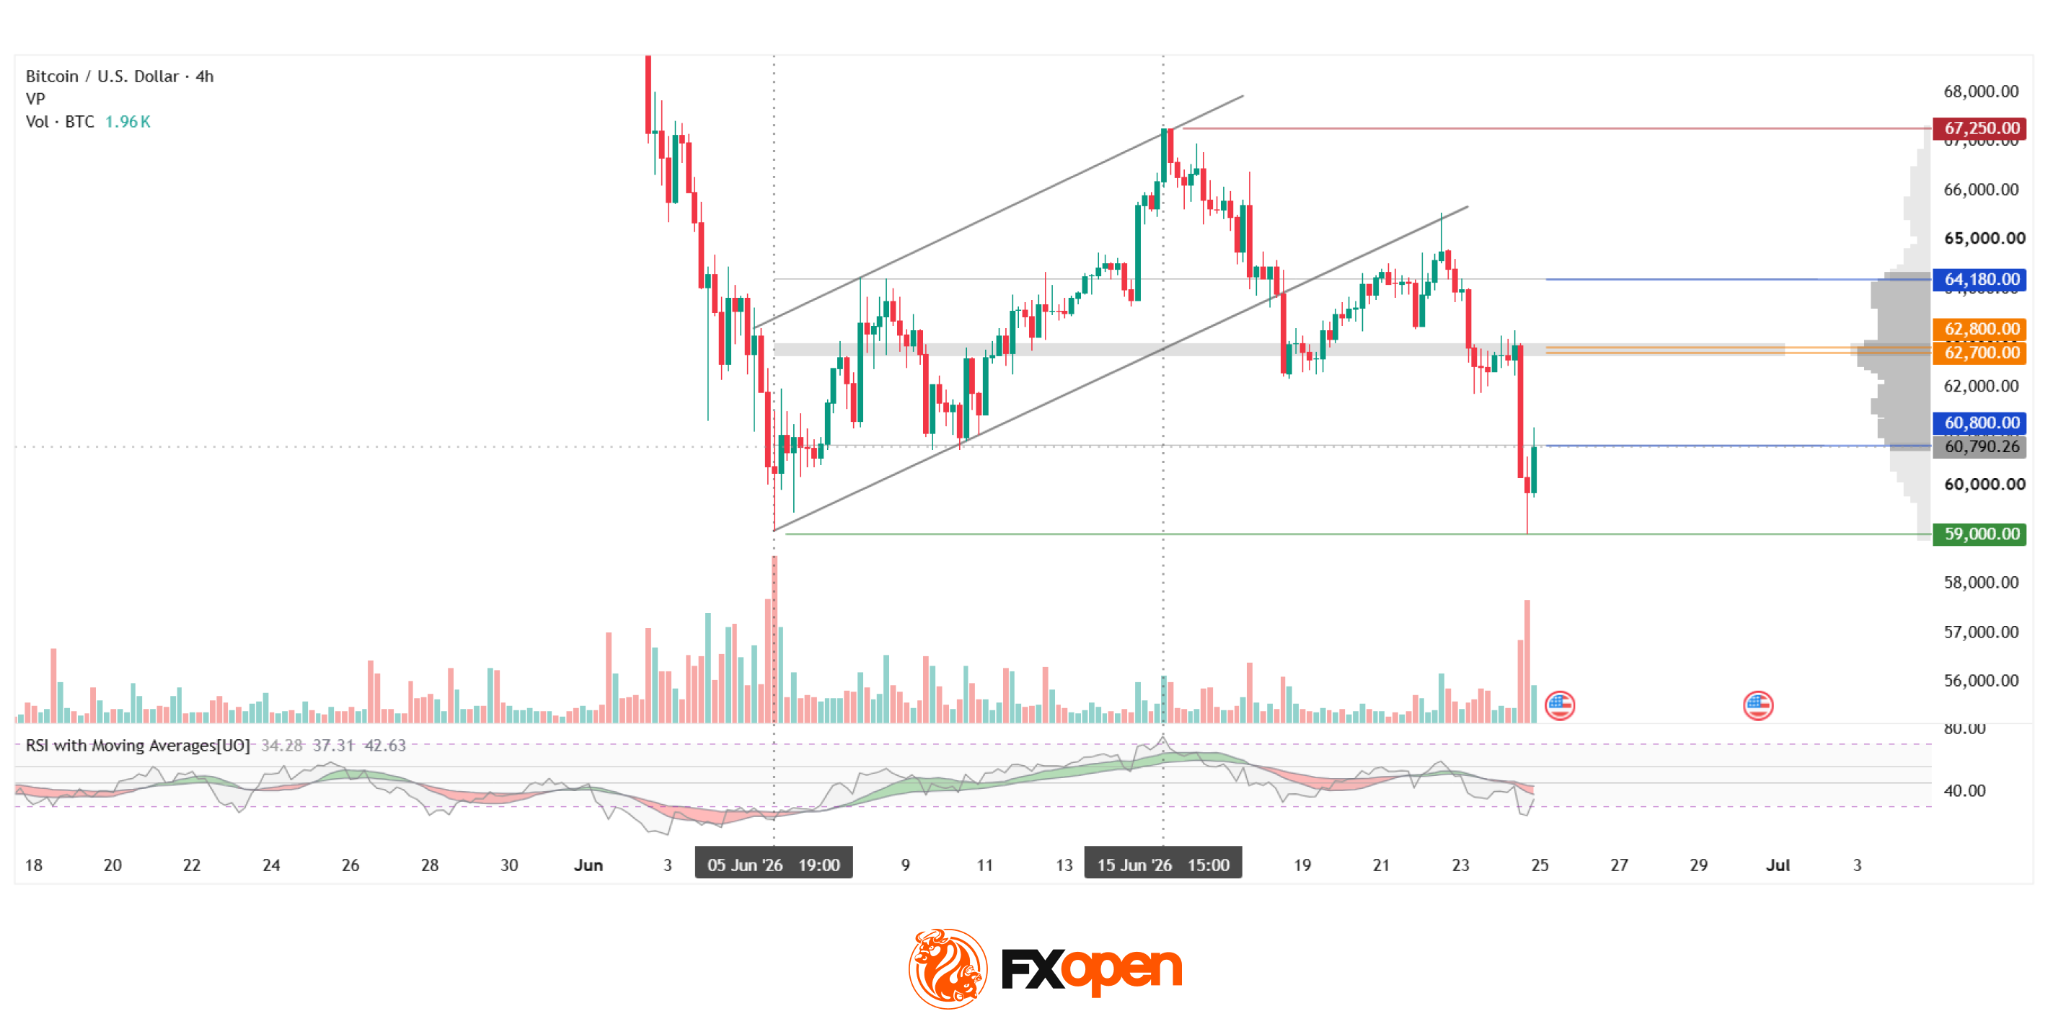
On the H4 chart of BTC/USD, an ascending corrective channel formed after an impulsive decline towards the $59,000 area. Price subsequently advanced to the upper boundary of the channel at $67,250, but failed to hold those levels. The channel was then broken to the downside, with quotations moving towards a test of the lower boundary of the current profile at $60,800.
The Point of Control (POC) is concentrated in the $62,700–$62,800 area and could attract market attention if price rebounds from the lower boundary.
The upper boundary of the profile is located near $64,180 and could act as resistance if the POC zone is breached. The RSI + MAs indicator stands at 34, 37 and 42 respectively. The oscillator remains below the neutral zone but has recovered from oversold territory, while the moving averages remain bearish and continue to point lower.
At the same time, vertical volume surged sharply during the decline on 24 June, which may have been interpreted by market participants as a sign that the local downtrend was nearing completion.
Summary
The unusually high volume recorded on 24 June, combined with the current RSI position, does not provide strong confirmation that the latest local impulse will continue, although the moving averages remain pointed lower for now.
Further price action may be influenced by upcoming US inflation data, as well as flows into Bitcoin ETFs, which experienced record outflows during June.
FXOpen offers the world's most popular cryptocurrency CFDs*, including Bitcoin and Ethereum. Floating spreads, 1:2 leverage — at your service (additional fees may apply). Open your trading account now or learn more about crypto CFD trading with FXOpen.
*Important: At FXOpen UK, Cryptocurrency trading via CFDs is only available to our Professional clients. They are not available for trading by Retail clients. To find out more information about how this may affect you, please get in touch with our team.
This article represents the opinion of the Companies operating under the FXOpen brand only. It is not to be construed as an offer, solicitation, or recommendation with respect to products and services provided by the Companies operating under the FXOpen brand, nor is it to be considered financial advice.
US Dollar Strengthens Amid Equity Market Weakness and Hawkish Fed Rhetoric
The US dollar continues to hold firm near multi-year highs as sentiment across equity markets deteriorates and investors increasingly expect the Federal Reserve to maintain a restrictive monetary policy stance for longer. The US economy remains resilient, while inflation risks continue to run elevated, prompting market participants to reassess the timing of potential interest rate cuts. Against this backdrop, demand for the dollar is being supported both by attractive US asset yields and its status as a safe-haven currency.
An additional source of support for the greenback has come from the decline in stock markets, which has increased investor caution and encouraged capital flows into the dollar. Despite some easing in geopolitical tensions surrounding Iran and a correction in oil prices, expectations of a more hawkish Fed remain the key market driver. Interest-rate futures continue to reflect a high probability that restrictive policy will remain in place for an extended period, supporting the dollar against most major currencies.
USD/JPY
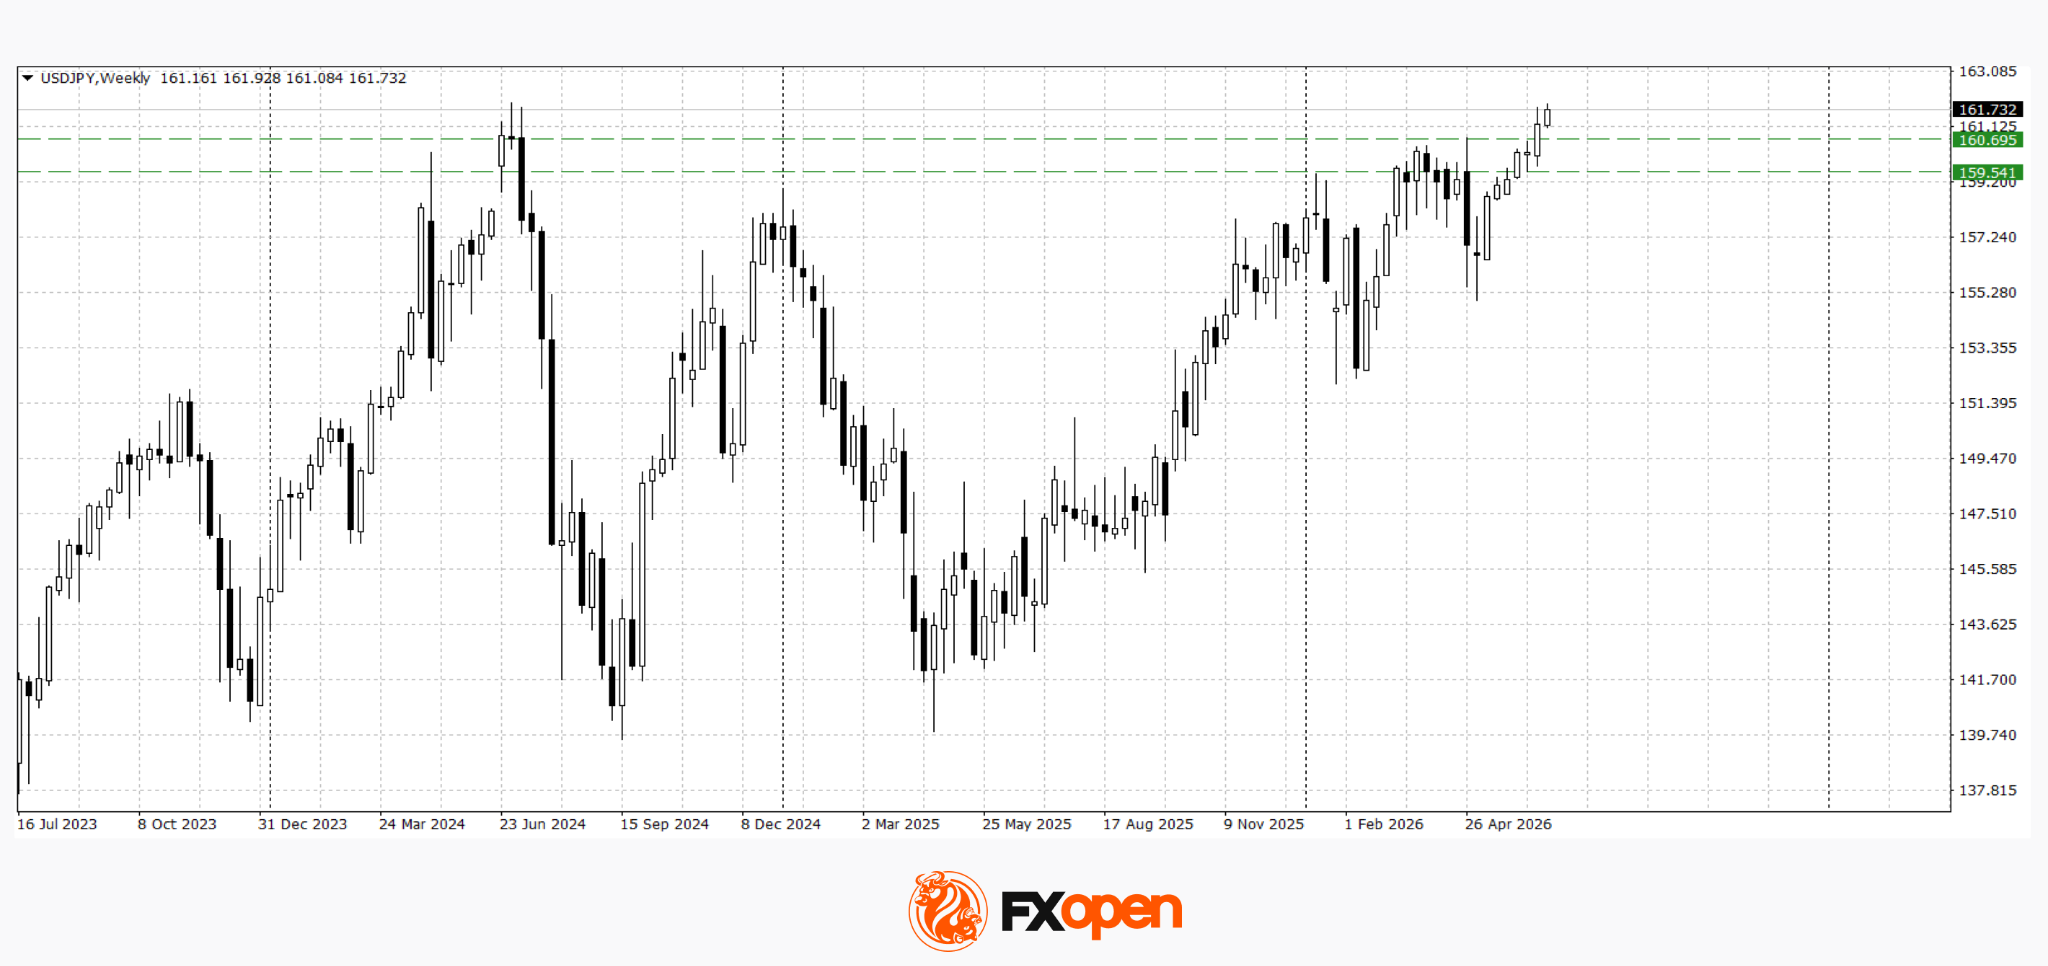
USD/JPY continues to advance and is trading close to multi-year highs near 162.00. Pressure on the yen persists due to the wide interest-rate differential between the United States and Japan, as well as market doubts about the willingness of Japanese authorities to carry out further currency interventions. Technical analysis suggests the pair could extend its advance towards the psychological 163.00–164.00 area.
At the same time, a spike in volatility and a sharp pullback towards 160.00–161.00 cannot be ruled out, as the pair is already trading within a zone of long-term resistance on higher timeframes.
Key events for USD/JPY:
- Today at 15:30 (GMT+3): US Core Personal Consumption Expenditures (PCE) Price Index;
- Today at 15:30 (GMT+3): US GDP data;
- Today at 15:30 (GMT+3): Continuing Jobless Claims in the United States.
USD/CAD
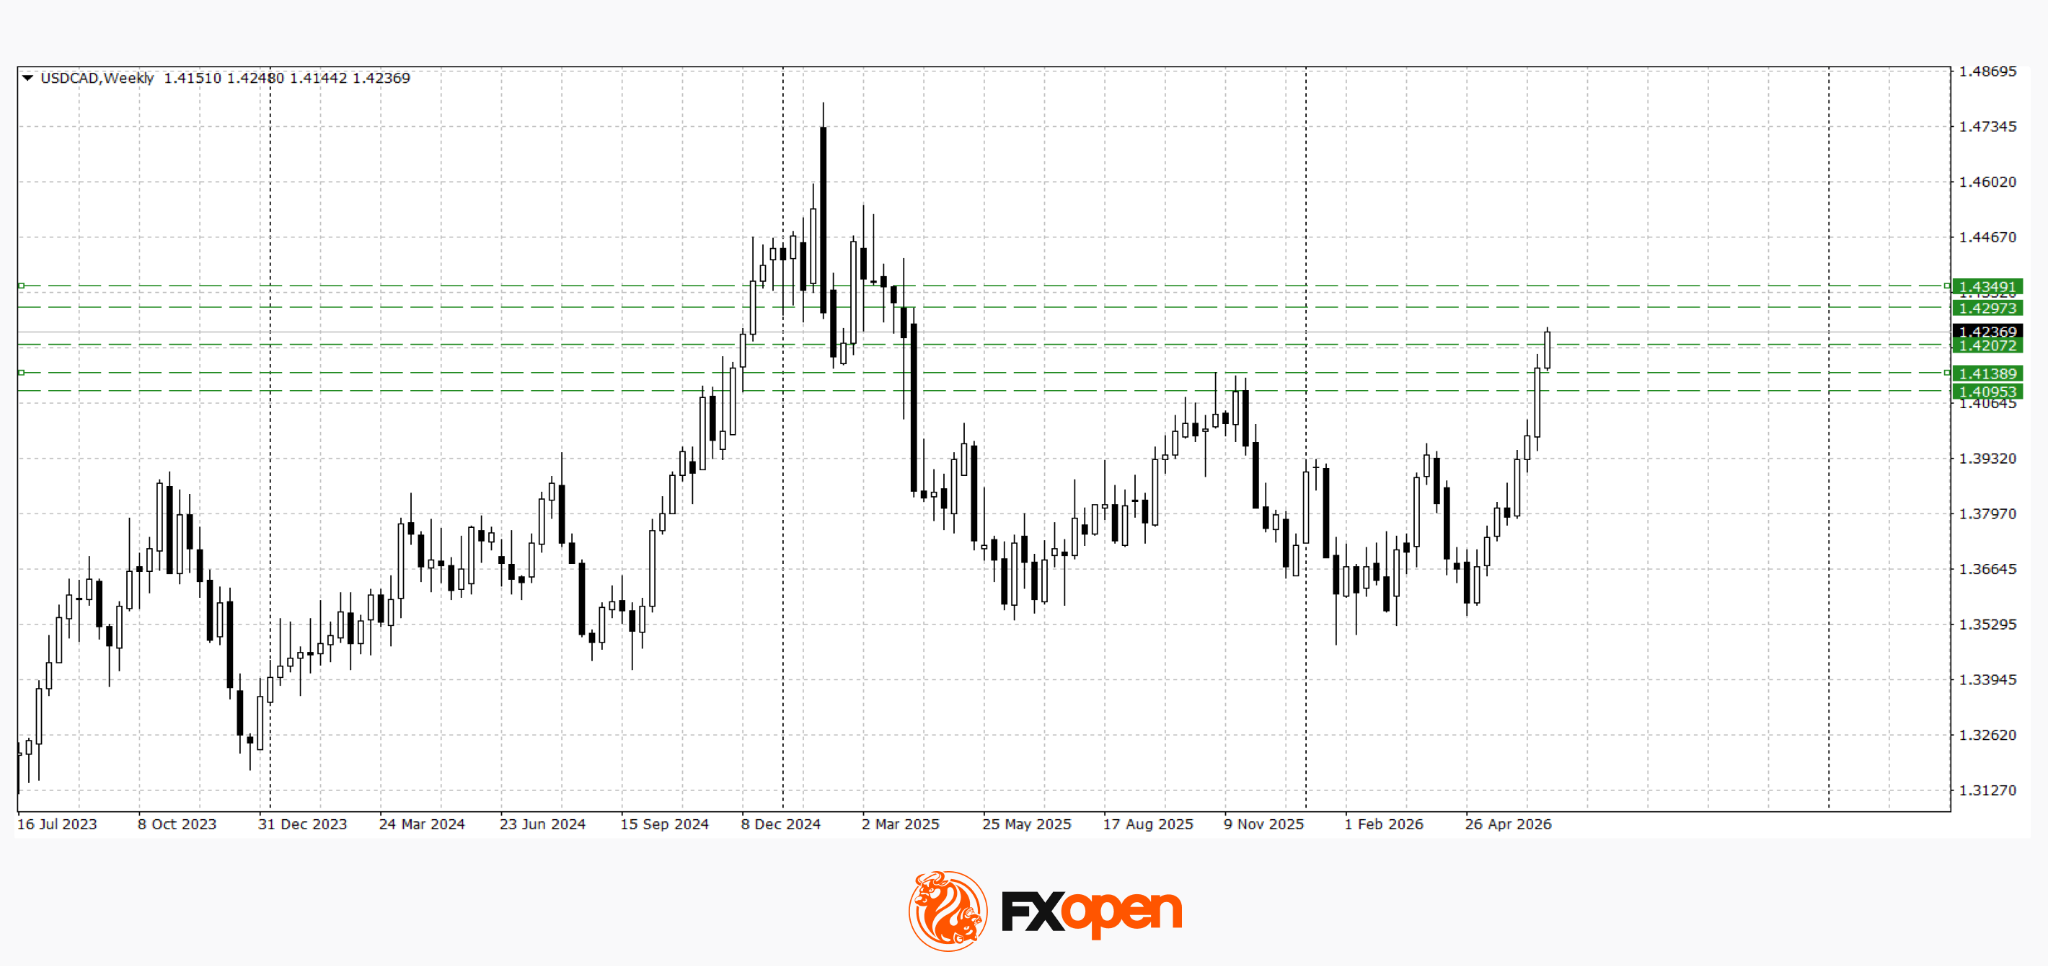
USD/CAD also remains in an uptrend and is approaching long-term resistance levels in the 1.4300–1.4350 area. The pair is being supported by US dollar strength and the relative weakness of the Canadian dollar amid lower oil prices and expectations of further divergence between Bank of Canada and Federal Reserve policy.
A sustained move above 1.4300 could open the way for further gains towards 1.4350. However, a rejection from these levels and the formation of bearish reversal patterns could trigger a corrective decline towards the 1.4140–1.4200 region.
Key events for USD/CAD:
- Today at 15:30 (GMT+3): Average Weekly Earnings in Canada;
- Today at 15:45 (GMT+3): speech by Federal Open Market Committee (FOMC) member Michelle Bowman;
- Today at 17:00 (GMT+3): Atlanta Fed GDPNow estimate.
The US dollar remains the primary beneficiary of the current market environment. Equity market weakness, expectations of a prolonged period of restrictive Fed policy and the relative weakness of competing currencies continue to support the greenback.
At the same time, both USD/JPY and USD/CAD are approaching significant long-term resistance levels. As a result, further price action is likely to depend on whether upcoming macroeconomic data can confirm the resilience of the US economy and whether the Federal Reserve maintains its hawkish tone in forthcoming commentary.
Trade over 50 forex markets 24 hours a day with FXOpen. Take advantage of low commissions, deep liquidity, and spreads from 0.0 pips (additional fees may apply). Open your FXOpen account now or learn more about trading forex with FXOpen.
This article represents the opinion of the Companies operating under the FXOpen brand only. It is not to be construed as an offer, solicitation, or recommendation with respect to products and services provided by the Companies operating under the FXOpen brand, nor is it to be considered financial advice.
Gold Falls to an Eight-Month Low: This May Not Be the Bottom
Gold stabilised near 4,000 USD per troy ounce on Thursday but remained close to its lowest levels in almost eight months. The market continues to face pressure from a stronger US dollar and growing expectations of further monetary policy tightening by the Federal Reserve.
The US Dollar Index refreshed its highest level in more than a year, making gold more expensive for buyers using other currencies. This traditionally reduces demand for the precious metal.
Last week, the Federal Reserve left interest rates unchanged but signalled that it remained ready to tighten policy further. Fed Chair Kevin Warsh once again reaffirmed the regulator’s commitment to fighting inflation. The market is now pricing in a high probability of a rate hike as early as September, with the possibility of further moves before the end of the year.
Expectations of higher interest rates are currently outweighing the support that gold could have received from lower geopolitical tensions.
Progress in negotiations between the US and Iran helped oil prices return to the levels seen before the conflict and significantly reduced inflation risks. As a result, demand for safe-haven assets was left without strong support.
Technical Analysis
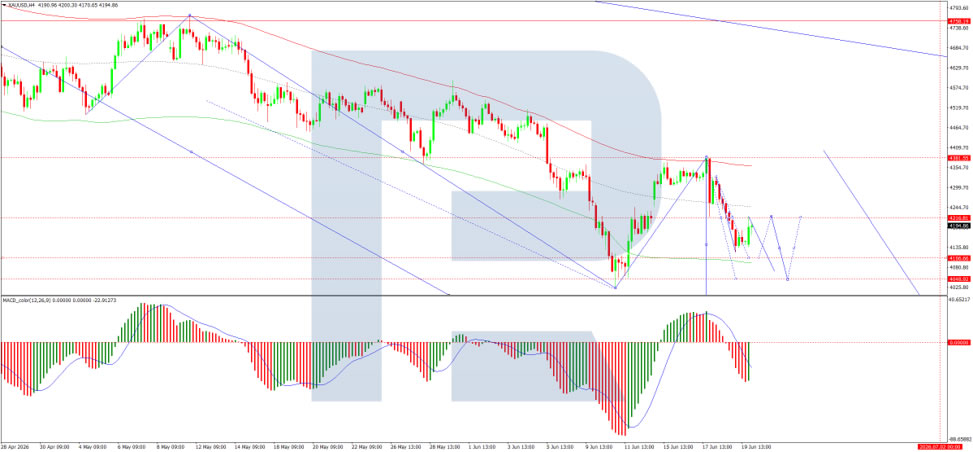
On the H4 chart of XAU/USD, the market formed a consolidation range around 4,099 and completed a downward wave to 3,960. We expect a corrective move towards 4,099, testing this level from below. After that, the probability of a new decline towards 3,869 may be considered, with the potential for the wave to extend to 3,828.
The MACD indicator confirms the current downward impulse. The signal line is below the central line and is pointing firmly downwards.
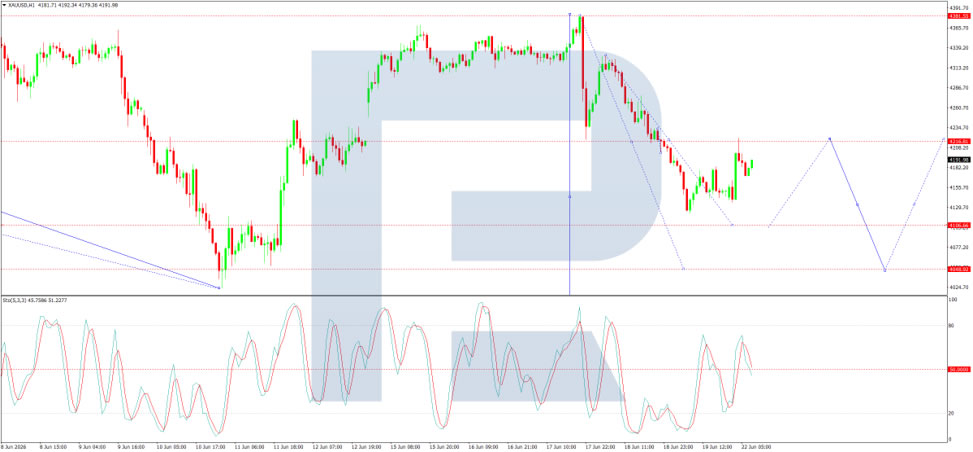
On the H1 chart, the market broke below 4,099 and completed a downward wave towards 3,960. Going forward, the possibility of a correction towards 4,099 may be considered, with this level tested from below.
In practice, a trend-continuation pattern is forming to the downside. After that, a decline towards 3,860 is expected, with the potential for the trend to continue towards 3,828.
The Stochastic oscillator confirms this scenario: the signal line remains below 50 and is under pressure to decline towards 20.
Sunrise Market Commentary
Markets
Core bonds rallied yesterday with US Treasuries outperforming German Bunds. Yields in the US fell 5.2 (2-yr) to >10 bps (30-yr). German rates eased 2.4-6 bps in a similar curve shift. End-of-quarter (extension) buying and an ongoing decline in oil prices inspired most of the drop. Brent oil yanked lower on unrelenting optimism that flows in the Strait can and will normalize quickly. The $73.74 close was the lowest since the war in Iran erupted. Further easing this morning even pushed the price of a barrel below the pre-conflict levels. Inflation risk premia retreat and support the long end of the curve in particular. The bid for shorter maturities was there too but less dramatic. ECB rate hike bets continue to linger with markets expecting at least one more move in 2026 (to 2.5%). ECB board member Schnabel in an interview with Die Zeit newspaper said the central bank would probably have to increase rates again. She welcomed the peace deal but warned that it is no reason for monetary policy to let its guard down. The current 2.25% isn't restrictive yet in her view. While current oil prices are down significantly, the ECB is watching prices for future deliveries even more closely in order to determine whether the 2% inflation target is reachable in the medium term. "And those prices remain elevated," she noted. It was Schnabel who put the cat among the pigeons end-May by warning that the ECB could no longer look through the energy price shock, signalling the eventual hike in June. Several other ECB members will hit the wires today, including chief economist Lane (although he offered his views already earlier this week). US money markets ramped up Fed hike bets on solid economic data and the Fed's hawkish tilt under Warsh. Despite the oil price drop, there's still some 35 bps of tightening priced in for 2026. Today's May PCE inflation data has the potential to at least support the idea. Consensus expects headline PCE to accelerate from 3.8% to 4.1%, moving further away from the 2% target. Core PCE is seen at 3.4% vs 3.3% in April. This compares to our KBC nowcast of 4% and 3.3% respectively. Services PCE, however, could come in at a sticky 3.7%. This is the part where Fed's Goolsbee earlier this week was worried about. This component has less to do with one-off price shocks such as the energy and tariff ones, suggesting strong underlying inflation currents, supported by a strong economy. It's against this backdrop that the bar appears high to fully price out lingering hiking speculation. That should support the downside in front-end (eg. 4% in 2-yr) yields and keep USD in favour. The technical charts complement the fundamental dollar case. EUR/USD yesterday confirmed the break below 1.1392, creating further momentum for a return towards 1.12/1.11. DXY closes in on the 102 (2025 correction high) level with 102.86 as the next target. EUR/GBP hit an intraday low yesterday just north of the 0.86-support before bouncing back to 0.862. The jury remains out whether GBP post-Burnham honeymoon period is already nearing the end.
News & Views
May Australian employment numbers reversed the weak (and downwardly revised) April labour market growth. The economy added 40.3k jobs (from -40.7k). Details showed full-time employment growing by 5k and part-time employment by 35k. The unemployment rate ticking down from 4.5% to 4.4% even as the participation rate moved higher, from 66.6% to 66.7%. The head of the Australian Bureau of labour statistics said that the backlog of people waiting to start a job has eased. Yesterday's sticky core CPI and today's labour market data don't remove market doubt on whether or not the Reserve Bank of Australia will hike its policy rate one last time later this year. The market implied probability of November action is 50%, to be compared with 60% at the end of last week. AUD/USD holds around 0.69 this morning after losing 0.70 support earlier this week on genuine USD strength. Technical support stands at 0.6833.
Hungarian economic sentiment improved from -6.7 to -6.2 in June, its best level since April 2022. While overall business confidence remained broadly unchanged (-8.4 from -8.8), consumer confidence continued to improve (-0.1 from -0.9; near 7-yr high). Across business sectors, the picture was mixed: industrial confidence declined slightly, construction stagnated, while retail and especially services (near 4-yr high) strengthened. Employment expectations remained stable overall while inflationary pressures eased. The share of companies planning price increases fell significantly from May, while those planning price cuts rose slightly. On the consumer side, financial perceptions improved further, both regarding past and expected future conditions. However, views on the broader economy and willingness to make large purchases remained unchanged.
Germany Gfk Consumer Climate Improves Slightly as Inflation Fears Recede
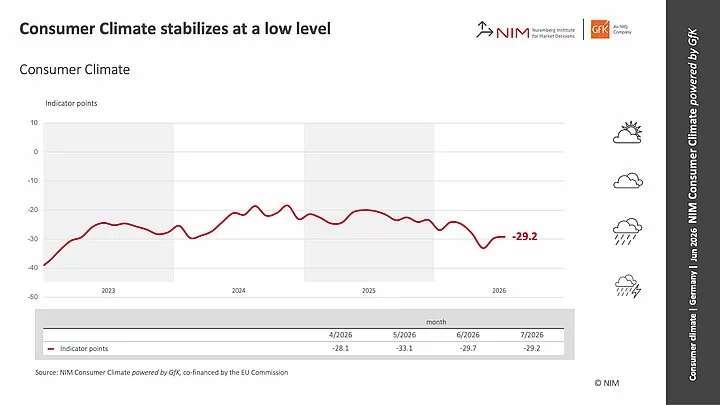
Germany's GfK Consumer Climate improved modestly heading into July, with the headline index rising from a revised -29.7 to -29.2, but missed expectation of -28.0. The improvement was driven mainly by a slight recovery in income expectations, while willingness to buy remained deeply negative and households continued to favor saving over spending. The latest survey indicates that consumers remain cautious despite signs that the broader economic outlook is becoming less pessimistic.
Income expectations rose 0.8 points to -12.2 after last month's sharp rebound, although they remain well below pre-Iran conflict levels. Economic expectations also improved, with the indicator climbing 2.5 points to -8.7 as consumers became somewhat less pessimistic about Germany's economic prospects over the coming year. Meanwhile, inflation concerns continued to ease for a second consecutive month, with price expectations falling 2.5 points to -2.9.
NIM's Head of Consumer Climate, Rolf Bürkl, said, "Consumer Climate is currently stabilizing at a low level," noting that "there are no signs yet of a return toward pre-war levels," even though easing geopolitical tensions and lower oil prices are helping to improve inflation expectations and the broader economic outlook.
| Indicator | June | May | Change |
|---|---|---|---|
| GfK Consumer Climate (July) | -29.2 | -29.7 | +0.5 pts |
| Income Expectations | -12.2 | -13.0 | +0.8 pts |
| Willingness to Buy | -13.4 | -13.2 | -0.2 pts |
| Willingness to Save | 13.9 | 13.9 | Unchanged |
| Economic Expectations | -8.7 | -11.2 | +2.5 pts |
| Price Expectations | -2.9 | -0.4 | -2.5 pts |
PCE Core Rise to Fuel Rate Hike Bets
In focus today
- In the US, today's main data focus will be on the May PCE. Consensus and the Kalshi prediction market expect that core PCE was 0.3% m/m in May with a tilt towards 0.4% m/m. A rise in PCE core inflation in conjunction with Warsh's hawkish inflation stance may further underpin the expectation in the market of a rate hike over the coming months.
Economic and market news
What happened overnight
In commodities, Brent crude plummeted yesterday, trading around USD72/bbl. this morning and close to the pre-war levels. While much attention in the oil market remains on the supply situation, we think the stronger USD and associated growth worries are behind the drop. The hawkish turn by the Fed and rosier supply outlook have created a bearish environment for oil. While the USD rally has come a long way, traffic through the Strait of Hormuz remains low. Hence, oil prices could potentially fall further as global supplies normalise.
What happened yesterday
From the ECB, Schnabel was on the wire and stated that the euro area economy remains relatively resilient but warned that a ceasefire is no reason for the ECB to let its guard down. She highlighted rising risks of second-round inflation effects and said that war, inflation and growth will determine the timing and scale of any rate increases. Schnabel argued that ECB interest rates are not yet restrictive and, from today's perspective, further hikes are needed to bring inflation back to 2%. We forecast only one more rate hike in September and expect the ECB to revert to cuts in H1 2027.
In Sweden, the Riksbank Minutes did not really provide any major surprises, although it is worth emphasizing that the Minutes were more dovish than the MPR. However, given the developments post the cut-off date for the draft report (i.e. The MoU between US and Iran), this dovish shift makes good sense. The balance within the board remains the same. Inflation risks are still seen as elevated and largely driven by global factors, but domestic indicators now point to broader price pressures. Even so, most Board members think that current low inflation and weak resource utilisation mean it is best to keep policy unchanged for now and wait for more information.
In Germany, the Ifo report for June came in broadly as expected with a rise to 85.6 (cons: 85.5, prior: 85.0). The assessment of the current situation rose to 87.0 (cons: 86.3, prior: 86.1) while expectations declined to 84.1 (cons: 84.8, prior: 83.9). The assessment of the current situation is thus back slightly above the level seen before the war in Iran while expectations remain weaker. The dire picture of German activity in June from Tuesday's PMI report was thereby not corroborated by the Ifo indicator.
In Norway, the latest figures from the Norwegian Labour Force Survey show that the registered unemployment rate fell to 4.4% in May from 4.6% in April, while the trend-based rate remained stable at 4.8%.
Equities ended marginally lower yesterday, led down by energy and materials, but the headline move again concealed very wide dispersion across sectors and regions.
This is not a clean risk on or risk off market. It is a market dominated by two forces: the earnings outlook for technology and the impact of the violent moves in oil.
Despite the modest index decline, five sectors closed higher, and it is worth noting that both consumer discretionary and consumer staples advanced as the implicit consumer tax from oil has fallen sharply, with Brent now back around pre conflict levels.
At the same time, the technology earnings narrative was strongly validated by Micron, where results and guidance beat already elevated expectations and triggered a clear relief move across AI and memory related exposure.
In our view, being on the right side of these two drivers, oil relief and technology earnings resilience, is the key to outperforming in the coming period.
This morning, the Micron relief rally is playing out across Asia, with Japan and South Korea leading gains, while US and European futures are mostly higher, led by US technology.
FI and FX: The sell-off in EUR/USD continued yesterday, and the cross fell below 1.135. Last week's hawkish turn by the Fed remains the key driver of current USD strength and decline in EUR/USD. EUR/DKK rose further to 7.5758 yesterday amid continued sour risk sentiment in financial markets. We took advantage of the strong USD momentum and decided to close our long USD/SEK recommendation from late May at 9.7800, for a profit of 5.8% (excluding carry). Yields declined in a broad-based fashion in a bullish flattening of the curve. 10Y Bunds broke firmly below the 2.90 mark while 2Y Schatz dropped to around 2.55%. Similar price action was evident in the US with a significant flattening of the 2Y10Y US yield curve.
Please note that the Danske Morning Mail will be on summer break from 29 June to 31 July.