Sample Category Title
Markets Turn Uneasy as Iran Deadlock Persists and UK Political Risk Rises
Markets moved into a more cautious tone today as the deadlock in US-Iran peace negotiations continued to drag on, while renewed volatility in UK government bonds added another layer of political and fiscal uncertainty. However, despite the rising tension, broader market behavior still stopped short of outright panic.
Brent crude remained elevated near $103 after earlier surging above $105 as traders continued pricing persistent disruption risks around the Strait of Hormuz. Dollar initially rebounded broadly following President Donald Trump’s rejection of Iran’s latest peace proposal as “TOTALLY UNACCEPTABLE,” but follow-through momentum faded as the session progressed. US stock futures also recovered from earlier declines and were pointing to a broadly flat Wall Street open, highlighting that investors were merely becoming uneasy rather than fully risk-averse.
The diplomatic standoff itself appears increasingly entrenched. Iranian state media framed Tehran’s latest response as a rejection of what it described as a US demand for “surrender.” Iran’s counterproposal reportedly included demands for war reparations, recognition of full Iranian sovereignty over the Strait of Hormuz, the lifting of sanctions, and the release of frozen Iranian assets. President Masoud Pezeshkian also adopted a defiant tone over the weekend, insisting that negotiations “do not mean surrender or retreat.”
Markets had previously hoped for some form of controlled de-escalation after weeks of ceasefire discussions. Instead, the latest exchange suggests both sides remain fundamentally divided on core issues including sanctions, nuclear restrictions, and control over Hormuz. Nevertheless, investors still believe some form of eventual diplomatic framework can emerge, even if negotiations remain stalled in the near term.
At the same time, another source of nervousness emerged from the UK. British bond markets came under renewed pressure today, with the 10-year gilt yield climbing back toward the 5% level. The move reflects growing investor concern over political instability following Labour’s heavy losses in last week’s local elections.
Prime Minister Keir Starmer is reportedly facing mounting internal pressure to resign, with media reports suggesting more than 40 Labour MPs have privately called for him to step down. Potential successors including Wes Streeting and Andy Burnham are already being discussed publicly. Markets appear increasingly concerned that either a leadership change or a weakened government could eventually push Labour toward more expansionary fiscal policies.
The key market fear is not immediate political collapse, but rather a gradual erosion of fiscal credibility. Investors worry that efforts to stabilize Labour politically could involve looser fiscal rules, higher government borrowing, or more populist spending measures. Unless Starmer can decisively stabilize his leadership position, or Chancellor Rachel Reeves can reassure markets that fiscal discipline will remain intact, pressure on Gilts may continue.
Interestingly, Sterling itself remained relatively calm despite the bond market volatility. That divergence suggests markets are currently treating the UK as a riskier fixed-income story rather than a full-blown currency crisis. In FX markets today, Loonie is the strongest performer, supported by elevated oil prices, followed by Dollar and Aussie. Swiss Franc is the weakest, followed by Kiwi and Yen,. Overall, today’s market tone reflects controlled nervousness rather than outright panic.
In Europe, at the time of writing, FTSE is up 0.04%. DAX is down -0.30%. CAC is down -0.88%. UK 10-year yield is up 0.09 at 5.002. Germany 10-year yield is up 0.034 at 3.041. Earlier in Asia, Nikkei fell -0.47%. Hong Kong HSI rose 0.05%. China Shanghai SSE rose 1.08%. Singapore Strait Times rose 0.42%. Japan 10-year JGB yield rose 0.049 to 2.525.
Silver Refuses to Break Despite Dollar Rebound, But Bulls Still Need One More Catalyst
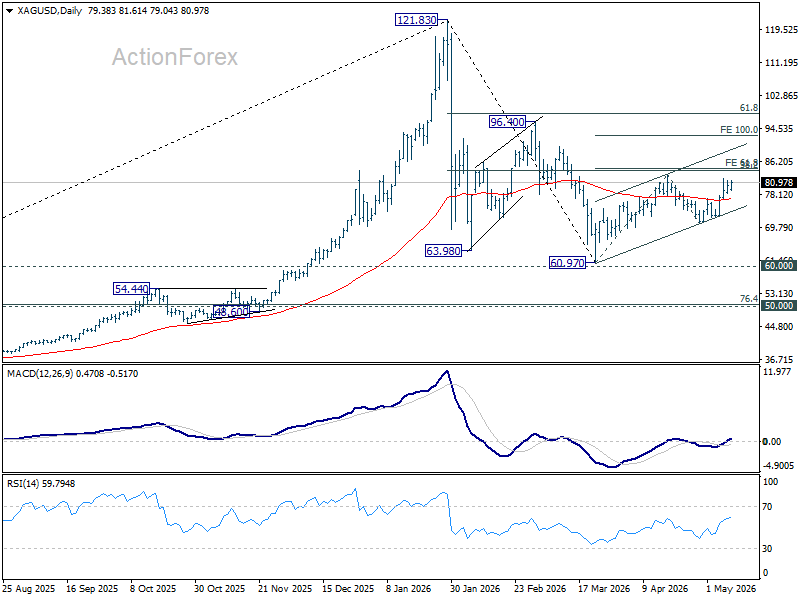
Silver continues holding above $80 despite renewed Dollar strength and rising oil prices, signaling that underlying bullish pressure remains intact. However, momentum from the rally off 70.83 is beginning to fade, leaving markets searching for the next catalyst that could drive a breakout above the critical 84.21–84.46 resistance zone. Read More.
BoE’s Greene Says Waiting on Iran War Is Better Than Rushing Rate Hikes
BoE policymaker Megan Greene warned that the Iran conflict has created a fresh energy shock that could simultaneously push inflation higher and growth lower. While she argued Britain’s weak economy should limit stronger second-round inflation effects, Greene said policymakers should wait before rushing toward further rate hikes. Read More.
China Inflation Heats Up as PPI Hits 45-Month High
China’s inflation rebound accelerated sharply in April, with producer prices hitting a 45-month high and consumer inflation also beating expectations. Rising fuel costs helped drive the move, but core inflation data suggested price pressures are now spreading more broadly across the economy. The data strengthens the view that China’s long deflation cycle may finally be ending. Read More.
GBP/USD Mid-Day Outlook
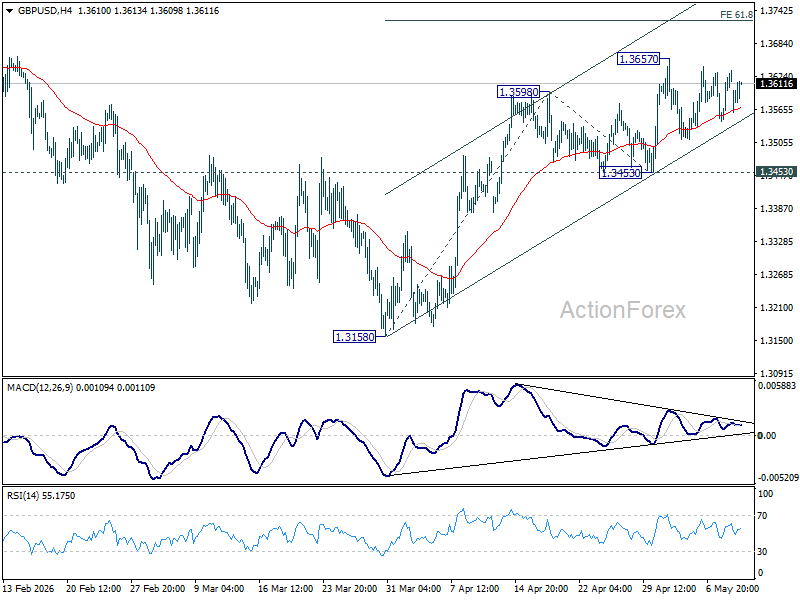
Daily Pivots: (S1) 1.3568; (P) 1.3602; (R1) 1.3659; More...
Range trading continues in GBP/USD and intraday bias stays neutral for the moment. With 1.3453 support intact, further rise is expected. On the upside, break of 1.3657 will target 61.8% projection of 1.3158 to 1.3598 from 1.3453 at 1.3725 first. Firm break there will target a retest on 1.3867 high.
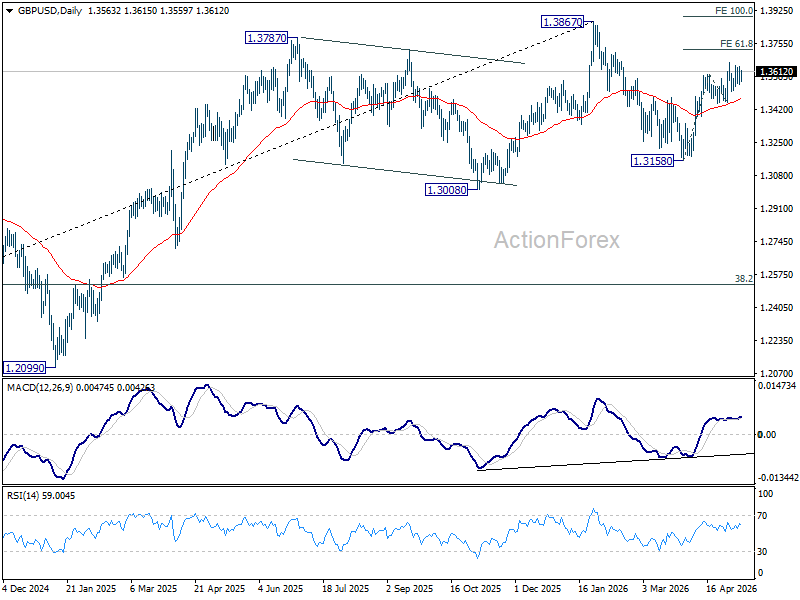
In the bigger picture, current development suggests that price actions from 1.3867 are merely a corrective pattern within the broader up trend from 1.0351 (2022 low). With 1.3008 support intact, medium term bullishness is maintained and break of 1.3867 is in favor for a later stage, towards 1.4248 key resistance (2021 high).
Silver Refuses to Break Despite Dollar Rebound, But Bulls Still Need One More Catalyst
Silver bulls are quietly winning an important battle — even if prices are not exploding higher yet. Under normal market conditions, Silver should have suffered a much deeper pullback by now. Dollar has rebounded broadly after US-Iran peace talks stalled over the weekend. Oil prices have surged back above 105, reviving inflation fears and reducing expectations that global central banks can quickly pivot dovish again. Yet Silver is still holding firmly above the $80 level.
That resilience matters. The rally from 70.83 is clearly beginning to lose momentum, and the easy part of the move may already be behind the market. But what stands out is that sellers still cannot force a meaningful breakdown despite a macro backdrop that has temporarily turned less supportive for precious metals. Instead of collapsing, Silver is consolidating strength.
Part of the explanation is that investors still see a powerful longer-term structural story underneath the market. Geopolitical uncertainty remains elevated. Inflation risks tied to energy markets have not disappeared. Industrial demand linked to electrification, solar infrastructure, and AI-related expansion continues supporting the broader outlook for Silver consumption. That combination is keeping underlying bullish pressure alive even while short-term momentum fades.
The next major move, however, likely needs a fresh catalyst. One of the most bullish developments for Silver could eventually be peace in the Middle East. A genuine US-Iran breakthrough would likely pull oil prices sharply lower, soften inflation fears, reduce pressure on global central banks to stay hawkish, and weaken Dollar in the process. That macro chain reaction could become exactly the type of environment needed to reignite Silver’s rally.
Alternatively, the market could get a more Silver-specific shock. Supply disruptions, tighter physical inventories, or another acceleration in industrial demand could quickly push prices higher again. Unlike Gold, Silver sits at the intersection of both monetary and industrial demand, making it particularly sensitive to sudden supply-demand imbalances.
Technically, Silver could be approaching an extremely important test. Another temporary dip below 80 cannot be ruled out, especially if Dollar strength extends a little further. But unless 76.95 resistance turned support gives way decisively, such weakness may ultimately prove more of a stop-clearing move than a genuine bearish reversal.
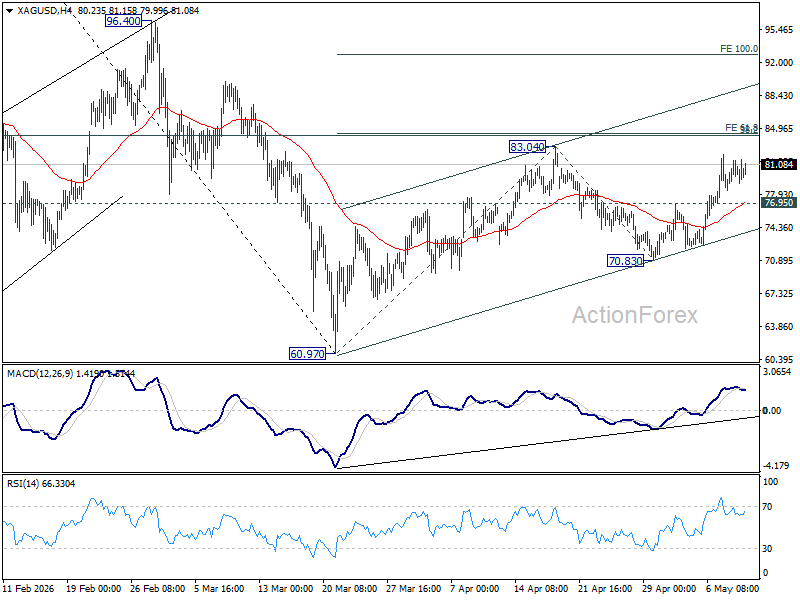
The real battle lies ahead in the 84.21–84.46 resistance zone. This cluster combines 100% projection of 60.97 to 83.04 from 70.83 at 84.46 and 38.2% retracement of 121.83 to 60.97 at 84.21, and effectively represents the line separating consolidation from a much larger bullish breakout. Silver could continue grinding gradually higher if Dollar recovery fades. But to break decisively through that zone, bulls probably need something bigger than technical momentum alone. They need a new macro shock powerful enough to push the market into its next phase.
BoE’s Greene Says Waiting on Iran War Is Better Than Rushing Rate Hikes
Bank of England policymaker Megan Greene said it is worth waiting "a little while" to see how the Iran conflict develops before deciding whether interest rates need to rise, warning that the latest energy shock has shifted inflation risks “entirely on the upside.” Speaking in a Bloomberg podcast interview published Monday, Greene said policymakers need more time to assess how the war will "propagate through the economy" before making another move on rates.
Greene described the current environment as particularly difficult for central banks because the UK is now facing a negative supply shock that could simultaneously lift inflation and weaken growth. “We've now had a negative supply shock, an energy shock, and that stands to push inflation up and growth down,” she said, calling it “a terrible situation for a central banker to be in.”
At the same time, Greene suggested Britain’s weak economy and looser labor market should help contain stronger second-round inflation effects. Still, she cautioned that inflation progress had already been slowing before the Iran conflict escalated, suggesting underlying price pressures were proving more persistent even before the latest energy-driven shock hit the economy.
GBP/USD Trades Sideways, USD/CAD Rally Still Looks Strong
GBP/USD is attempting a consolidation phase above 1.33500. USD/CAD is showing positive signs and might aim for more gains above 1.3725.
Important Takeaways for GBP/USD and USD/CAD Analysis Today
- The British Pound started a recovery wave above 1.3515 and 1.3550.
- There is a key bearish trend line forming with resistance near 1.3620 on the hourly chart of GBP/USD at FXOpen.
- USD/CAD rallied above 1.3650 and 1.3680 before the bears appeared.
- There was a break above a bearish trend line with resistance at 1.3695 on the hourly chart at FXOpen.
GBP/USD Technical Analysis
On the hourly chart of GBP/USD at FXOpen, the pair started a fresh decline from 1.3635 after a decent increase. The British Pound traded below 1.3600 to again move into a short-term bearish zone against the US Dollar.
The pair even traded below 1.3580 and the 50-hour simple moving average. Finally, the bulls appeared near 1.3550. A low was formed near 1.3547, and the pair is now attempting a short-term recovery wave.
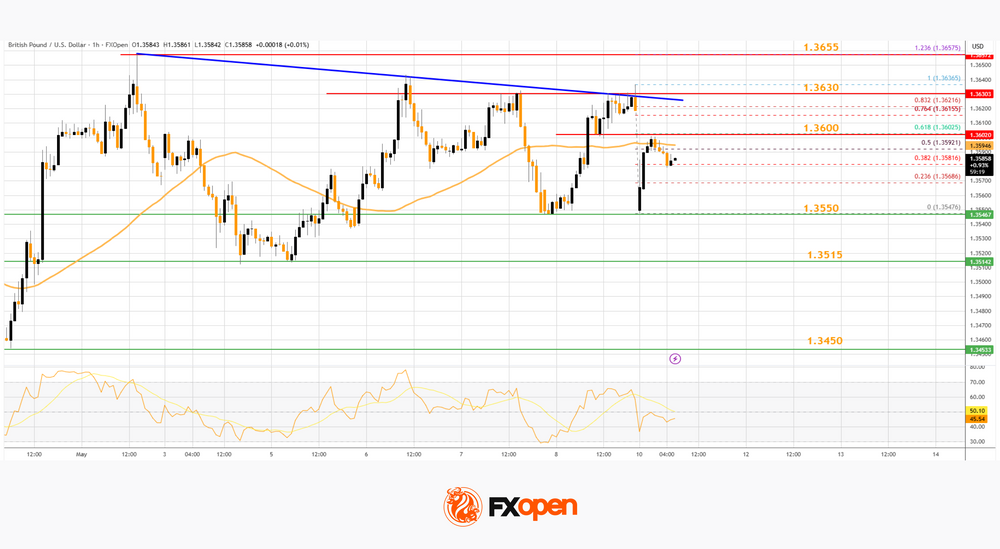
There was a fresh upside above 1.3580 and the 50% Fib retracement level of the downward move from the 1.3636 swing high to the 1.3547 low. The pair is now showing positive signs above 1.3550. Immediate resistance on the upside is near the 61.8% Fib retracement level at 1.3600 or the 50-hour simple moving average.
The first major hurdle for the bulls on the GBP/USD chart is near a bearish trend line at 1.3620. A close above 1.3620 might spark a decent increase. The next stop for the bulls might be 1.3655. Any more gains could lead the pair toward 1.3710 in the near term.
Initial support sits at 1.3550. The next key area of interest might be 1.3515, below which there is a risk of another sharp decline. In the stated case, the pair could drop toward 1.3450.
USD/CAD Technical Analysis
On the hourly chart of USD/CAD at FXOpen, the pair formed a strong support base above the 1.3580 level. The US Dollar started a fresh increase above 1.3635 against the Canadian Dollar.
The pair cleared the 50-hour simple moving average, climbed above 1.3650, and surpassed a bearish trend line at 1.3695. The last swing high was formed at 1.3723, and the pair is now showing positive signs above the 23.6% Fib retracement level of the upward move from the 1.3579 swing low to the 1.3723 high.
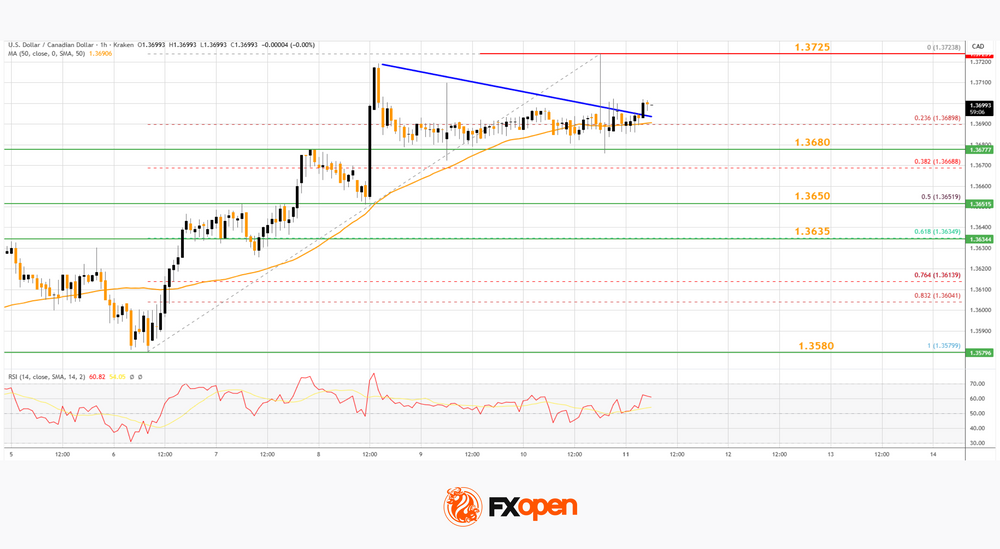
On the upside, Initial resistance sits near 1.3725. The main breakout zone could be 1.3740. A clear upside break above 1.3740 could start another steady increase.
The next major stop for the bulls might be 1.3800. Any more gains could open the doors for a test of 1.4000. If there is a pullback, the pair could find bids near 1.3680 or the 50-hour simple moving average. A downside break below 1.3680 might send the pair toward the 50% Fib retracement at 1.3650.
The next major area on the same USD/CAD chart could be 1.3580. A close below 1.3580 could push the pair further lower. In the stated case, the bears might aim for a test of 1.3500.
Trade over 50 forex markets 24 hours a day with FXOpen. Take advantage of low commissions, deep liquidity, and spreads from 0.0 pips (additional fees may apply). Open your FXOpen account now or learn more about trading forex with FXOpen.
This article represents the opinion of the Companies operating under the FXOpen brand only. It is not to be construed as an offer, solicitation, or recommendation with respect to products and services provided by the Companies operating under the FXOpen brand, nor is it to be considered financial advice.
GBP/JPY Daily Outlook
Daily Pivots: (S1) 212.65; (P) 213.17; (R1) 214.05; More...
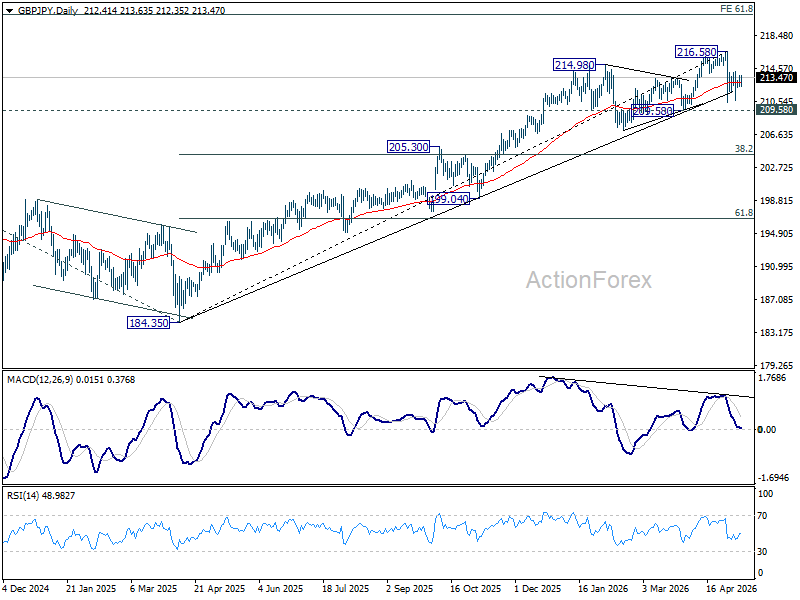
Range trading continues in GBP/JPY and intraday bias stays neutral. On the downside, below 210.43 will extend the fall from 216.58 to 209.58 support first. However, firm break of 214.21 will argue that the pullback from 216.58 has completed, and turn bias back to the upside for retesting this high.
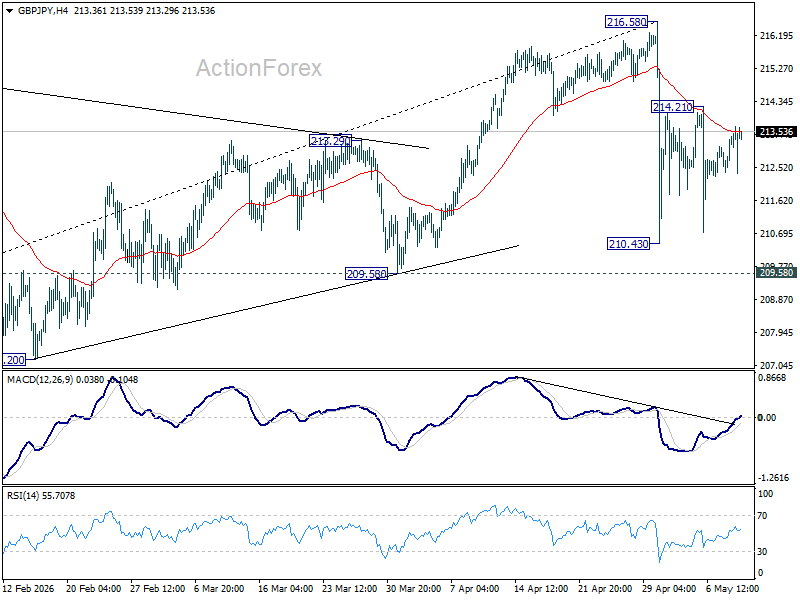
In the bigger picture, while the fall from 216.58 is steep, there is no clear sign of trend reversal yet. The long term up trend could still extend to 61.8% projection of 148.93 (2022 low) to 208.09 (2024 high) from 184.35 at 220.90 on resumption. However, sustained break of 55 W EMA (now at 205.75) will argue that it's already in medium term down trend for 184.35 support.
EUR/JPY Daily Outlook
Daily Pivots: (S1) 183.99; (P) 184.36; (R1) 184.99; More...
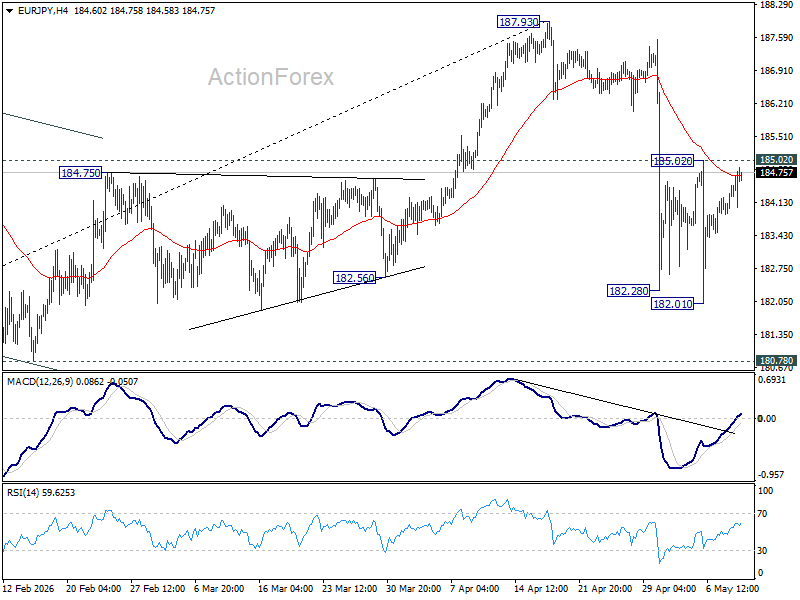
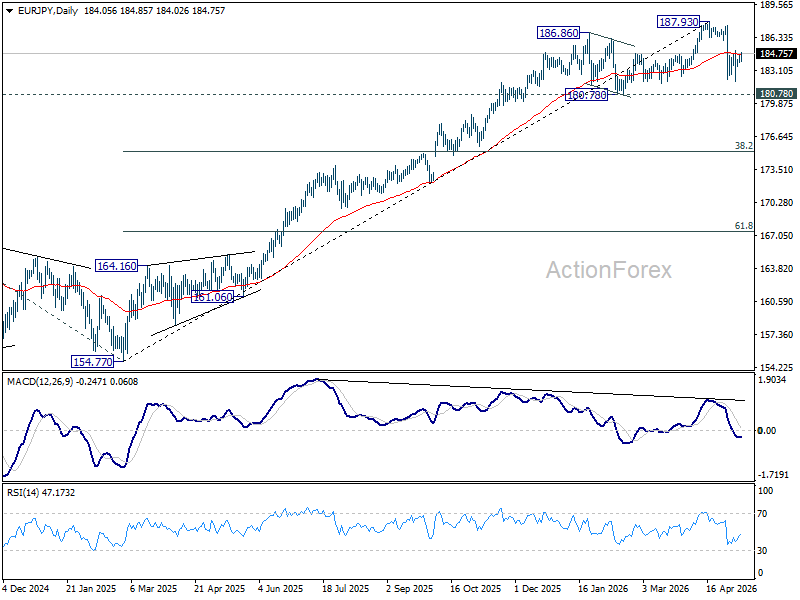
Intraday bias in EUR/JPY stays neutral at this point, and more sideway trading could be seen. On the downside, break of 182.01 will extend the fall from 187.93 to 180.78 support. Nevertheless, firm break of 185.02 will suggest that pullback from 187.93 has completed, and turn bias back to the upside for retesting this high.
In the bigger picture, the pullback from 187.93 is steep, there is no sign of reversal yet. Uptrend from 114.42 is still expected to resume at a later stage to 78.6% projection of 124.37 (2022 low) to 175.41 (2025 high) from 154.77 at 194.88. However, sustained break of 55 W EMA (now at 178.04) will argue that it's already in a medium term down trend to 175.41 resistance turned support and below.
EUR/GBP Daily Outlook
Daily Pivots: (S1) 0.8636; (P) 0.8645; (R1) 0.8653; More…
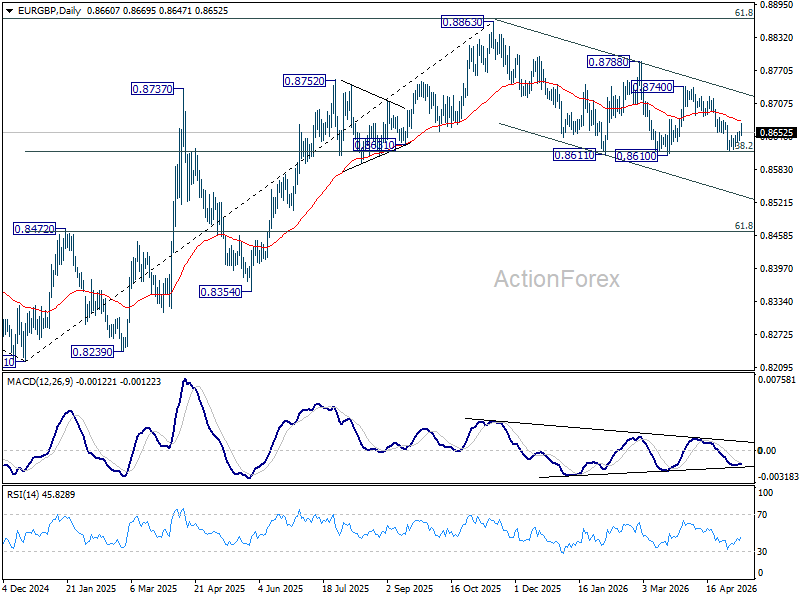
Intraday bias in EUR/GBP remains neutral as consolidations continue above 0.8618. On the downside, firm break of 0.8610 will carry larger bearish implications and pave the way to 0.8466 fibonacci level next. Nevertheless, firm break of 0.8676 will turn bias back to the upside for stronger rebound back to 0.8740 resistance instead.
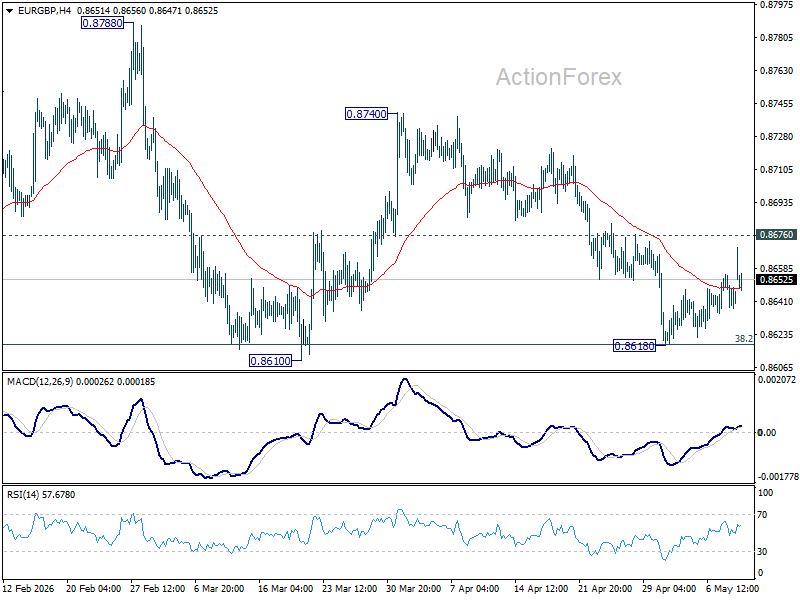
In the bigger picture, focus is back on 38.2% retracement of 0.8821 to 0.8863 at 0.8618. Sustained break there will confirm that whole rise from 0.8221 has completed at 0.8863. Deeper decline should then be seen to 61.8% retracement at 0.8466 at least. For now, risk will stay mildly on the downside as long as 55 D EMA (now at 0.8677) holds, in case of recovery.
EUR/AUD Daily Outlook
Daily Pivots: (S1) 1.6237; (P) 1.6261; (R1) 1.6281; More...
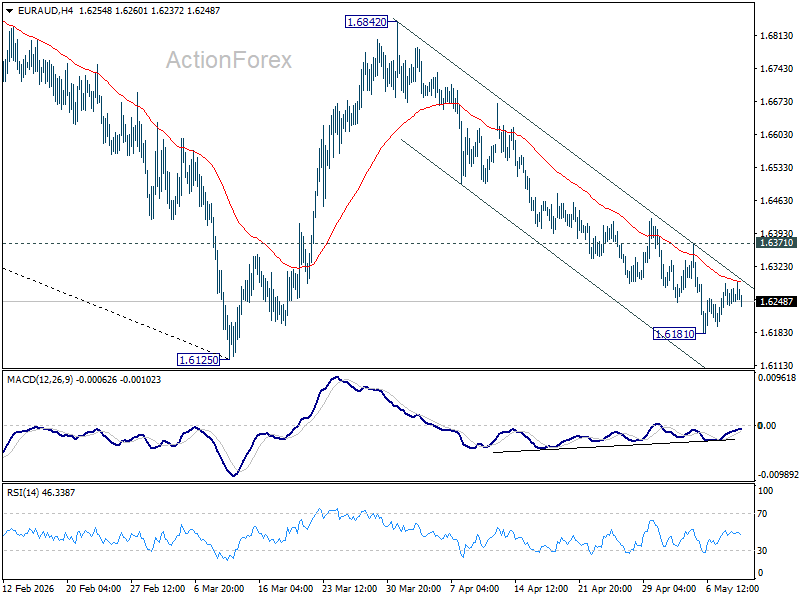
Intraday bias in EUR/AUD remains neutral for consolidations above 1.6181. On the downside, decisive break of 1.6125 will resume larger fall from 1.8554. Nevertheless, break of 1.6371 resistance will indicate short term bottoming, and turn bias back to the upside for stronger rebound to 55 D EMA (now at 1.6516).
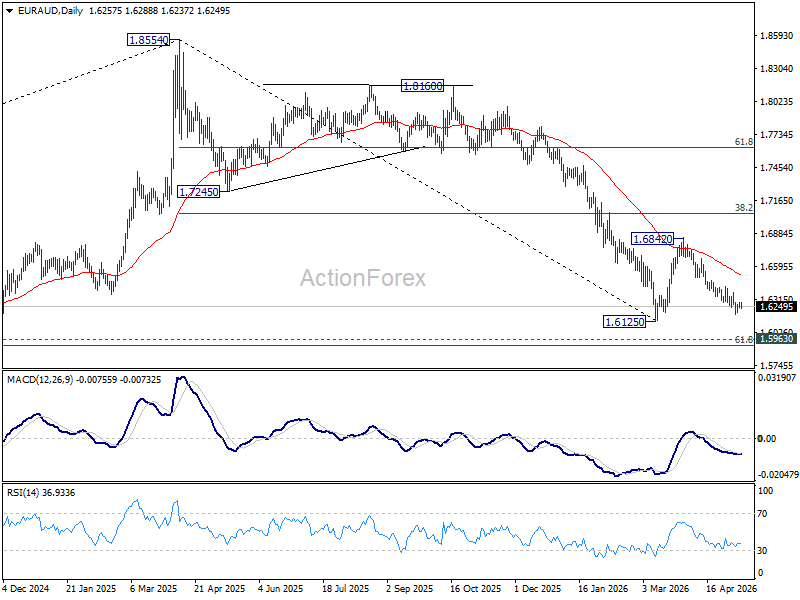
In the bigger picture, fall from 1.8554 (2025 high) is in progress and deeper decline should be seen to 61.8% retracement of 1.4281 to 1.8554 at 1.5913, which is slightly below 1.5963 structural support. Decisive break there will pave the way back to 1.4281 (2022 low). For now, risk will stay on the downside as long as 55 W EMA (now at 1.7039) holds, even in case of strong rebound.
EUR/CHF Daily Outlook
Daily Pivots: (S1) 0.9134; (P) 0.9147; (R1) 0.9161; More....
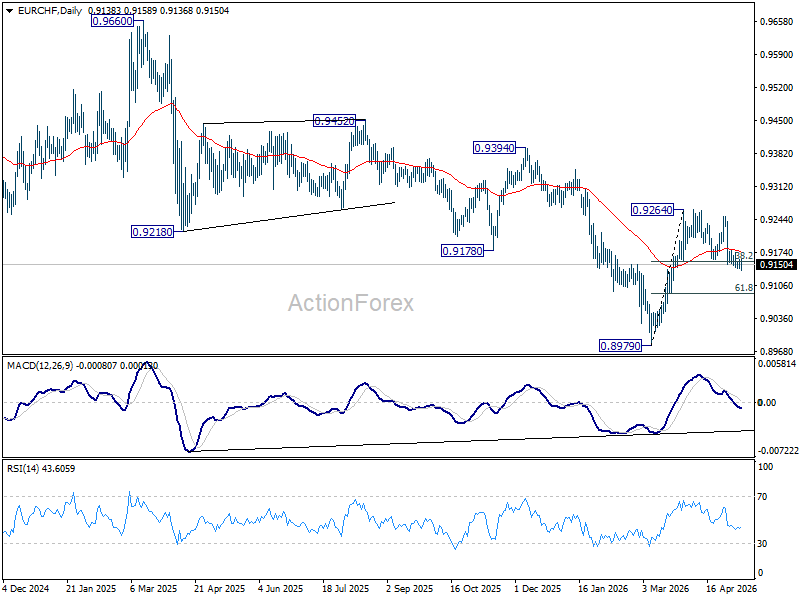
EUR/USD is still struggling in tight range around 0.9155 cluster support (38.2% retracement of 0.8979 to 0.9264 at 0.9155). Intraday bias remains neutral a this point. On the upside, break of 0.9177 minor resistance will turn bias back to the upside for 0.9264 resistance. However, sustained trading below 0.9155 will turn bias back to the downside for deeper pullback to 61.8% retracement at 0.9088 and possibly below.
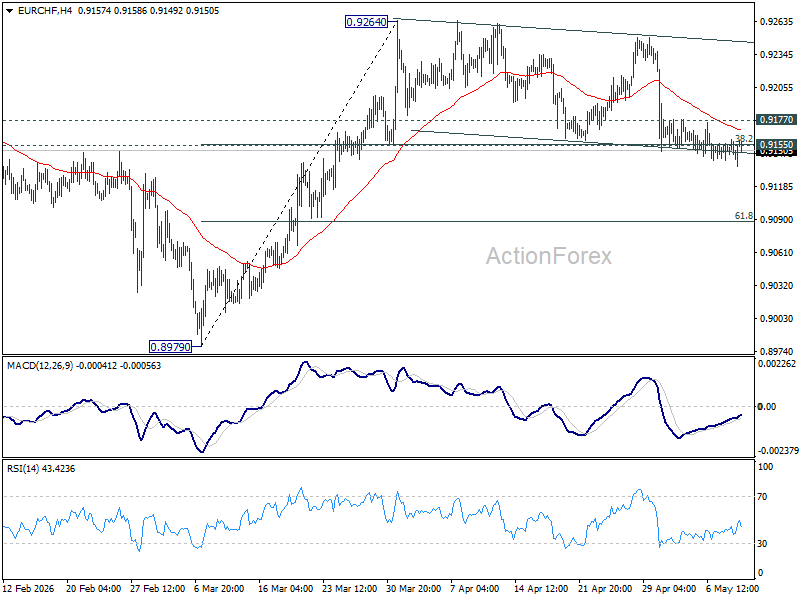
In the bigger picture, considering bullish convergence condition in W MACD, a medium term bottom should be in place at 0.8979. Sustained trading above 55 W EMA (now at 0.9241) will add more credence to this case. Further break of 0.9394 resistance will pave the way to 0.9660 resistance next. However rejection by the 55 W EMA will set up another fall through 0.8979 low at a later stage.
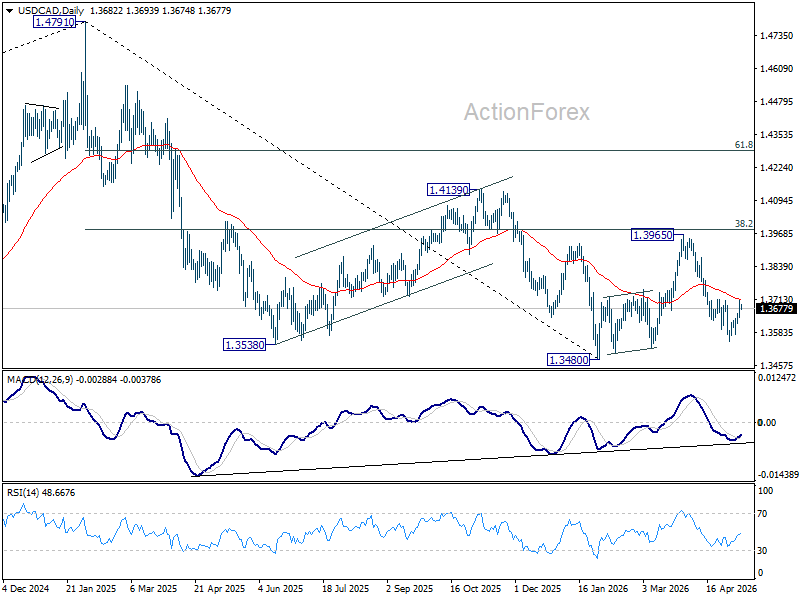
USD/CAD Daily Outlook
Daily Pivots: (S1) 1.3642; (P) 1.3675; (R1) 1.3709; More...
Intraday bias in USD/CAD remains neutral for the moment. On the downside, below 1.3549 will extend the fall from 1.3965 to retest 1.3480 low. Decisive break there will resume whole down trend from 1.4791. However, sustained break of 1.3709 will confirm short term bottoming, and turn bias back to the upside for 1.3965 resistance again.
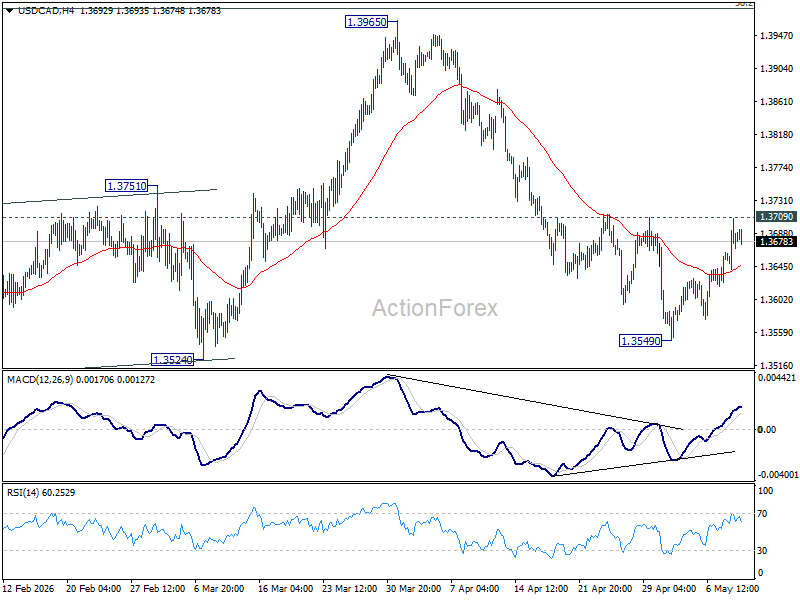
In the bigger picture, price actions from 1.4791 are seen as a corrective pattern to the whole up trend from 1.2005 (2021 low). Deeper fall could be seen, as the pattern extends, to 61.8% retracement of 1.2005 to 1.4791 at 1.3069. However, decisive break of 38.2% retracement of 1.4791 to 1.3480 at 1.3981 will argue that the correction has completed with three waves down to 1.3480 already.