Sample Category Title
Canada’s Economy Likely Started Q2 on a Stronger Footing
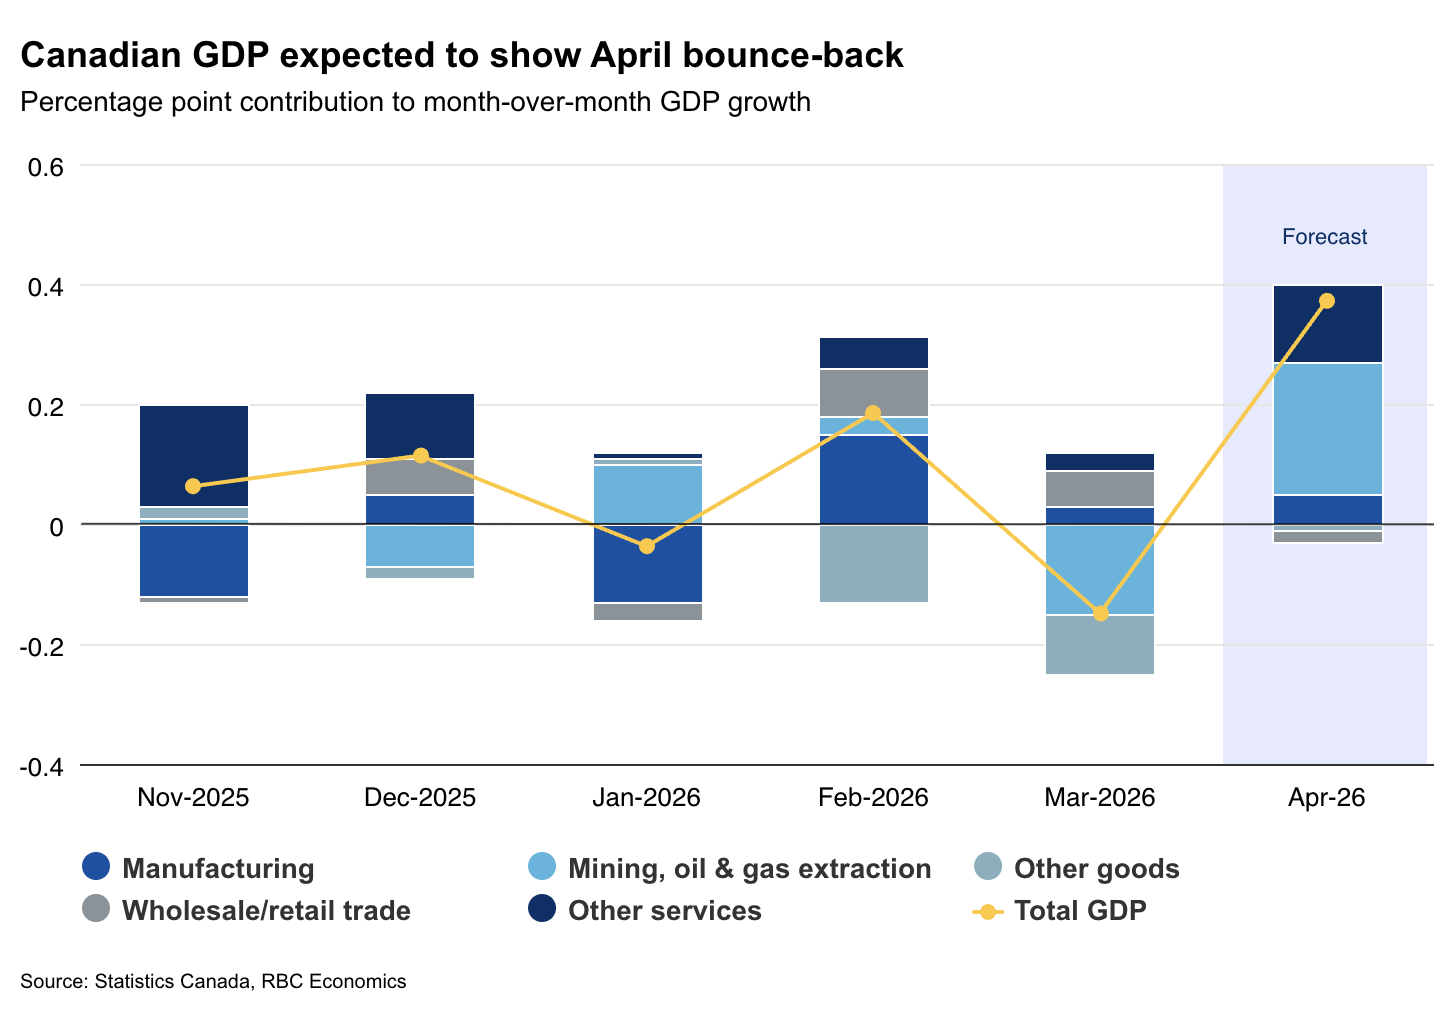
We expect real gross domestic product in Canada to show a 0.4% increase in April on Tuesday after stagnating for two straight quarters.
That would be consistent with Statistics Canada’s preliminary estimate a month ago, although we expect it was led by a relatively narrow rebound in mining, oil and gas extraction.
Early data is pointing to a significant increase in non-conventional oil extraction and oil drilling in April. Adding in a pickup in manufacturing GDP, goods-producing sectors overall likely expanded by 1%.
Service sector GDP is expected to have gained 0.1% with weaker wholesales (-0.3%), and flat retail GDP offset by growth in other industries including real estate and rentals after Canadian home resales ticked higher (seasonally adjusted) in April for the first time since October 2025.
Preliminary monthly GDP data has been highly revision-prone, but overall, data has been pointing to a firming in economic activity in Q2 with early May data also looking broadly better..
Labour market data in May firmed, and the housing market continued to show signs of thawing with resales up 5.1% from April (the largest increase since October 2024).
StatCan’s advanced indicators also pointed to rising nominal retail and manufacturing sales in May, the former consistent with our card transactions tracker suggesting resilient, albeit slightly weaker spending growth.
And, global oil prices have moved lower in recent weeks. If sustained, those declines will help to restore some household purchasing power eroded by higher fuel costs, while also limiting risks of inflation spreading beyond energy prices.
BoC to stay on hold in 2026
The combination of signs of firming Q2 GDP growth, and easing inflation pressures should help to validate the Bank of Canada’s call to not overreact to temporarily higher oil prices or mechanically softer economic data. With growth picking up in Q2 and core inflation remaining subdued, we continue to expect no change in interest rates from the central bank in 2026.
South of the border, the U.S. Federal Reserve tilted decidedly hawkish in their latest meeting—first under new Chair Kevin Warsh. Half of the FOMC (excluding Warsh) expected at least one rate hike in 2026, prompted by concerns over sticky-to-accelerating core inflation readings while labour markets remain robust.
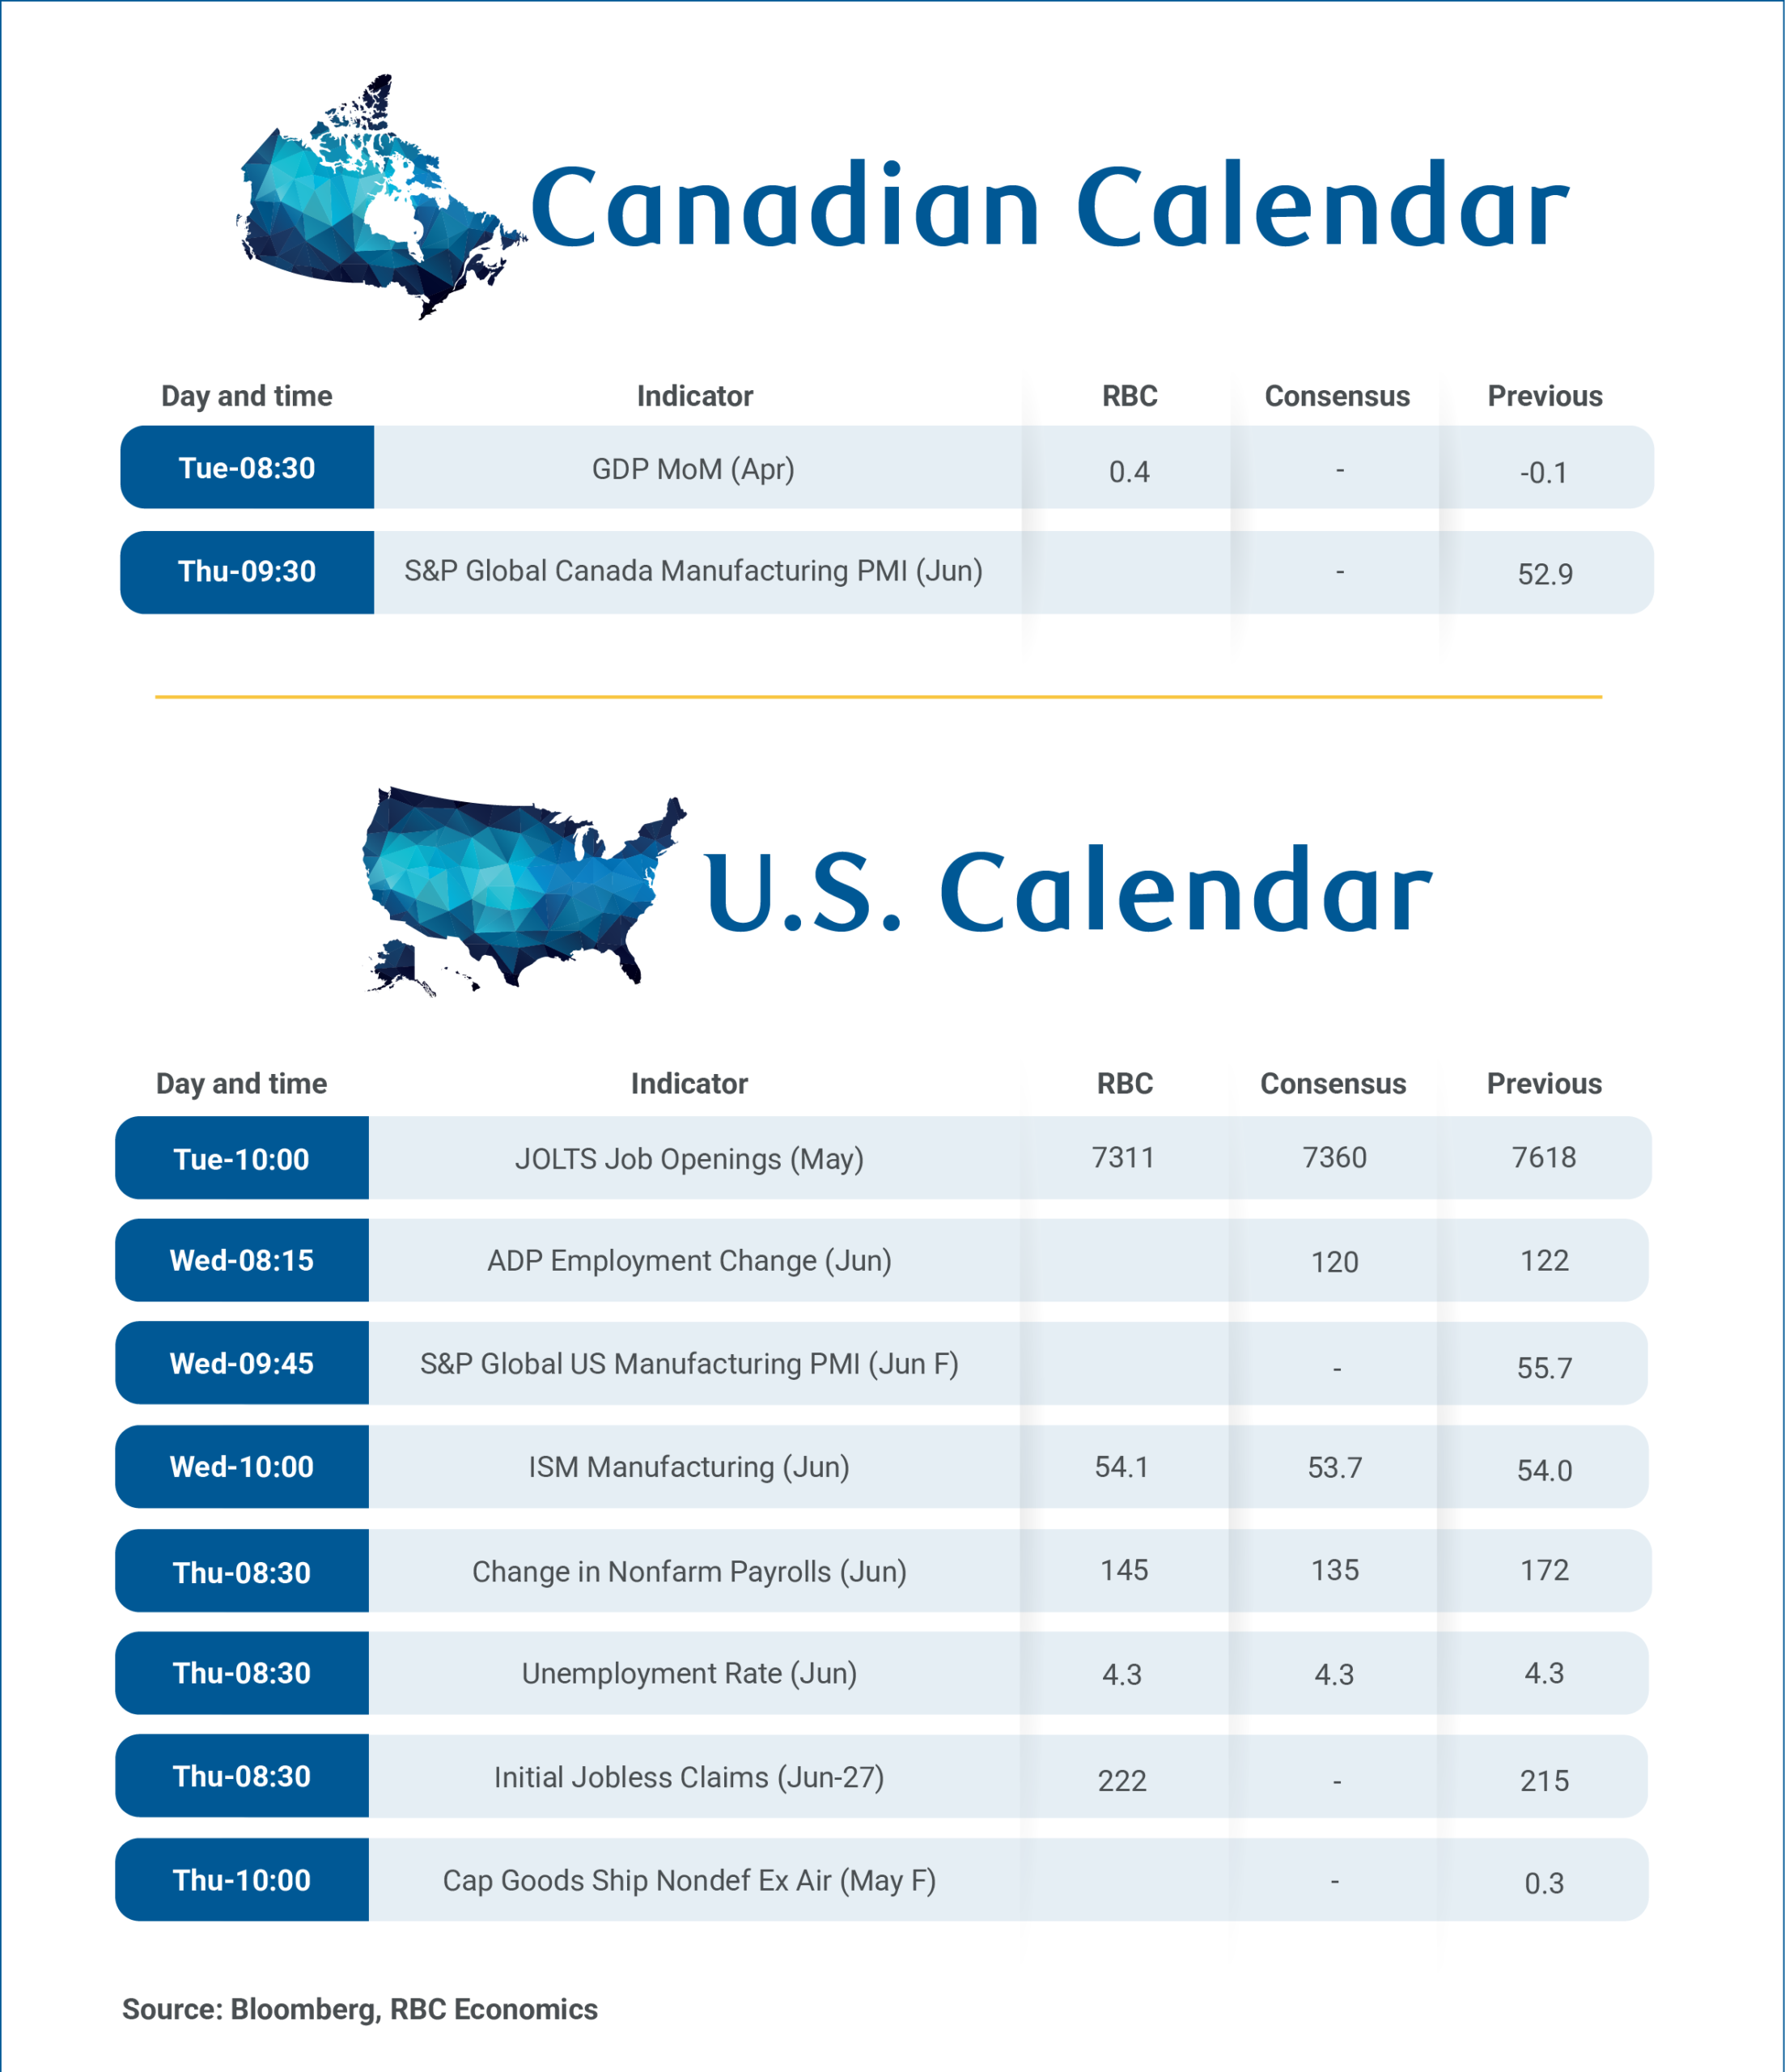
On Thursday, we expect May’s U.S. employment report to broadly reinforce that view with a 145,000 payrolls’ gain, alongside a steadily low 4.3% unemployment rate.
Week Ahead – NFP Report to Challenge Dollar Strength and the Hawkish Fed
- Dollar strength dominates markets, as the hawkish Fed overshadows geopolitics and lower oil prices.
- NFP week could drive September Fed hike expectations and boost market volatility.
- The euro lacks fresh bullish catalysts, all eyes on the preliminary inflation report and the ECB Forum.
- Peripheral currencies seek a reprieve; yen intervention looms while the pound awaits the new PM.
Dollar reaction surprises investors
The end of the Middle East conflict and the steps made so far towards securing a comprehensive deal over the next five weeks – with oil prices dropping aggressively but maintaining a small risk premium – has allowed investors to focus elsewhere.
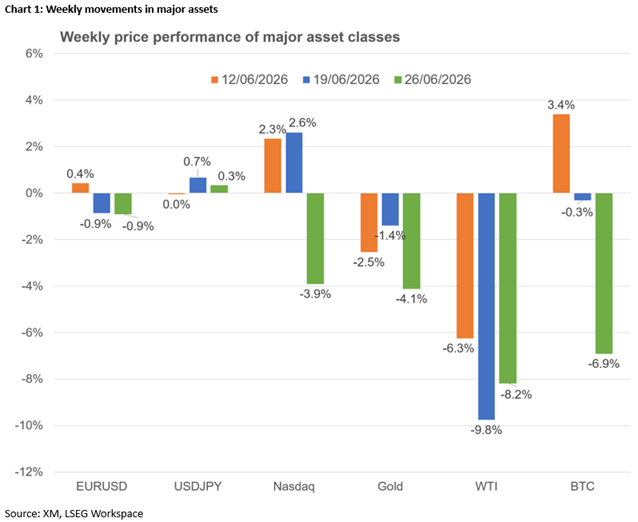
Contrary to expectations, the greenback has been the main protagonist lately. The dollar index has posted its best two-week performance since mid-March – at the height of the US-Iran-Israel conflict – outperforming every major currency this week, with euro/dollar dropping to a fresh one-year low.
The recent Fed meeting, with Chair Warsh bashing forward guidance and announcing committees to revamp the Fed, was hawkish enough to prompt a jump in rate hike expectations. There is currently a 72% chance of a 25bps rate hike in September, with next week's US data potentially upsetting these expectations.
The prospects of higher funding costs and the lingering valuation concerns have put equities on the back foot, with the mighty technology stocks bearing the brunt. Interestingly, equity bulls have yet to treat the current weakness as an opportunity to enter long positions, confirming market angst.
While US Treasury yields dropped this week, mostly benefiting from the muted risk-off sentiment, but yield spreads remain favourable for the dollar, could the greenback maintain its current trajectory?
A data-heavy week is upon us. Combined with the holiday-shortened week in the US, due to the July 3 bank holiday, and the month-end, quarter-end and half-year-end rebalancing flows, volatility could rise aggressively, influencing traders' behaviour.
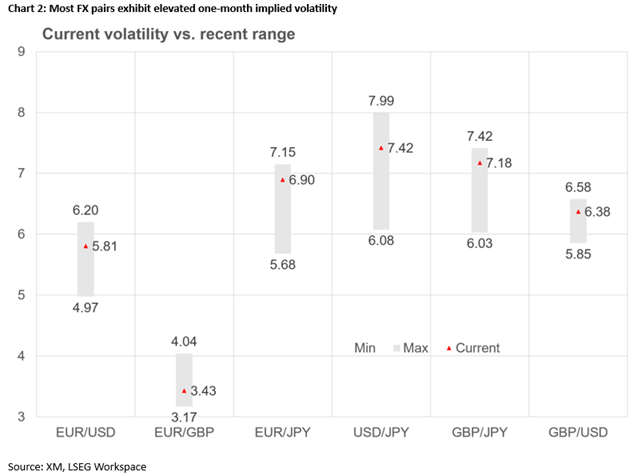
All eyes are on Thursday's NFP release
Tuesday's CB Consumer Confidence index could continue its upward trend, confirming the positive state of the US consumer, while the prices paid subindex of Wednesday's ISM Manufacturing PMI should offer valuable insight into inflation pressures.
Tuesday's JOLTS report, the Challenger Job Cuts and the ADP employment reports on Wednesday could prove the best appetizer for Thursday's nonfarm payroll report. As already noted, Friday's data releases have been transferred to Thursday, July 2, thus shrinking the trading session.
Following a decent run of job-related data, with the three-month NFP average rising to 188k that is the highest rate since Q1-2024, most Fed members believe that the jobs market is healthy without fuelling inflation. A series of significant downside data surprises might change their minds, upsetting rate hike expectations.
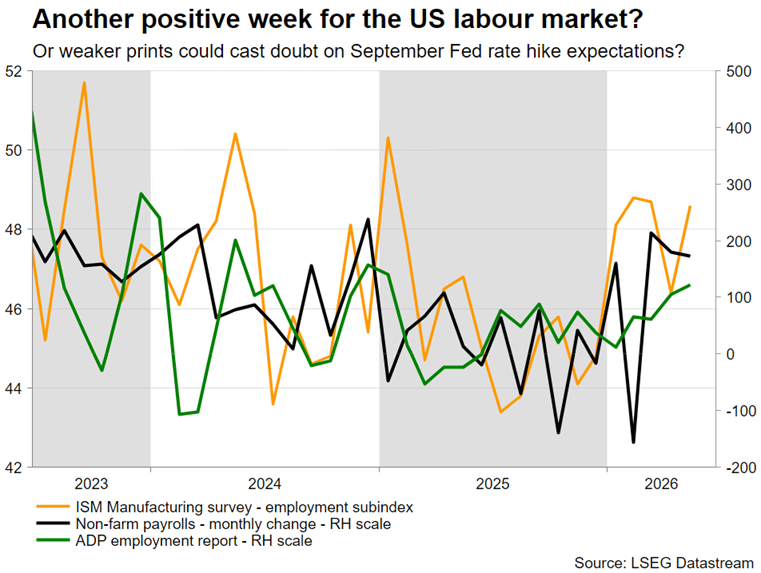
Notably, the dollar seems to be benefiting under both risk-on and risk-off scenarios at this stage. Lower chances of a September hike could boost equity indices and attract fresh inflows into US dominated funds seeking exposure in the technology sector. On the flip side, strong US data would further support Fed rate hike expectations, benefiting the dollar.
Interestingly, investors are trying to adjust to the reduced Fedspeak, with many wondering if Warsh has imposed a limit on public appearances or whether Fed members are just careful not to alienate Warsh with their commentary.
The Euro seeks a bullish catalyst
The euro remains under pressure, as the lack of tailwinds is quite evident. Amidst a decent run of economic data, the impact of hawkish monetary policy has probably reached its limit. Markets are assigning an 80% chance of a September hike, but hawkish commentary has had a muted impact on the euro, as seen in this week's performance against both the dollar and the pound.
Should Wednesday's preliminary inflation report post a sizeable upside surprise, ECB hawks might increase their pressure for a July rate hike. However, with oil prices dropping around 20% in June, there is a strong probability of a significant downside surprise, suppressing July hike expectations. In this case, the euro could experience further weakness, even against the pound.
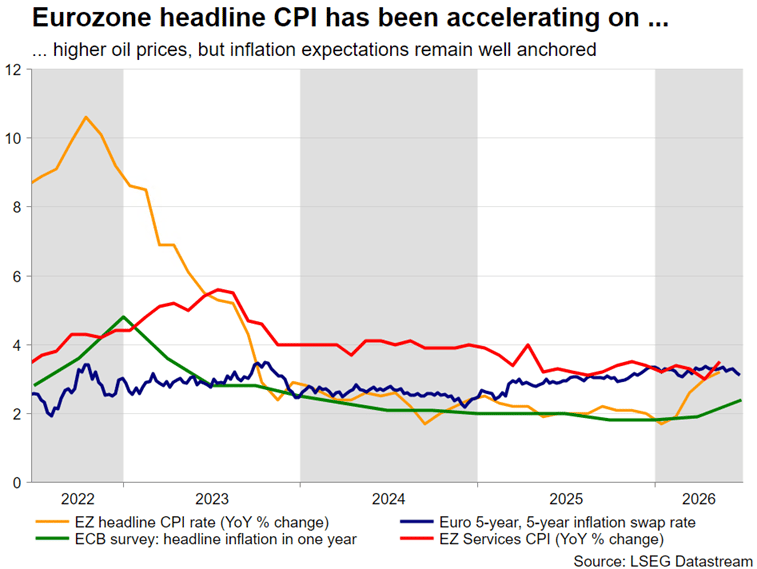
A plethora of central bankers, including President Lagarde, will be on the wires next week, as the annual ECB Forum in Sintra, Portugal is taking place from June 29 to July 1. Rumours about her early departure have receded lately, but the discussion is not over.
The Pound and Yen will remain the spotlight for different reasons
Both the pound and gilts have welcomed that other candidates decided to step aside, opening the door for Burnham, who is now expected to take office in mid-July.
This development allows the BoE to remain focused on restoring price stability, with the split between doves and hawks remaining wide, but that might change when the new PM details his economic plan. Nationalizations, higher public spending and tax increases might not be welcomed by investors, with the BoE potentially forced to focus on financial stability rather than fighting elevated inflation.
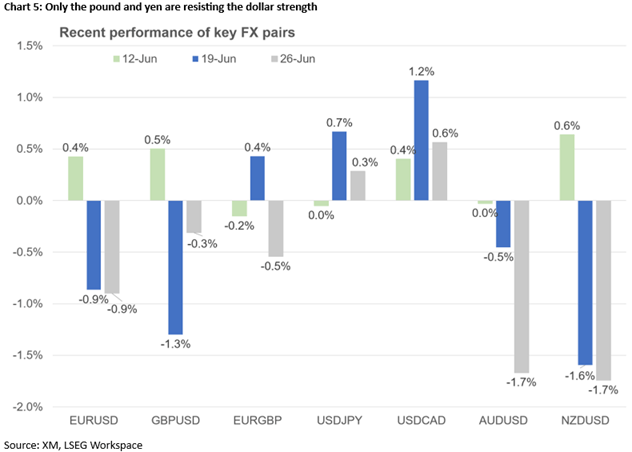
Meanwhile, the recent BoJ hike and the continued hawkish rhetoric have not reversed the yen's fate, with investors continuing to ignore the repeated verbal interventions and keeping dollar/yen above 160.
The clock is ticking down to the next intervention, but is Japan waiting for the greenlight from the US? Is PM Takaichi resisting an intervention and opposing further BoJ hikes to keep the stock market rising? Is the Finance Ministry waiting for the right date to intervene? The real reason might be a combination of the above, but with the July 3 US bank holiday coming up, questions could be answered soon.
Aussie and loonie crave a risk-on reaction – Gold suffering to continue
Peripheral currencies have been suffering from the current dollar rally and the mixed risk appetite. The aussie will be looking at the RBA minutes and strong Chinese PMI data to support rate hike expectations, while Canadian data could remain bleak, keeping the loonie under pressure and adding to the 3% losses posted over the past four weeks.
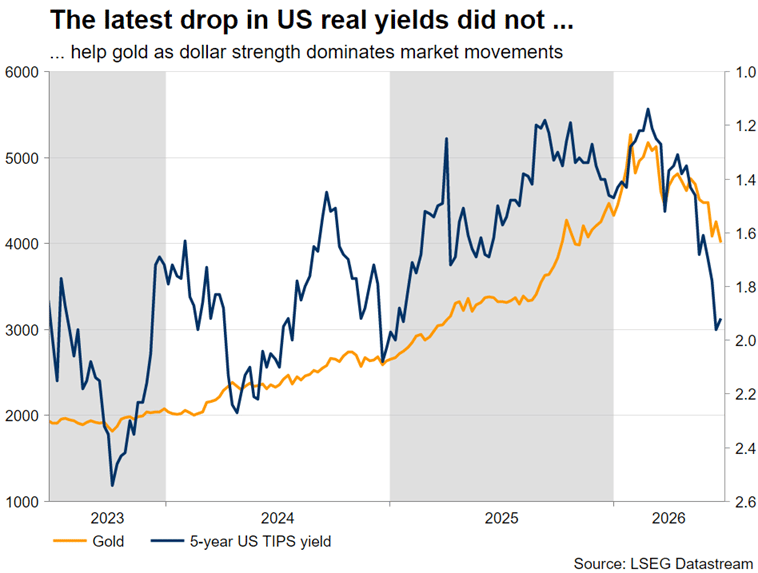
Finally, the $4,000 level is proving tougher to crack than bears expected. A move towards $4,400 is needed to reverse the current bearish sentiment, but this looks far-fetched until an acute equity market correction occurs, which would initially benefit gold, and weak US data push out Fed hike expectations.
Weekly Focus – Reversal of Stagflationary Winds
The US-Iran deal and a tech sell-off in equity markets have set the scene this week. The US-Iran deal continued to drive oil prices lower with brent oil declining to USD73 coming from USD120 at the height of the war. The peace is fragile, though, and uncertainty prevails over the opening of the Strait of Hormuz. For now, the decline in oil prices is reversing the stagflationary impulse to the global economy providing a lift to growth and lower inflation in coming months. Especially the euro zone benefits from this relative to the US, just like the euro zone was relatively harder hit by the oil shock. The reversal has also been visible in stock markets where euro stocks have outperformed US stocks lately.
The Euro outperformance was driven by AI jitters coming back to the market this week triggering losses in US tech stocks of around 5%. For now, it looks more like another bump in the road than something bigger. Investment plans in the US are still significant, and stocks are also supported by the US consumer engine that is still running and now gets tailwind from the decline in oil prices.
On the data front, US PMIs were stronger than expected with the manufacturing PMI rising from 55.1 to 55.7, the highest level since 2022. Euro PMIs also beat expectations in the composite PMI, which rose from 48.5 to 49.5 lifted by a recovery in the service PMI. The improvement should continue in the coming months as the oil shock fades again. The German Ifo index showed a small increase in the expectations index from 83.9 to 84.1. On the inflation front, US core PCE increased from 3.3% y/y to 3.4% y/y, in line with expectations. It is the highest level in nearly three years, though, and highlights the continued challenge to get US inflation back to the 2% target. The new US Fed Chairman Kevin Warsh stressed at the latest FOMC meeting that the Fed had not met its' target in more than five years indicating the Fed will tighten policy later this year. We look for a hike in December, but risks are skewed towards an earlier hike. Markets price a 50% chance the Fed lifting rates by September. Bond yields have moved lower this week, though, on the back of the decline in oil prices and jitters in the stock markets.
UK is set to have a new prime minister again after Keir Starmer announced his resignation. Nominations for leadership contest in Labour runs from 9-15 July and if no other contestants than Andy Burnham comes forward, he could take office on 17 July. If (which is very likely) Burnham becomes the next PM, the next key thing to watch will be who he chooses for chancellor. Current chancellor Rachel Reeves has been favoured by markets since her focus has been on abiding by fiscal rules. Last time rumours swirled about her departure UK yields rose significantly.
The coming week it is time for US labour market data again with the JOLTS job openings and non-farm payrolls, which is due on a Thursday this time due to national holiday on Friday ahead of 4 July. Preliminary euro CPI for June is released on Wednesday. Over the summer we have the next ECB meeting on 23 July, where we look for unchanged rates. The Fed is due to meet on 29 July where markets price a 25% probability of a hike.
EUR/USD Daily Outlook
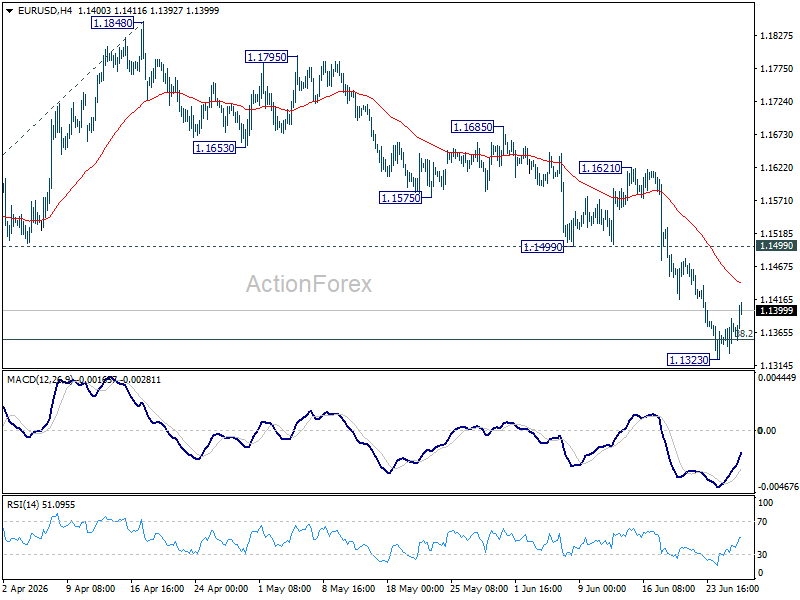
Intraday bias in EUR/USD is turned neutral with current recovery, and some consolidation would be seen above 1.1323 temporary low. Further decline is expected as long as 1.1499 support turned resistance holds. ON the downside, sustained break of 1.1353 fibonacci level will carry larger bearish implication. Next near term is 100% projection of 1.2081 to 1.1408 from 1.1848 at 1.1175.
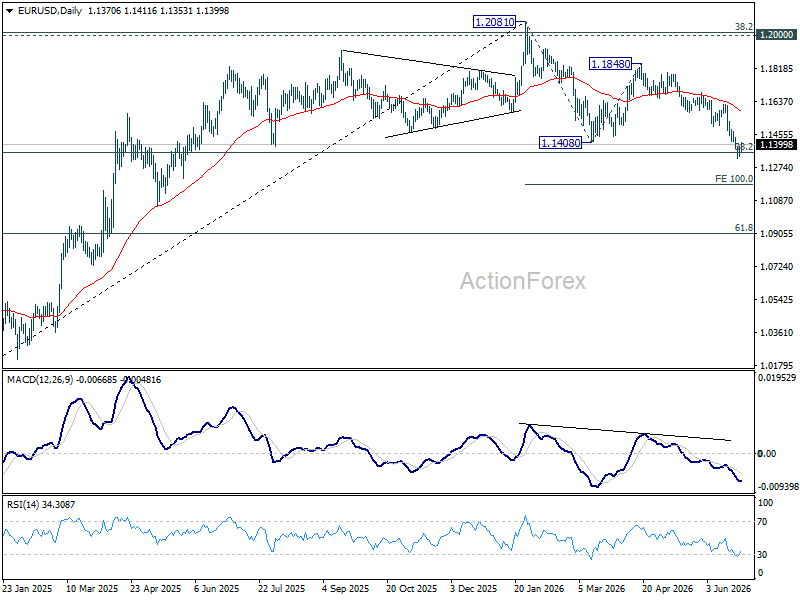
In the bigger picture, focus is back on 38.2% retracement of 1.0176 to 1.2081 at 1.1353. Decisive break there will revive the case of medium term bearish trend reversal after rejection by 1.2 key cluster resistance level. Further fall should be seen to 61.8% retracement at 1.0904. Nevertheless, strong rebound from 1.1353, followed by break of 1.1621 resistance, will retain medium term bullishness.
USD/JPY Daily Outlook
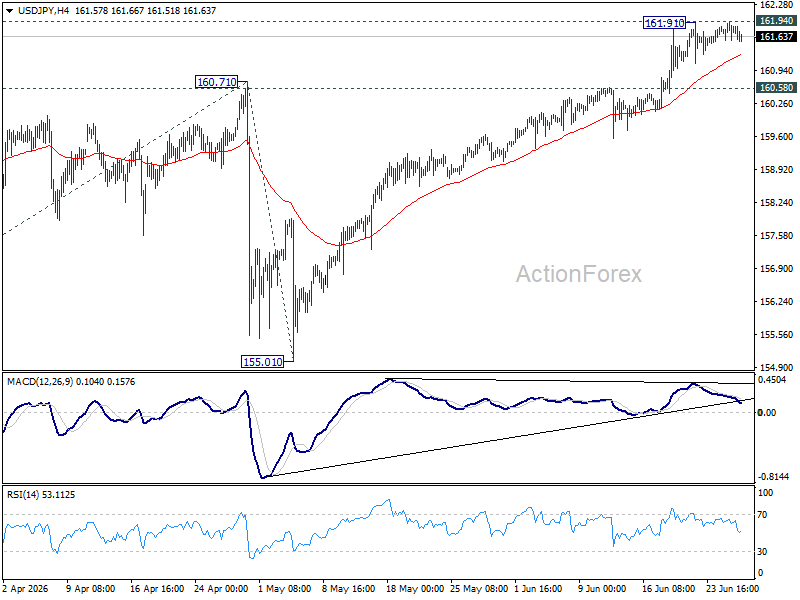
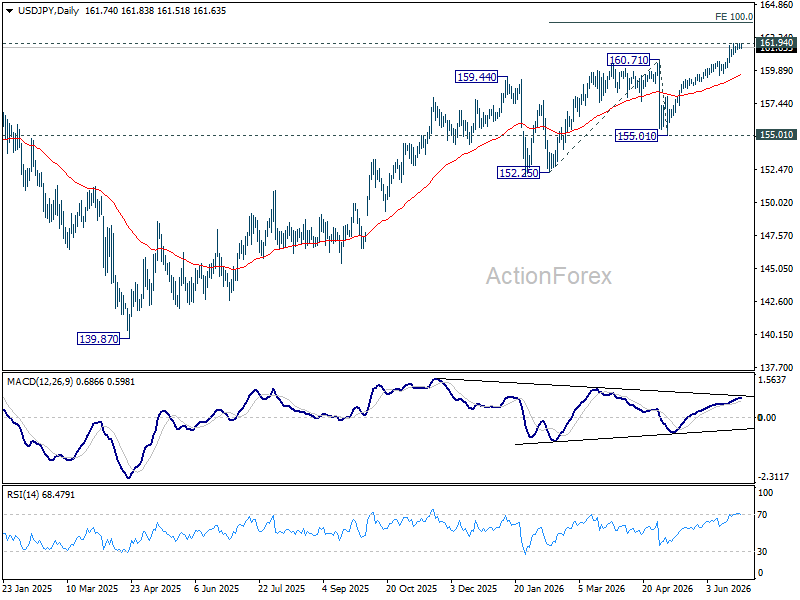
Intraday bias in USD/JPY stays neutral and outlook is unchanged. On the downside, firm break of 160.58 support should confirm short term topping, on bearish divergence condition in 4H MACD. Deeper fall should then be seen to 55 D EMA (now at 159.46) and below. Nevertheless, decisive break of 161.94 high will resume the larger up trend to 100% projection of 152.25 to 160.71 from 155.01 at 163.47 next.
In the bigger picture, for now, corrective pattern from 161.94 (2024 high) is still seen as completed at 139.87. Rise from there is seen as resuming the long term up trend. This will remain the favored case as long as 55 W EMA (now at 155.17) holds.
GBP/USD Daily Outlook
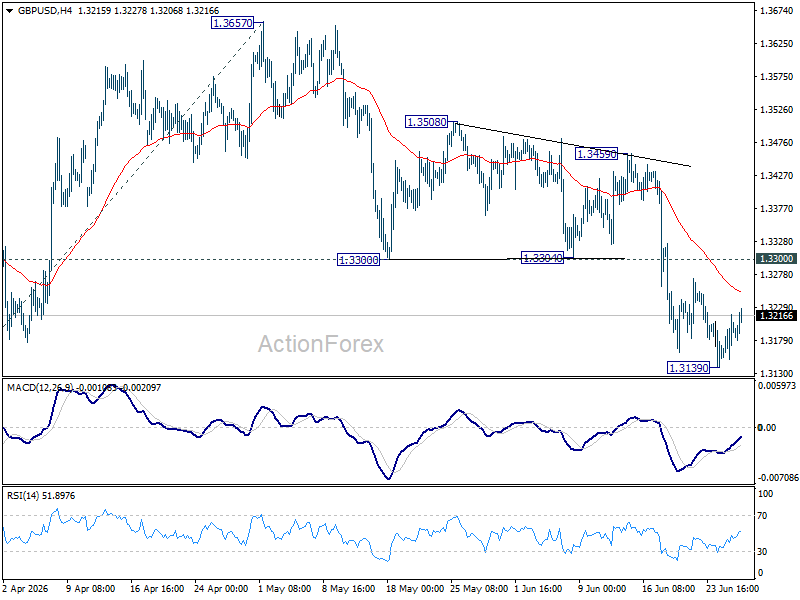
Intraday bias in GBP/USD is turned neutral first with current recovery. Some consolidations could be seen above 1.3139 temporary low. Further fall is expected as long as 1.3300 support turned resistance holds. Break of 1.3139 will target 100% projection of 1.3867 to 1.3158 from 1.3657 at 1.2948.
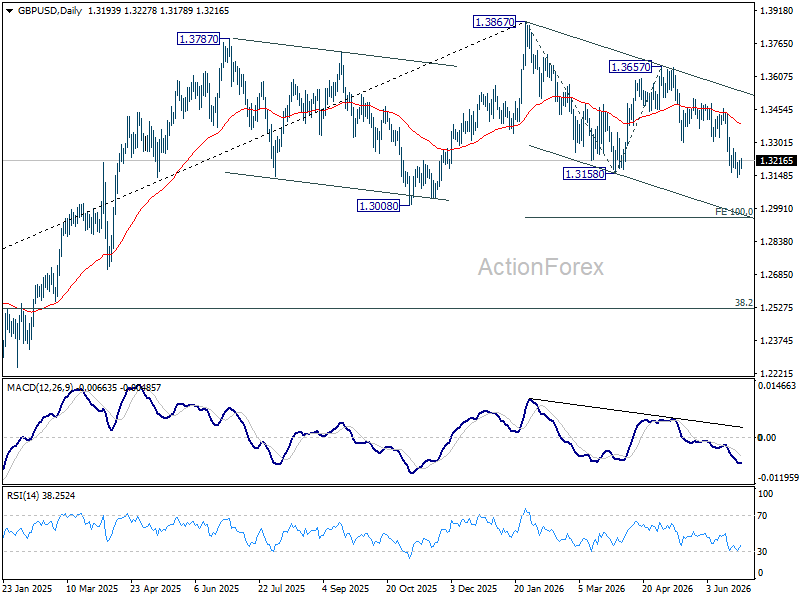
In the bigger picture, price actions from 1.3867 are a corrective pattern within the broader up trend from 1.0351 (2022 low). With 1.3008 support intact, medium term bullishness is maintained and break of 1.3867 is in favor for a later stage, towards 1.4248 key resistance (2021 high). However, firm break of 1.3008 will at least bring deeper fall to 38.2% retracement of 1.0351 to 1.3867 at 1.2524, with increased risk of bearish reversal.
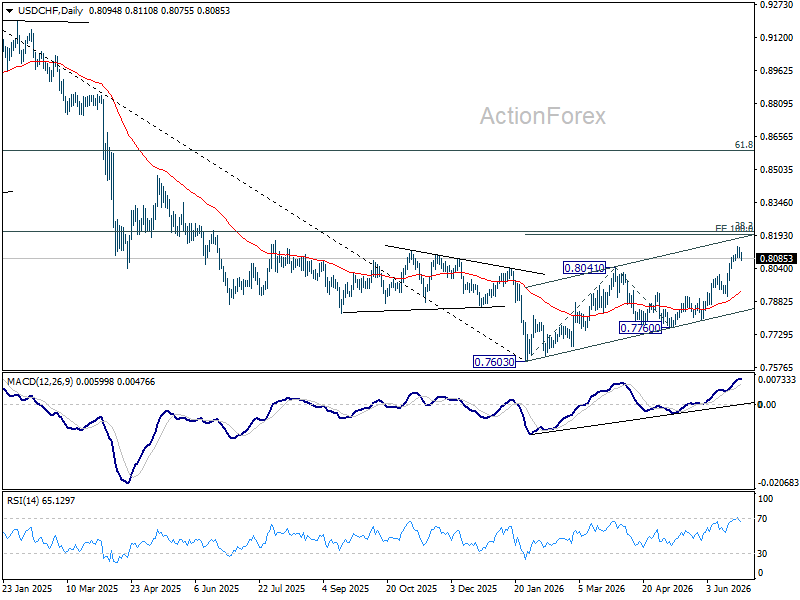
USD/CHF Daily Outlook
Intraday bias in USD/CHF is turned neutral first with current retreat. Some consolidations could be seen below 0.8139 temporary top. But further rally is expected as long as 0.8012 resistance turned support holds. Above 0.8139 will target 100% projection 0.7603 to 0.8041 from 0.7600 at 0.8198.
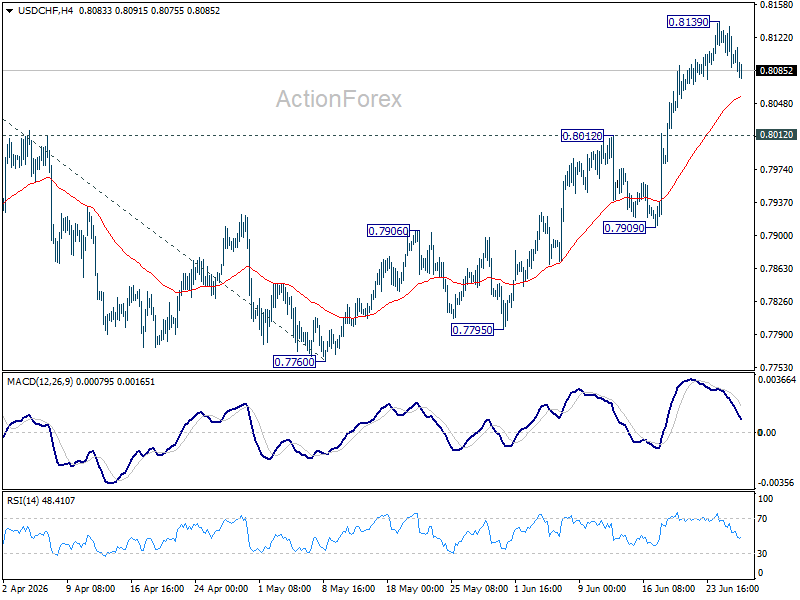
In the bigger picture, while a medium term bottom was formed at 0.7603, it's still early to call for bullish trend reversal. As long as 38.2% retracement of 0.9200 (2025 high) to 0.7603 at 0.8213 holds, the larger down trend could still continue through 0.7603 at a later stage. However, firm break of 0.7603 will argue that the trend has reversed and turn focus to 0.8332 support turned resistance (2023 low) for confirmation.
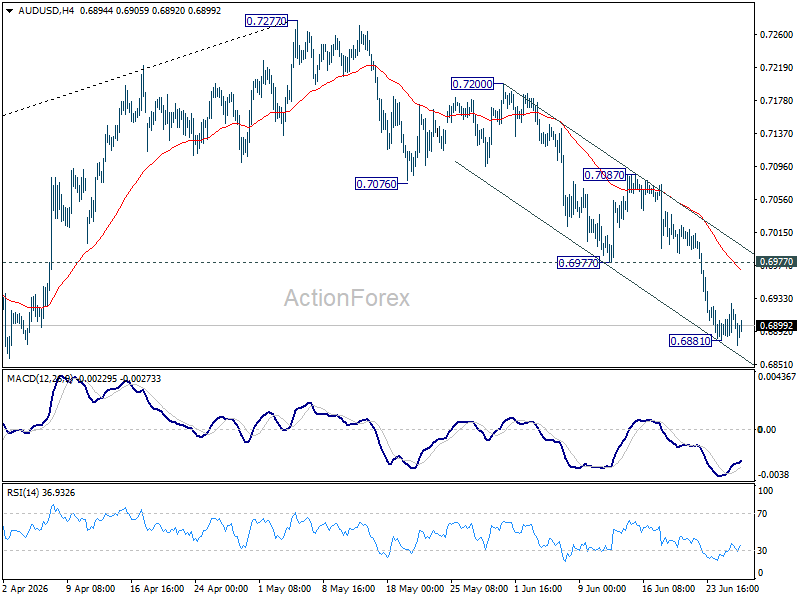
AUD/USD Daily Report
Intraday bias in AUD/USD is back on the downside with breach of 0.6881 temporary low. Current fall from 0.7277 should target 0.6832 support first. Firm break there will target 0.6756 fibonacci level. Risk will continue to stay on the downside as long as 0.6977 support turned resistance holds, in case of another recovery.
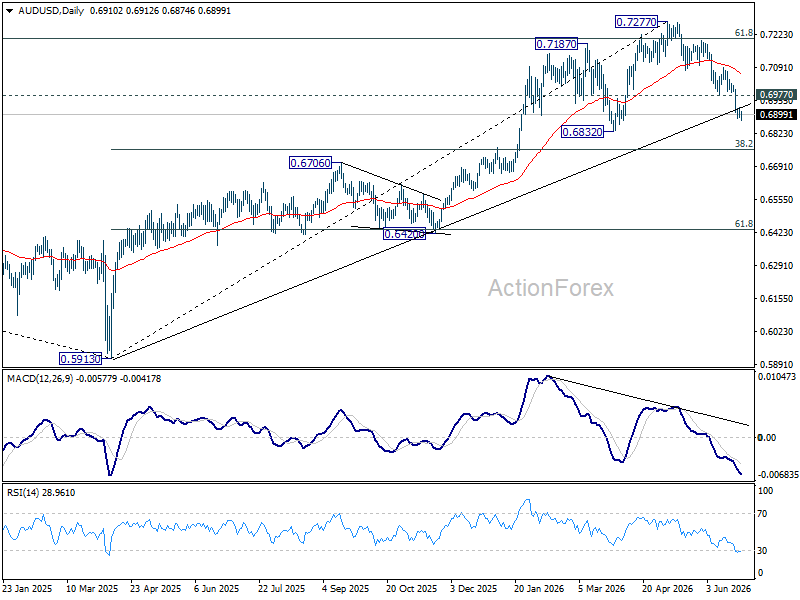
In the bigger picture, considering bearish divergence condition in D MACD, a medium term top could be formed at 0.7277 after failing to sustain above 61.8% retracement of 0.8006 (2021 high) to 0.5913 (2024 low) at 0.7206. Deeper fall could be seen to 38.2% retracement of 0.5913 to 0.7277 at 0.6756 as a correction. But strong support should be seen there to bring rebound. Consolidations would continue below 0.7277 for a while.
USD/CAD Daily Outlook
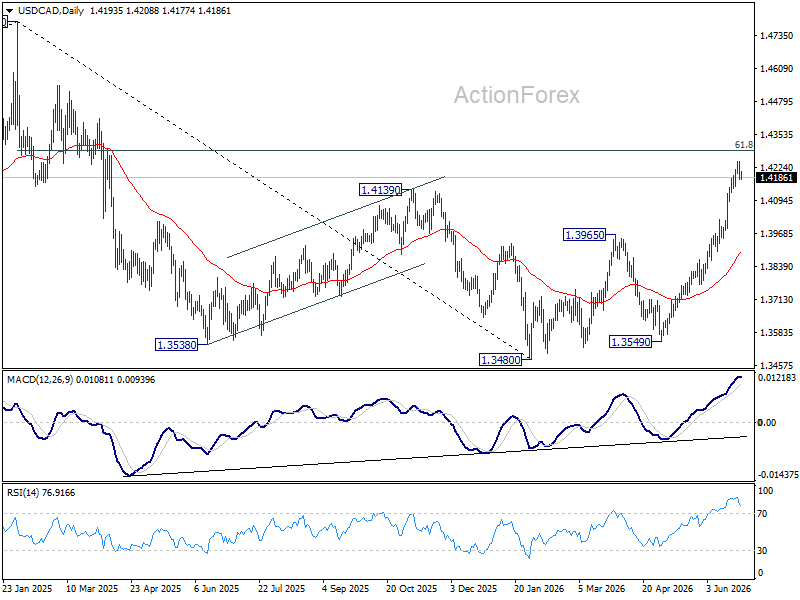
Intraday bias in USD/CAD is turned neutral first with current retreat. Some consolidations would be seen below 1.4247 temporary top. Downside should be contained 1.3965 resistance turned support to bring rally. Above 1.4247 will target 61.8% retracement of 1.4791 to 1.3480 at 1.4290. Sustained break there will pave the way to 1.4791 high.
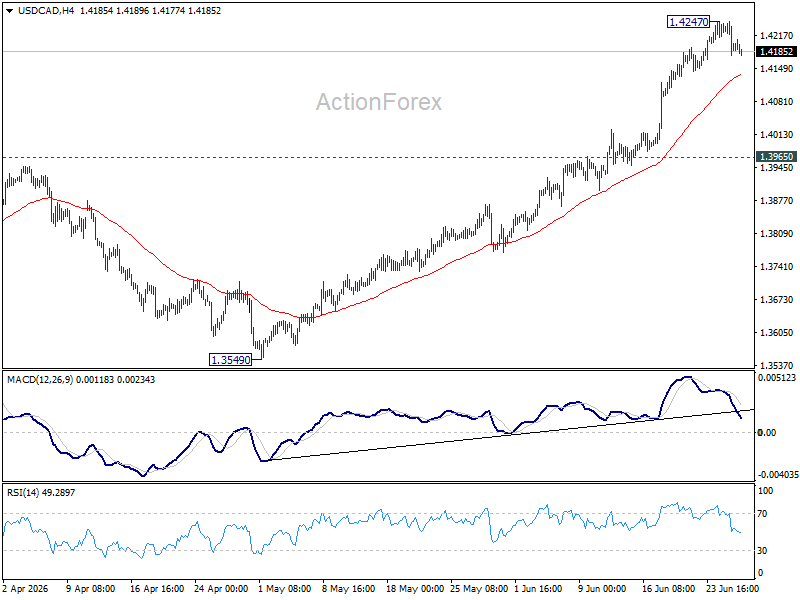
In the bigger picture, current development suggests that fall from 1.4791 has completed as a three wave correction to 1.3480. It's still early to judge if rise from there a corrective bounce, or resumption of the larger up trend from 1.2005 (2021 low). But in either case, retest of 1.4791 high should be seen next.
GBP/JPY Daily Outlook
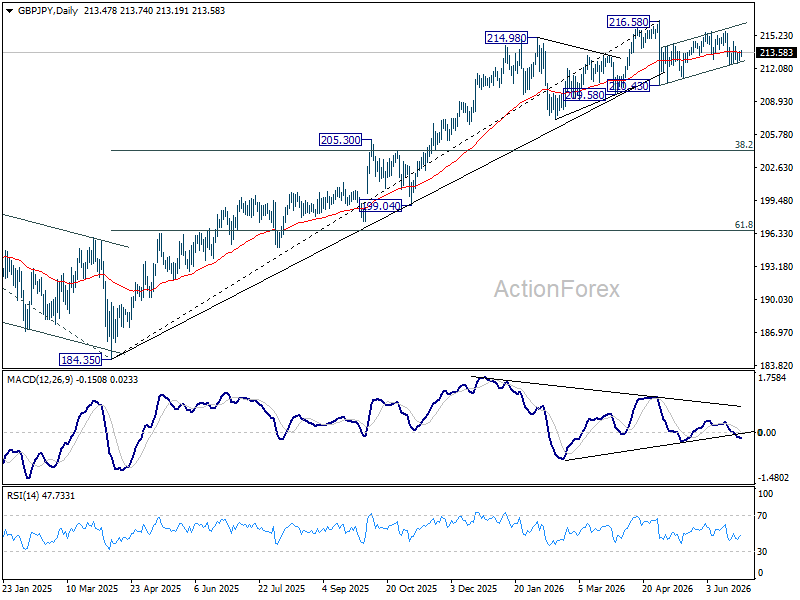
Intraday bias in GBP/JPY remains neutral as sideway trading continues. On the downside, below 212.36 will affirm the case that rebound form 210.43 has completed as a correction. Deeper fall would be seen to 211.23 support first. However, break of 215.59 will resume the rebound from 210.43 to retest 216.58.
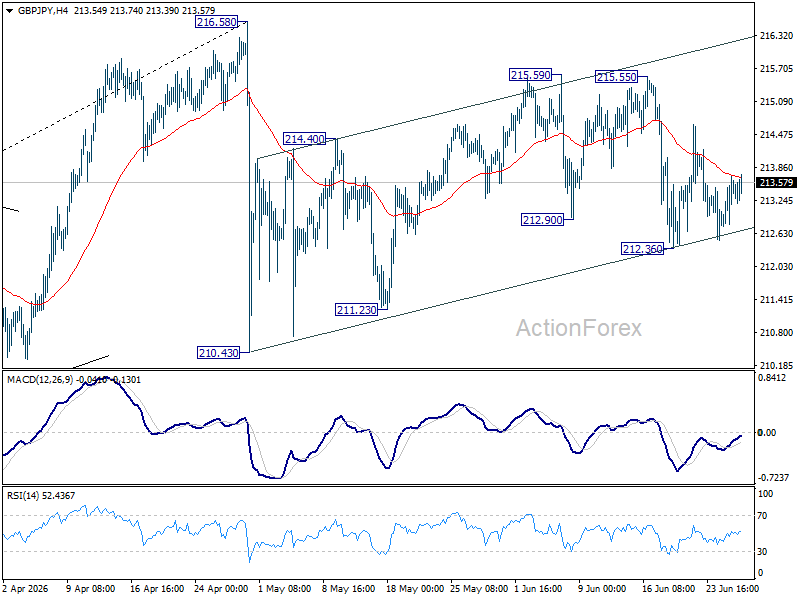
In the bigger picture, there is no clear sign of trend reversal yet. The long term up trend could still extend to 61.8% projection of 148.93 (2022 low) to 208.09 (2024 high) from 184.35 at 220.90 on resumption. However, sustained break of 55 W EMA (now at 207.11) will argue that it's already in medium term down trend for 184.35 support.