Sample Category Title
Gold Analysis: Could XAU/USD Bounce from the Crucial $4,000 Level?
The year 2026 has so far been an unforgiving one for gold. XAU/USD is down approximately 7% since the start of the year, and roughly 28% from the late-January peak — a significant correction, though a physiologically natural one following the sustained bullish rally of recent years.
Fundamental Picture
Several factors have converged to weigh on the precious metal. The Federal Reserve has maintained its restrictive stance, keeping interest rates elevated and reducing the appeal of a non-yielding asset like gold. Simultaneously, institutional portfolio rotation has forced financial players to liquidate a portion of the long positions accumulated during the bull run, amplifying selling pressure. Notably, even the US-Iran geopolitical tension — a scenario that would typically act as a tailwind for gold in its role as a so-called safe-haven asset — has failed to provide meaningful support, with the broader macro environment overriding the flight-to-safety narrative.
Technical Analysis of XAU/USD
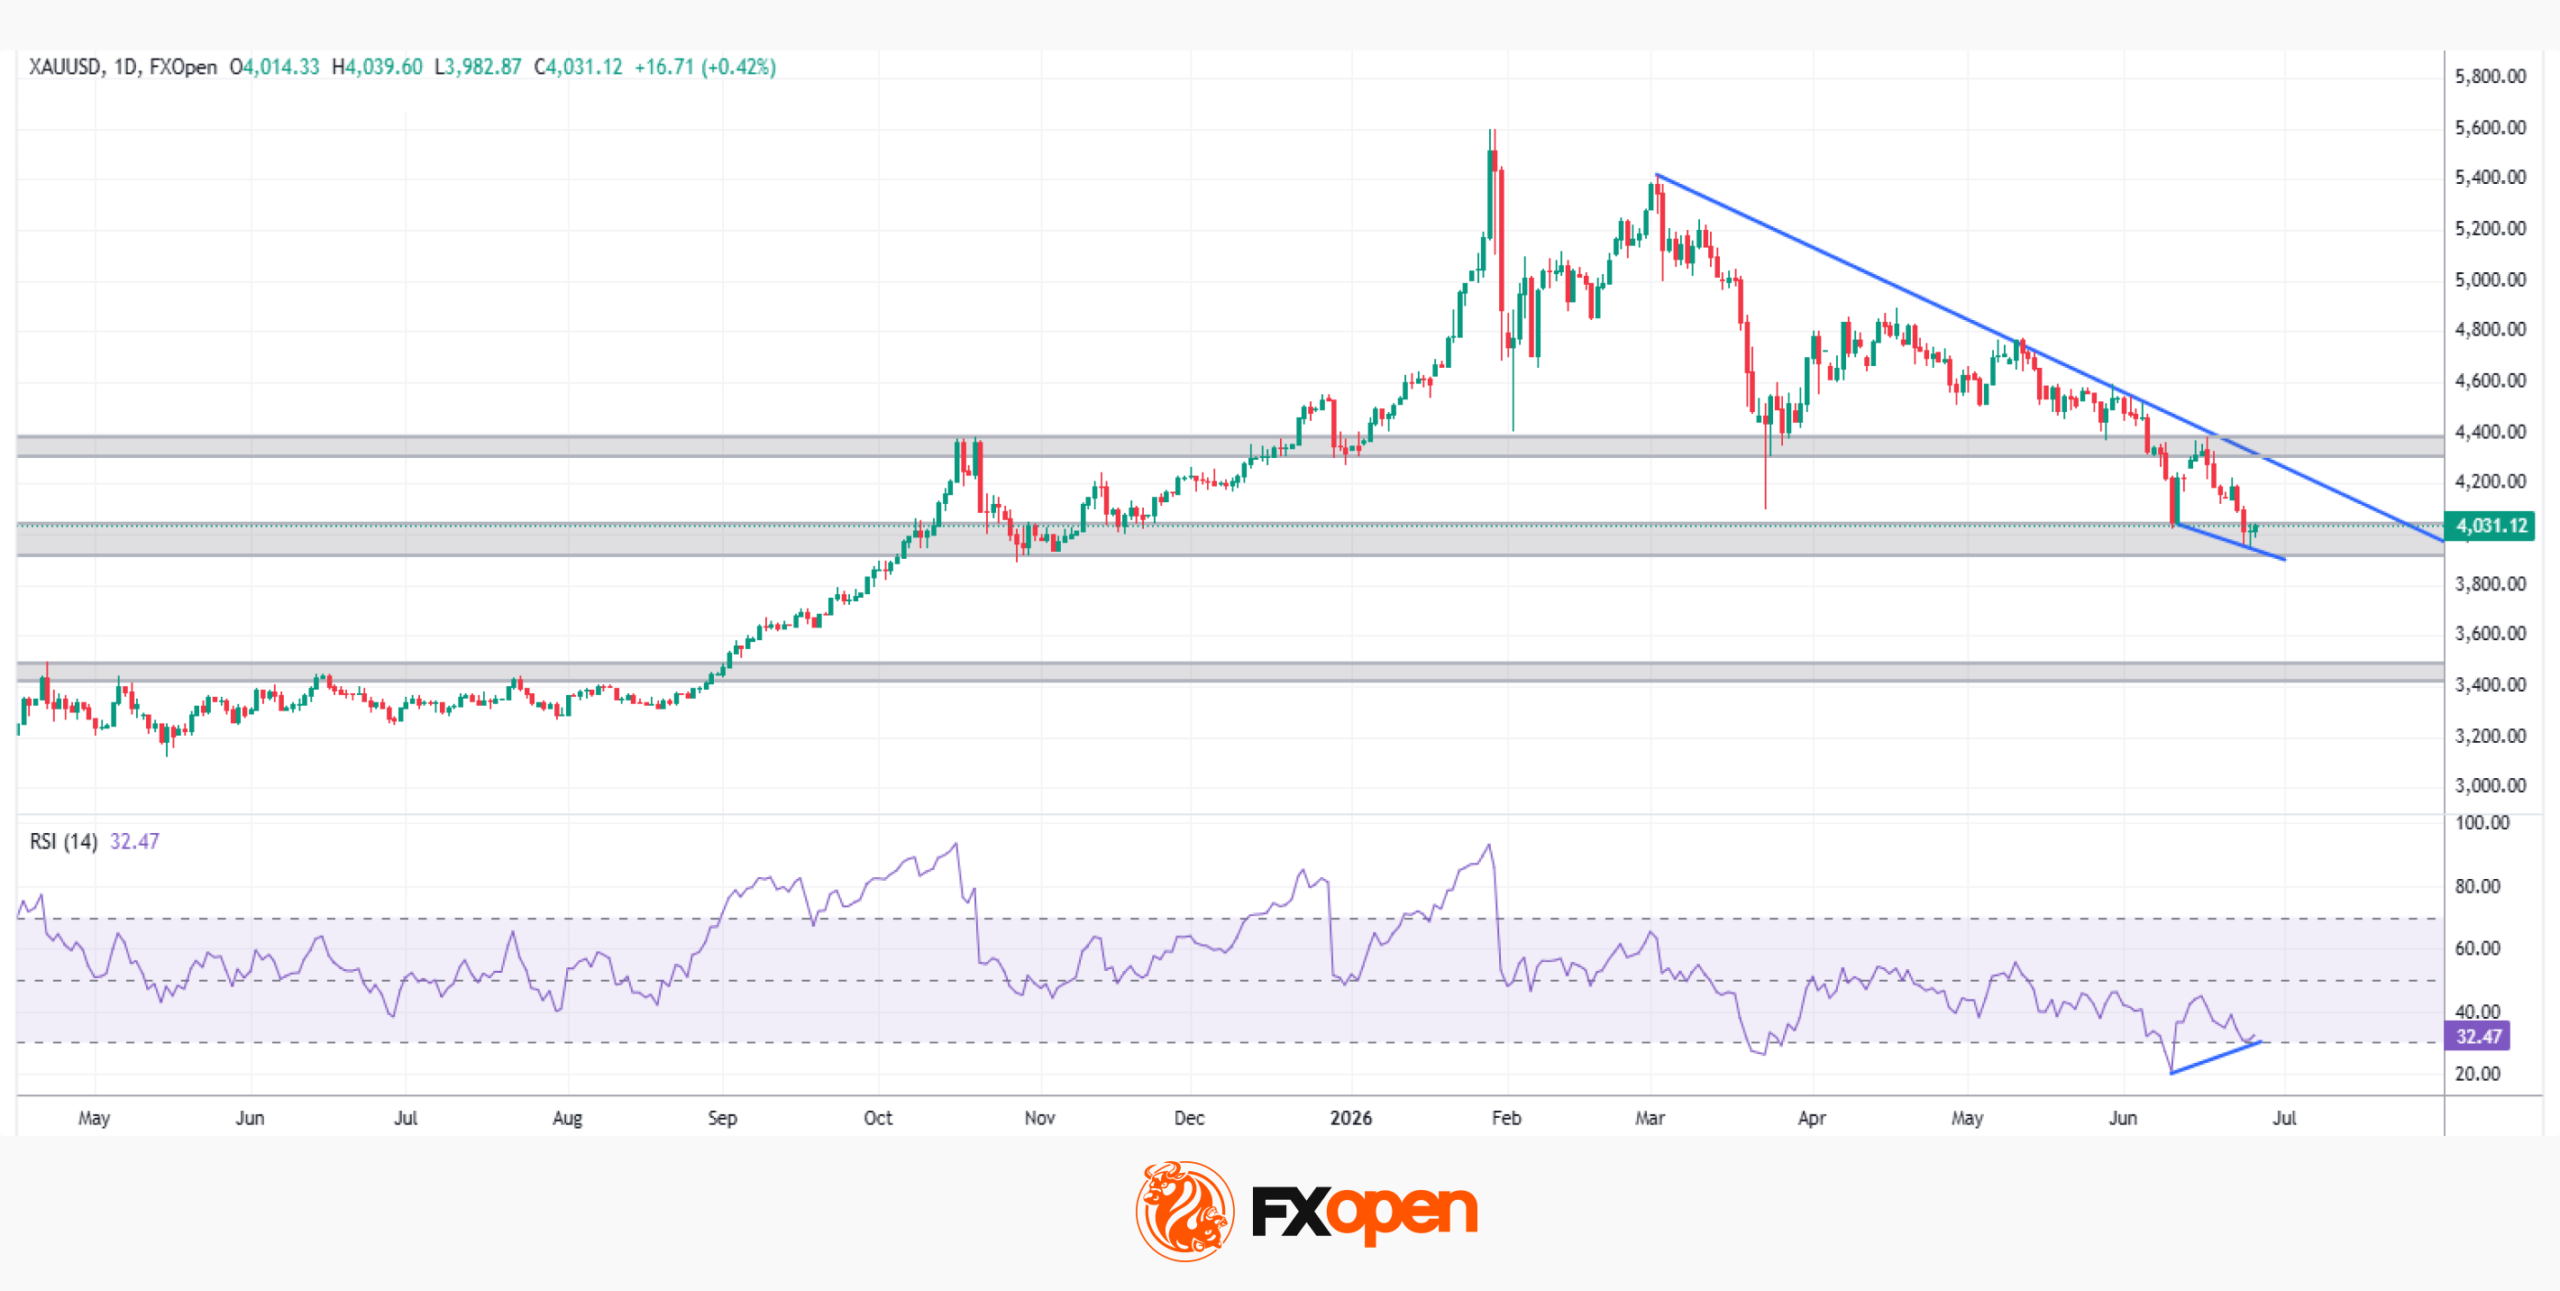
Gold is currently navigating a bearish structure in the short-to-medium term, with price consistently reacting to a descending trendline drawn from the highs of early March, forming a clear sequence of lower highs and lower lows on the daily chart.
Price has now arrived at a technically and psychologically significant area: the $4,000 per ounce. This zone has demonstrated its relevance on multiple occasions in the past, and Thursday's session (25 June) offered the first tentative signs of a reaction, with the daily candle closing in positive territory.
→ Bullish scenario: A sustained reaction from the $4,000 zone, accompanied by a confirmed break above the descending trendline — which converges with resistance in the $4,300–$4,380 area — would establish a new sequence of higher highs and open the door to a broader bullish recovery.
→ Bearish scenario: A decisive break below $4,000, followed by a retest and breach of recent lows, would confirm the continuation of the medium-term downtrend, potentially exposing the $3,400–$3,500 zone — a former major resistance that now acts as structural support.
Both scenarios remain open. Price action on the H4 and H1 timeframes will be key to determining gold's next directional move in the sessions ahead.
Start trading commodity CFDs with tight spreads (additional fees may apply). Open your trading account now or learn more about trading commodity CFDs with FXOpen.
This article represents the opinion of the Companies operating under the FXOpen brand only. It is not to be construed as an offer, solicitation, or recommendation with respect to products and services provided by the Companies operating under the FXOpen brand, nor is it to be considered financial advice.
USD/JPY Enters High-Stakes Game of Chicken Ahead of Non-Farm Payrolls
USD/JPY is once again knocking on the door of Japan's intervention zone, but this week's battle is about far more than whether Tokyo steps into the market. It has become a high-stakes game of chicken. Traders believe Japan is reluctant to intervene before Thursday's US Non-Farm Payrolls report. Japan knows traders believe that. The result is a dangerous window where both sides may be waiting for the other to blink first.
The Ministry of Finance has good reason to stay patient. Launching a massive intervention just days before one of the most important US data releases of the year would be a costly gamble. If Tokyo spent USD 30-40 billion pushing USD/JPY from back below 160.00, only to see payrolls smash expectations and send the Dollar soaring again, those reserves could be wiped out within hours. Worse still, a failed intervention would damage the psychological deterrent that has become one of Japan's most valuable policy tools.
Japan also has little incentive to fight a market that is still moving in a relatively orderly fashion. Officials have repeatedly stressed that intervention is designed to smooth excessive, one-sided volatility rather than defend a particular exchange rate. A steady climb driven by pre-positioning ahead of payrolls is very different from the kind of disorderly spike that typically justifies official action.
That hesitation is precisely what emboldens Dollar bulls. Hedge funds, carry traders and momentum accounts know Tokyo is unlikely to waste ammunition before such a major macro event. With the Federal Reserve maintaining a policy rate of 3.50%-3.75% after June's hawkish hold and the Bank of Japan only recently lifting rates to 1.00%, the yield advantage still overwhelmingly favors the Dollar. As long as that interest rate gap exceeds 350 basis points, traders have every incentive to keep testing resistance around 162.00.
Ironically, the most dangerous period for Dollar bulls may begin after the payrolls report rather than before it. If the data simply meets expectations—or even disappoints slightly—the Dollar could begin retreating on its own. That would give Tokyo a far better opportunity to intervene because it would no longer be fighting a powerful macro trend. Instead, officials could use the market's own momentum against speculative positioning.
Timing could further amplify the impact. With US markets closing for the Independence Day holiday, foreign exchange liquidity is expected to thin sharply. Under those conditions, a routine yen-buying operation that might normally move the market by around 100 pips could instead trigger a violent 400-500 pip slide as stop-loss orders cascade through an empty market. The biggest intervention risk this week may therefore come after payrolls, not before them.
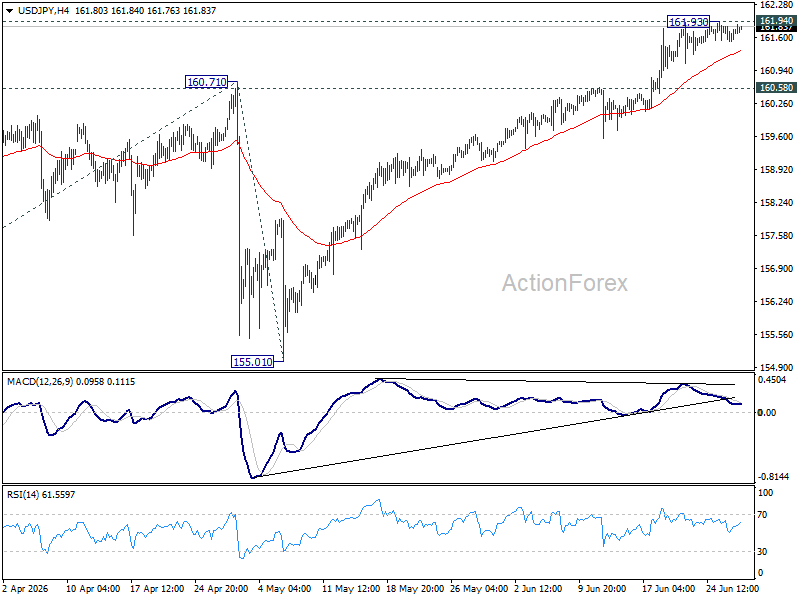
Technically, USD/JPY remains trapped in very tight range below 161.94 (2024's multi decade high). Further rise remains in favor as long as 160.58 support holds. Firm break of 161.94 will target 100% projection of 152.25 to 160.71 from 155.01 at 163.47 next.
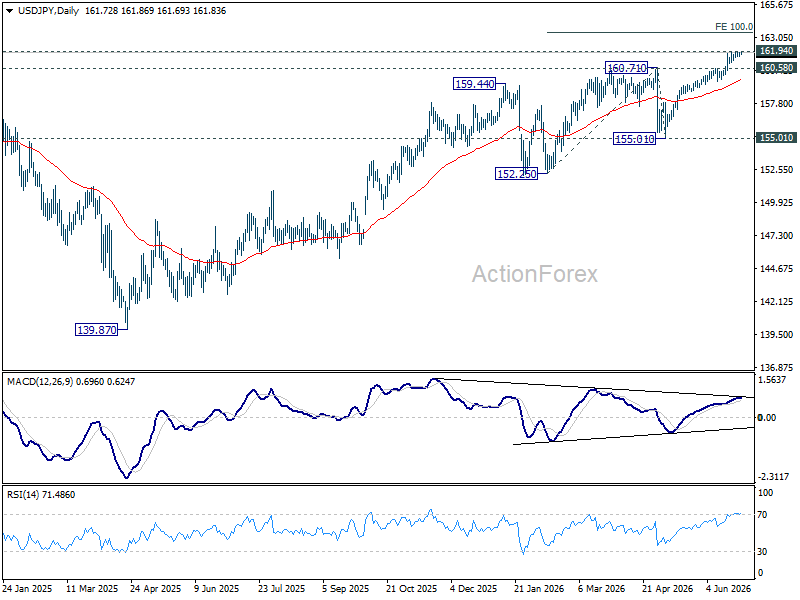
However, firm break of 160.58 should confirm short term topping, and quickly bring USD/JPY below 55 D EMA (now at 159.71)
The Dollar: Geopolitics Back in the Picture
- The escalation of the conflict in the Middle East will bolster the greenback as a safe-haven asset.
- Data on European inflation and the US labour market will determine the fate of EURUSD.
The US dollar quickly recouped its losses after the US resumed bombing Iran in response to its attack on tankers in the Strait of Hormuz. Prior to this, the greenback had been falling amid profit-taking on long positions due to reduced expectations of aggressive monetary tightening by the Fed. The rise in the University of Michigan’s Consumer Sentiment Index in June, coupled with a slowdown in long-term inflation expectations, suggests that two Fed rate rises in 2026 may be avoided.
According to Morgan Stanley, EURUSD could easily reach 1.1, as long-term investors are gradually unwinding their long positions whilst hedge funds are building up short positions. BNY Mellon sees potential for a fall below this level, as the ECB is unlikely to raise rates further due to the negative impact of monetary tightening on the eurozone economy.
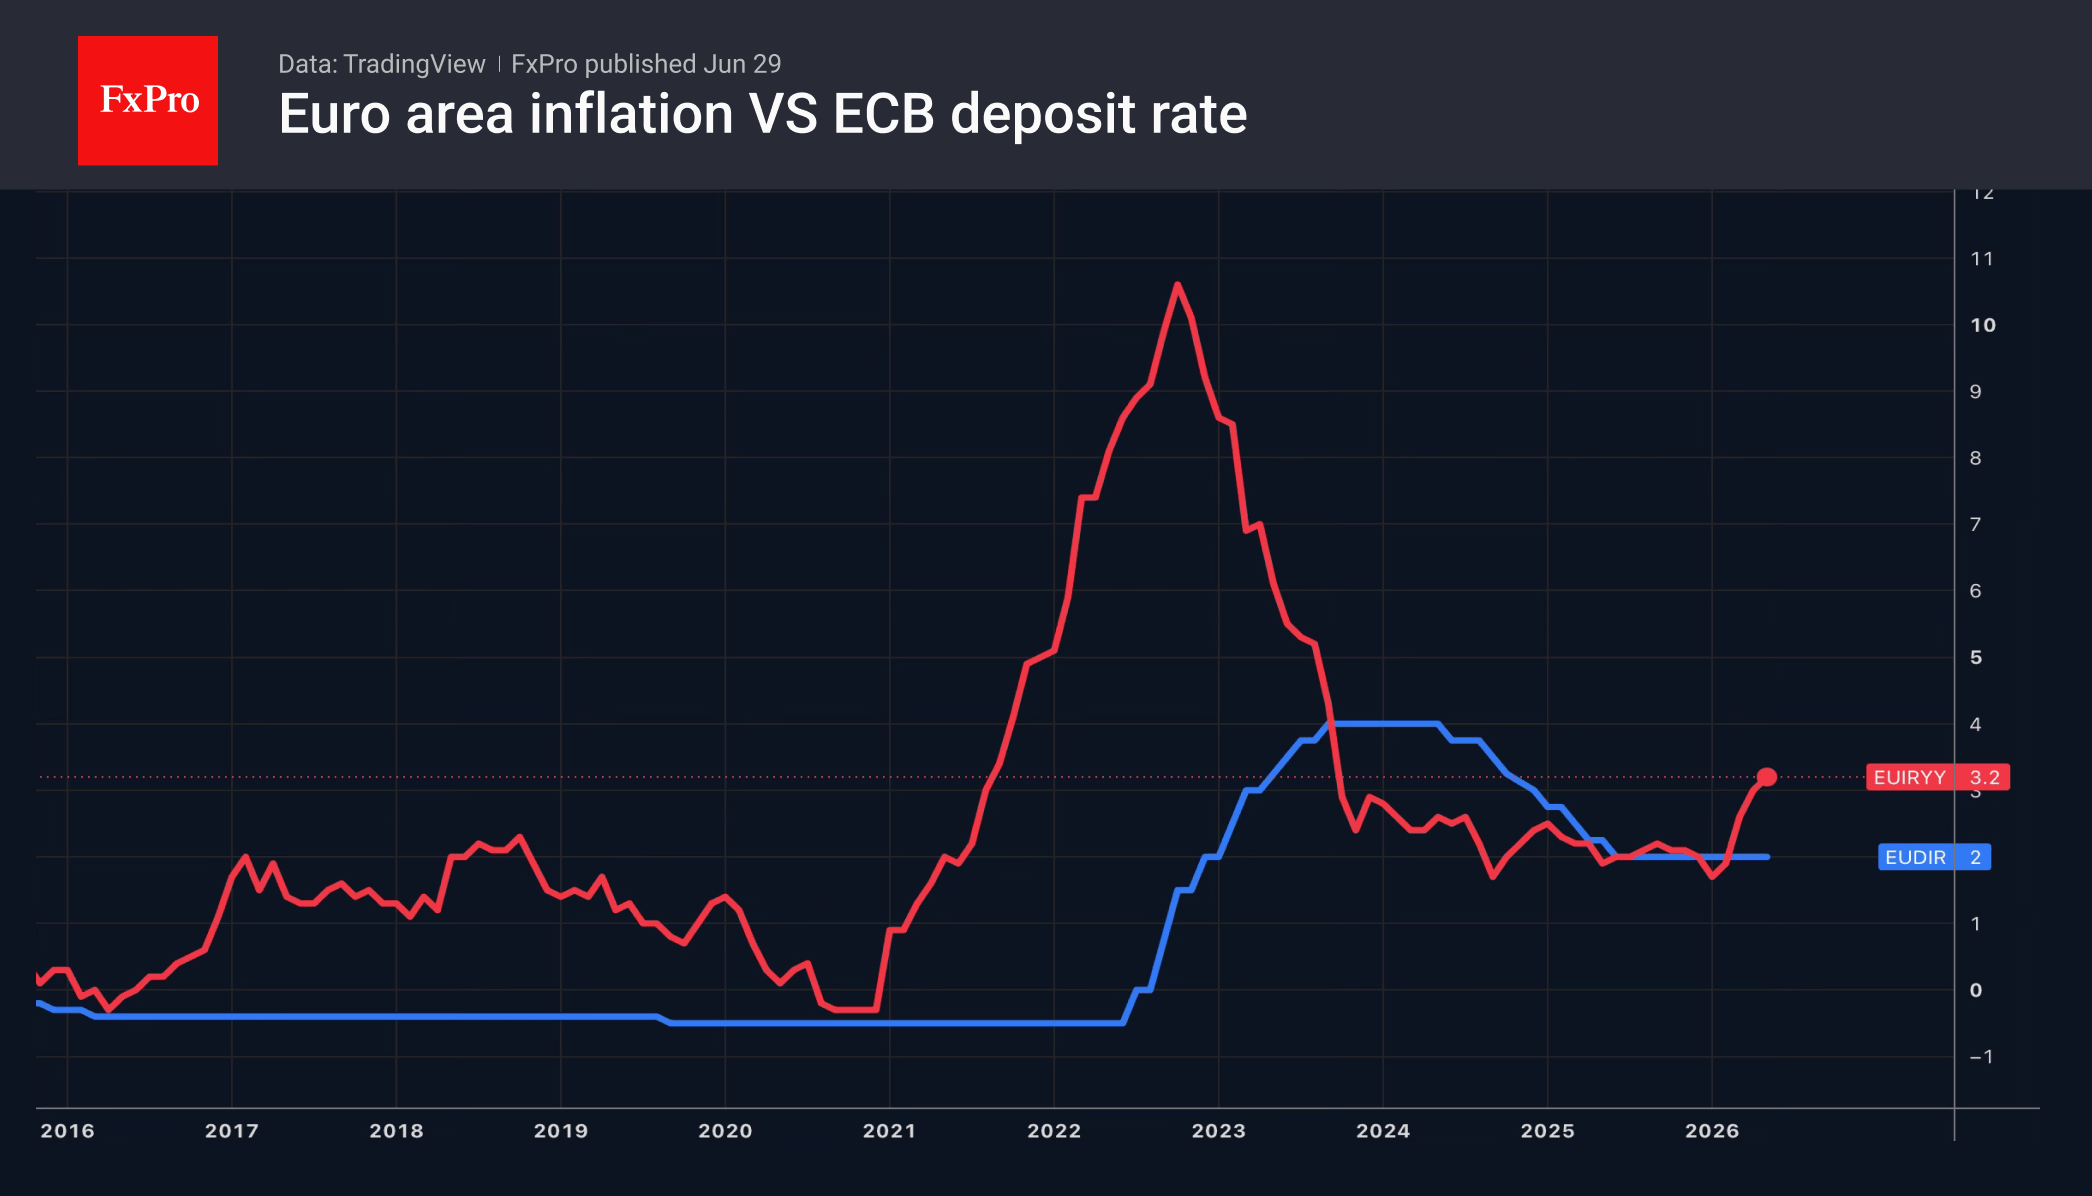
The Fed’s ‘hawkish’ shift and Christine Lagarde’s ‘dovish’ rhetoric have sent EURUSD tumbling to annual lows. Investors will be looking for confirmation of the downtrend in data on European inflation and the US labour market. Bloomberg experts expect consumer prices in the eurozone to slow from 3.2% to 3% in June. If inflation is indeed peaking, there is no need to tighten monetary policy. This is bad news for the euro.
The improvement in employment trends this spring provided a reason to keep the federal funds rate on hold. Further stabilisation of the labour market will allow the Fed to raise it as inflation picks up. Divergence in monetary policy will continue to support the ‘bears’ on EURUSD. If, at the same time, oil prices start to rise due to tensions in the Middle East, the euro risks falling to $1.1.
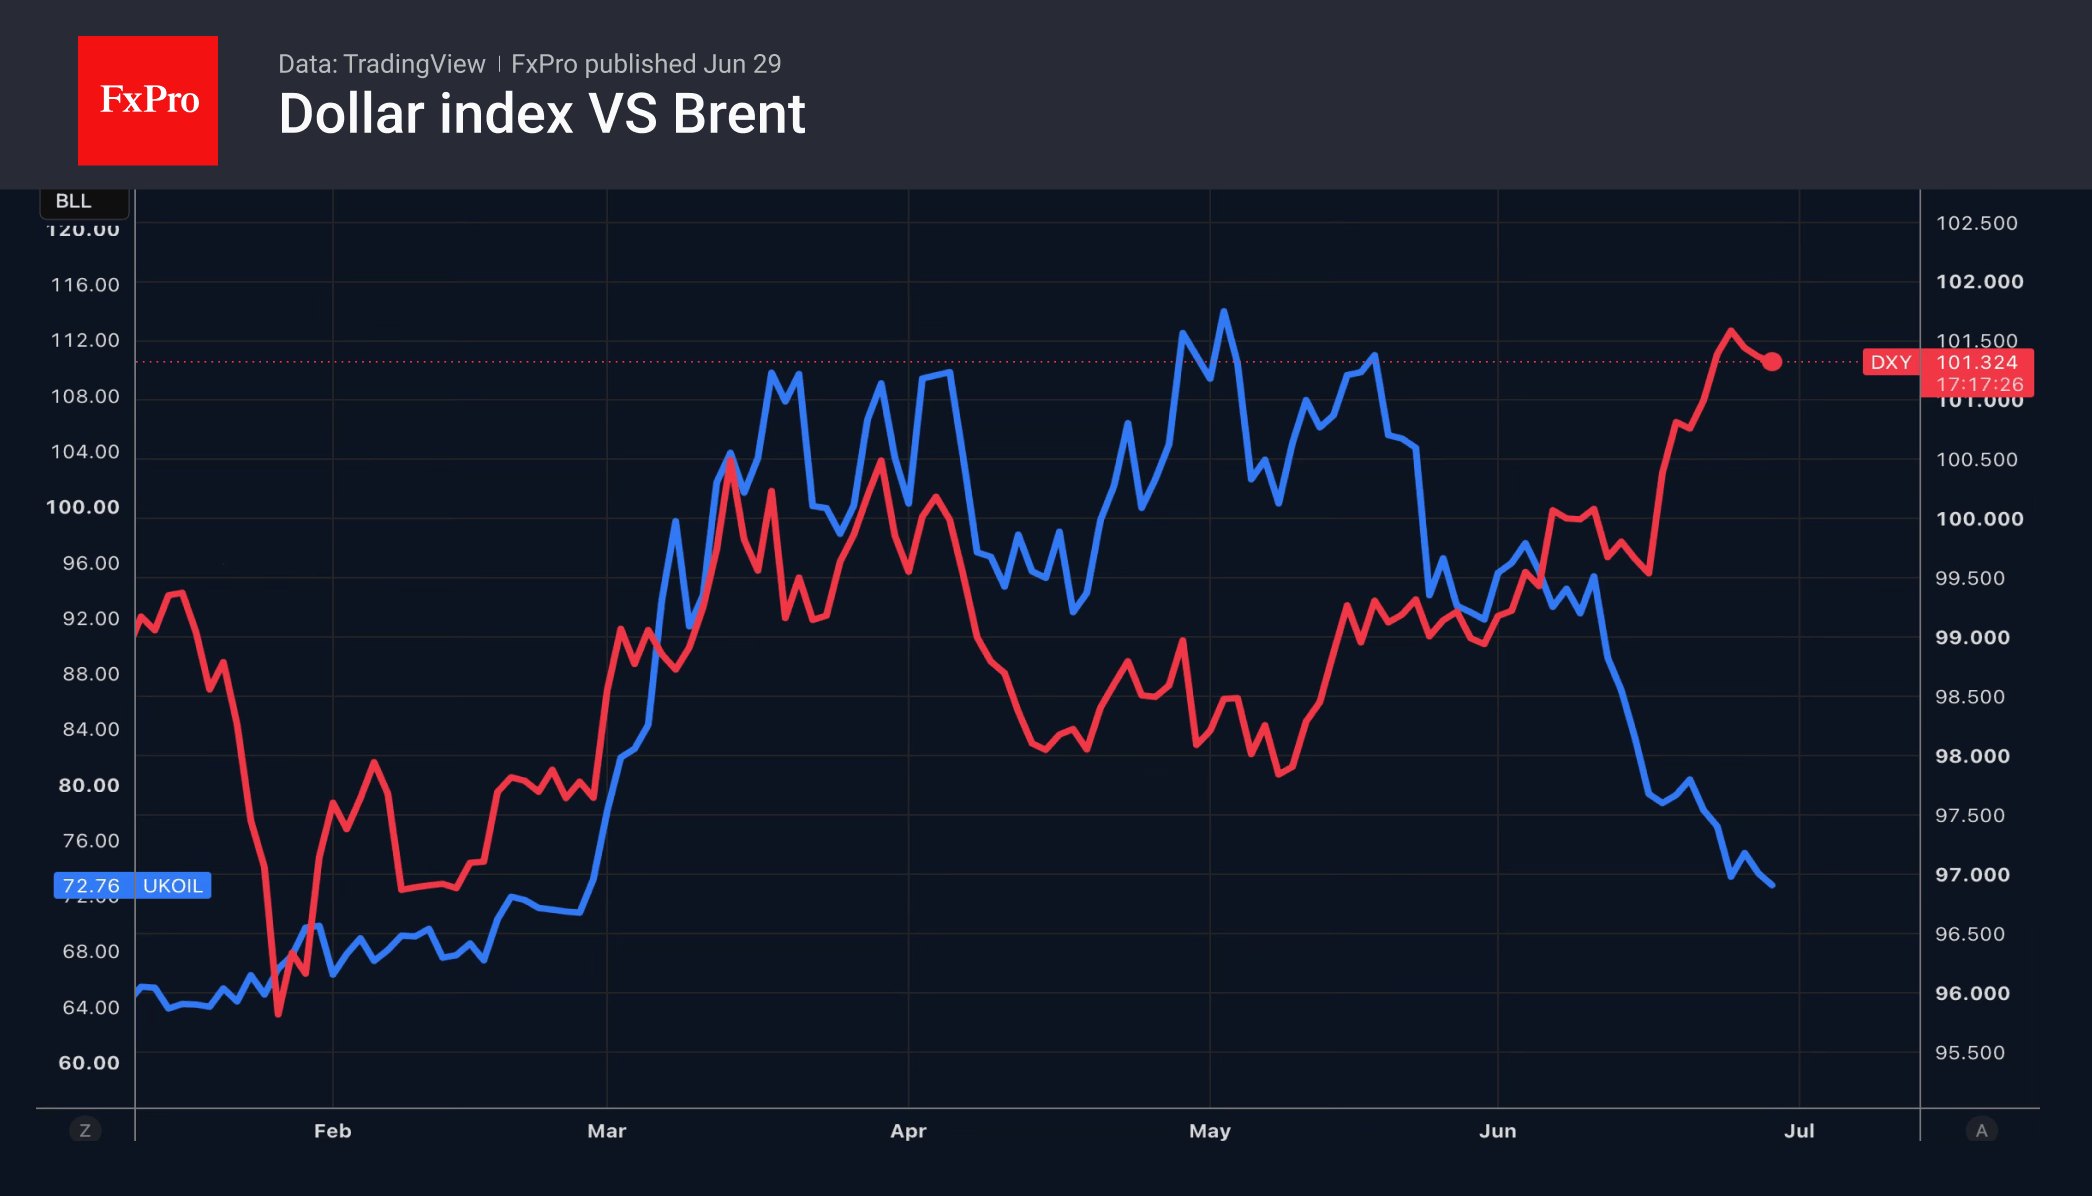
Brent continues to react to good news and turn a blind eye to the bad. Rumours of a ceasefire and negotiations have had a greater impact on the North Sea crude than the resumption of Tehran’s attacks on tankers and US airstrikes on Iran. However, if fears continue to hamper traffic through the Strait of Hormuz and slow the process of restoring oil production in the Persian Gulf to pre-war levels, prices will soar. This will support the US dollar as the currency of a net exporter of energy commodities.
The FxPro Analyst Team
BoE’s Pill: Structural Changes Leave UK Inflation More Persistent
Bank of England Chief Economist Huw Pill said structural changes in the UK economy have made inflation more persistent, arguing that policymakers are still assessing how shifts in labor and goods markets have altered the country's inflation dynamics. His remarks reinforce the view that bringing inflation sustainably back to the Bank's 2% target may prove more challenging than before.
Speaking at an event in Tashkent, Uzbekistan, Pill said the economy has become "more prone to this sort of self-sustaining momentum in pricing," adding that structural changes to labor and goods markets have increased inflation persistence. He cited the changes brought about by Brexit as one example, noting that policymakers are "still learning" and "still digesting" their longer-term economic effects.
Pill's comments highlight a distinction between temporary inflation shocks and the economy's underlying inflation mechanism. While monetary policy can restrain demand, it has limited ability to address structural supply constraints, including reduced labor mobility and higher trade frictions. If those constraints have become more entrenched, inflation may fade more slowly following future supply shocks.
The remarks reinforce the Bank's cautious approach to monetary policy. Markets have focused on whether inflation is becoming less responsive to tighter financial conditions, particularly after several years of pandemic disruptions, energy shocks and persistent services inflation. Pill's assessment suggests structural factors may continue to require a restrictive policy stance even as cyclical inflation pressures gradually ease.
Pill's comments echo previous observations by Governor Andrew Bailey, who has also acknowledged the economic consequences of Brexit and argued for closer economic ties with the European Union. While estimates of Brexit's long-term impact vary, the broader message from senior BoE officials is increasingly consistent: structural changes to the UK economy have complicated the task of restoring inflation sustainably to target.
Sunrise Market Commentary
Markets
Today's eco calendar is confined to European figures with the EC's confidence indicators and first national inflation numbers for June (Spain & Belgium). The EMU CPI figure is due Wednesday (consensus: 3% Y/Y from 3.2% headline & 2.5% Y/Y from 2.6% core). Such outcome reduces the necessity of immediate follow-up action by the ECB with money markets attaching just a slim chance to a July rate hike (7% vs 60% for September). The ECB's annual forum in Sintra starts with president Lagarde giving an introductory speech after the European closing bell. Wednesday's panel discussion with Lagarde, Fed chair Warsh, BoE governor Bailey and BoC governor Macklem is the main event. The Belgian debt agency conducts its monthly OLO auction. Three lines are on tap today: OLO 73 (3% Jun2034), OLO 60 (4.25% Mar2041) and OLO 107 (4.35% Jun2056). The BDA aims to raised a combined amount of €2.6-3bn. Selling the upper end of that range would lift this year's total OLO issuance to €37.3bn, or 72% of this year's €51.6bn OLO funding need. The lion share of that amount was raised via three new syndications earlier this year (€22bn). This week's US eco calendar is jam-packed from tomorrow until Thursday. Chicago PMI, consumer confidence and the JOLTS job openings report are due tomorrow. On Wednesday, we'll get ADP employment change and the ISM manufacturing survey. On Thursday, the June payrolls report will be released exceptionally early with US markets closed on Friday in observance of Independence Day. As US money markets haven't given up the possibility of a July Fed rate hike (30% implied probability) following last week's US PCE deflators, US numbers have market-moving potential especially if they portray more strength. Richmond Fed Barkin (non-voter) warned this weekend that "it's hard to have confidence that you're headed back to 2% without any more influence from the fed funds rate or the labor market or some other feature that creates disinflation the other way". While he welcomed a rapid drop in gas prices, he's also worried about risks of inflation expectations becoming unanchored. "Businesses, when they set prices, take today's inflation as a factor, and so I think there's some persistence to inflation. I do worry about that, and that's part of why I think being modestly restrictive is a reasonable place to be." Minneapolis Fed Kashkari (voter) revealed that the had one rate hike pencilled in for this year in the latest dot plot. Just like Chicago Fed Goolsbee, he warns for broader inflationary pressures rather than shock-related price increases. Another story line to follow this week are peace talks between the US and Iran scheduled in Doha. This weekend's US strikes against Iranian military targets highlight the fragile ceasefire and suggest there's still a lot of distrust between them despite their recent MoU signing. Brent crude so far holds a more optimistic view, trading around $72/b. Finally, (US) risk sentiment is a wildcard with AI valuation concerns still being a topic.
News & Views
The Bank of International Settlements in its annual report said rising energy prices due to the conflict in the Hormuz area have tested the global economic resilience it had seen so far. Looking forward, it identified four so-called pressure points that demand attention. One of them is inflation, which has risen because of the energy shock and now needs monitoring for its broadness and persistency that could ultimately end up in second-round effects. Second is that optimism surrounding AI may not last, particularly if the current capex surge proves unsustainable and/or the AI payoffs turn out to disappoint relative to the investments made. It could trigger a sudden pullback in financing and turn into a protracted investment bust with potential knock on effects on financial conditions and global growth. The third pressure point is the persistence of financial vulnerabilities. "Easy financial conditions could tighten and become a potent amplifier in adverse scenarios where interest rates rise and AI payoffs disappoint. Compressed risk premia and stretched valuations highlight the scope for unwinding.", the BIS said. The fourth pressure point are mounting fiscal pressures. Debt levels are high and spending demands rising amid energy shocks and geopolitical tensions. This coincides with a "less benign financial environment" (read: higher interest rates).
The European Commission is about to introduce a 15% levy on exports of aluminum scrap to outside the bloc, the Financial Times reported. Such a move would be the first of its kind and is aimed at preventing the what it considers valuable metal going to places including the US and Asia. Demand from outside has increased in recent months due to the closure of the Hormuz Strait, which reduced Gulf exports. EU aluminum producers say these overseas smelters are making bigger profits by buying European scrap, melt it again and sell the fresh metal at a premium back to the bloc. The proposal is planned for a vote on September 9, people familiar told the FT.
Gold’s Rebound Lacks Conviction as NFP Report Could Reopen Fed Hike Debate
Gold has stopped falling, but it has not started recovering either. After slipping below the psychologically important $4000 level, prices have managed to claw back some losses. Yet the rebound has been hesitant, lacking both momentum and conviction. Rather than signaling renewed confidence, the move looks more like a market unwilling to press either side of the trade ahead of one of the most important US economic releases of the quarter.
The June Non-Farm Payrolls report (on Thursday instead of Friday this week due to U.S. holday) has become far more than a routine employment update. Markets have already settled on the view that the Federal Reserve is likely to deliver one more rate hike this year following Chair Kevin Warsh's hawkish hold in June. The real question now is whether one hike will be enough. Thursday's jobs data could either cement that view or revive the discussion over two hikes, putting the Dollar and Gold on sharply different paths.
Expectations:
Economists expect payroll growth to slow from 172,000 to around 115,000-130,000 jobs, with the unemployment rate holding at 4.3% or edging up to 4.4%. Average hourly earnings are forecast to rise 0.3% on the month, while annual wage growth is expected to ease from 3.5% to 3.4%. But this month's report carries an important twist. The FIFA World Cup has generated a temporary hiring wave across hospitality, transport and event management, with some estimates suggesting it could artificially lift payrolls by roughly 40,000 jobs.
That makes this one of those rare payroll reports where the headline could tell only part of the story. A strong jobs number driven largely by temporary hiring may not convince policymakers that underlying labor demand has reaccelerated. Instead, investors are likely to scrutinize wages, unemployment and broader labor market indicators before deciding whether the Fed needs to tighten policy more aggressively.
The scenarios:
If payrolls broadly match expectations, markets are likely to remain comfortable with pricing one Fed hike, leaving September as the preferred timing while keeping December as a viable fallback should inflation cools. That outcome may not ignite another Dollar rally, but it should also prevent a meaningful correction. For Gold, it would probably mean temporary stability rather than a lasting rebound, especially with June CPI still waiting in the wings two weeks later.
A genuine upside surprise, particularly one accompanied by stronger wage growth, would be a very different story. It would strengthen the case for a September hike, revive speculation about another move in December, and reinforce the Dollar's medium-term uptrend. Gold would likely struggle to defend the $4000 region under those conditions, opening the door to another leg lower.
A downside surprise appears less likely given the World Cup-related hiring boost, but it cannot be dismissed. Even then, one weaker report is unlikely to fundamentally alter the Fed's tightening bias after several months of resilient employment. Instead, investors would probably shift expectations from September toward December rather than price out additional tightening altogether. That could allow Gold to establish a temporary base between $4000 and $4400, but probably not mark the beginning of a new bull run.
Gold technicals:
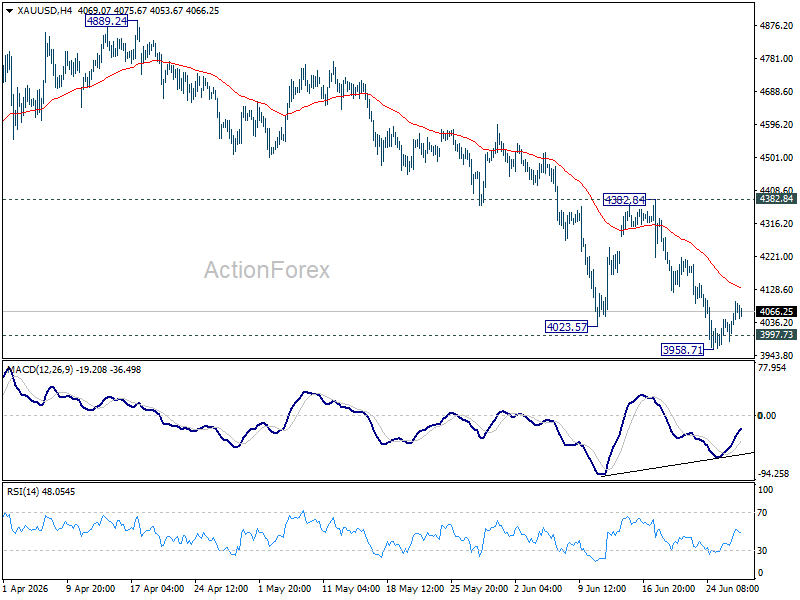
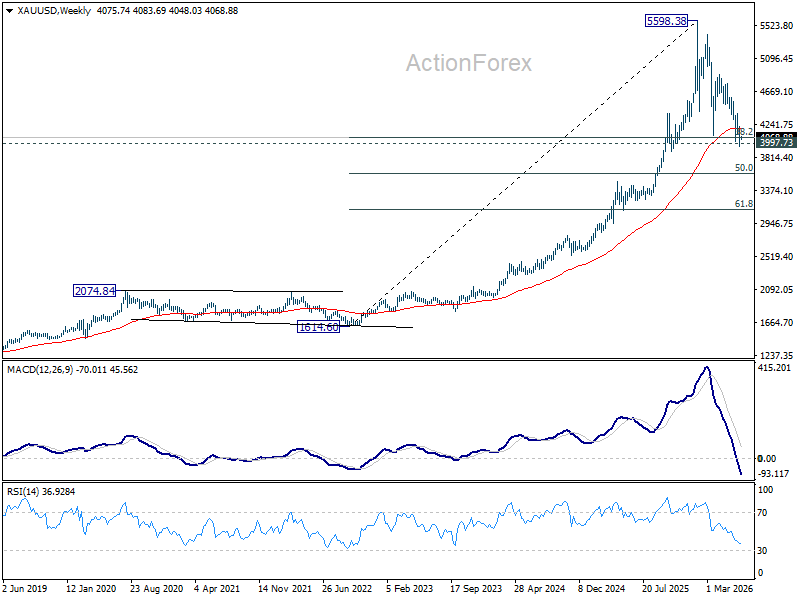
Technically, the recent rebound still resembles a pause within a broader down trend. Consolidation above 3,958.71 temporary low is possible over the near term, but the outlook remains bearish while 4,382.84 resistance limits upside.
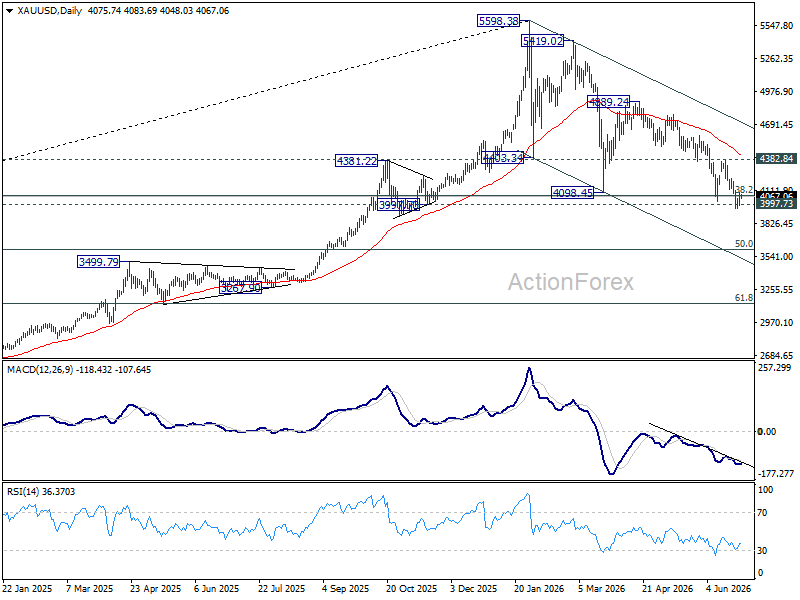
The broader decline from the 5,598.38 record high continues to correct the multi-year advance from 1,614.60 (2022 low). Sustained break of 38.2% retracement of 1,614.60 to 5,998.38 at 4,076.57 will pave the way to 50% retracement at 3,606.49 next.
EUR/USD Weakness Returns as Bulls Fail to Build Momentum
Key Highlights
- EUR/USD started a fresh decline after it failed to recover above 1.1450.
- The bulls face resistance near 1.1450 and 1.1475 on the 4-hour chart.
- Bitcoin is showing signs of weakness below $60,000.
- USD/JPY remains elevated and could resume gains above 162.00.
EUR/USD Technical Analysis
The Euro started a recovery wave from 1.1325 against the US Dollar. EUR/USD climbed above 1.1380 and 1.1400 but failed to continue higher.
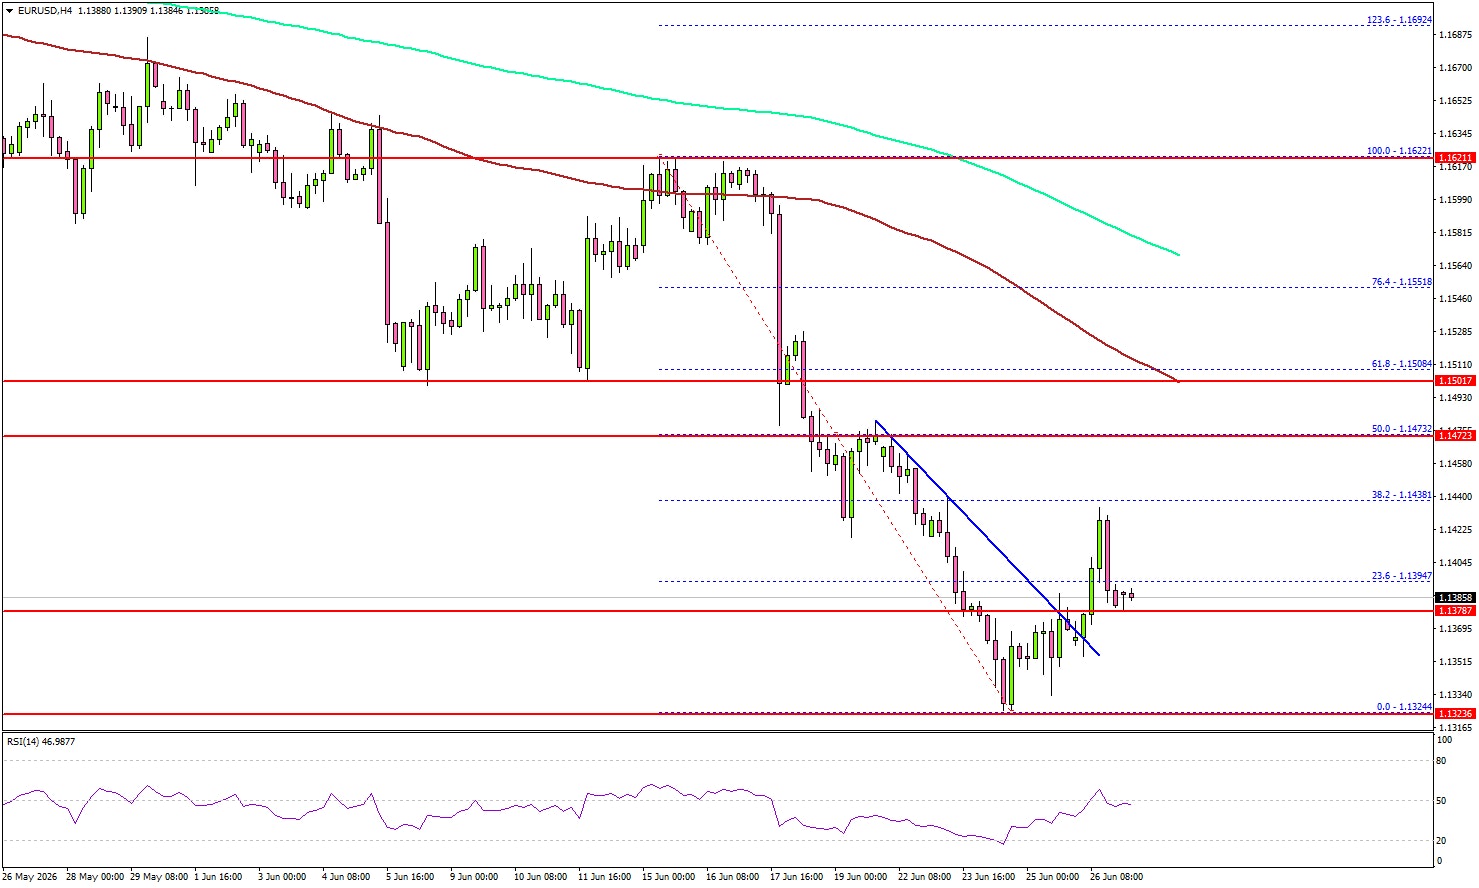
Looking at the 4-hour chart, the pair cleared a connecting bearish trend line with resistance at 1.1370. The pair even surpassed the 23.6% Fib retracement level of the downward move from the 1.1622 swing high to the 1.1324 low.
However, the pair faced resistance near 1.1450. It is again moving lower and shows bearish signs below 1.1400, the 100 simple moving average (red, 4-hour), and the 200 simple moving average (green, 4-hour).
If there is another recovery wave, EUR/USD could face resistance at 1.1420. The next major resistance might be 1.1450. A close above 1.1450 could open the doors for a larger increase. In the stated case, the bulls could aim for a move to 1.1475 and the 50% Fib retracement level of the downward move from the 1.1622 swing high to the 1.1324 low.
If the downside pressure builds, the pair could find bids near 1.1325. The first major support could be near 1.1300. A downside break and close below 1.1300 might send the pair toward 1.1250. Any more losses could open the doors for a test of 1.1200.
Looking at USD/JPY, the bulls pushed the pair above 161.20, and they could soon aim for a move above 162.00 in the near term.
Upcoming Key Economic Events:
- Euro Zone Consumer Confidence for June 2026 – Forecast -17.7, versus -17.7 previous.
- Euro Zone Services Sentiment for June 2026 – Forecast 2.5, versus 2.2 previous.
- Euro Zone Industrial Confidence for June 2026 – Forecast -7.8, versus -8.0 previous
- Euro Zone Economic Sentiment Indicator for June 2026 – Forecast 94.3, versus 93.5 previous.
USD/JPY Tests 162 as Strong U.S. Data Supports the Dollar
It was a mixed week for markets. U.S. and Japanese stocks made new highs, but later finished lower as concerns about AI stock valuations weighed on sentiment. SpaceX also came under pressure, falling below its IPO price and ending the week more than 10% lower.
Markets are now expecting at least one U.S. interest rate increase before the end of the year, even though crude oil prices have recently fallen. Gold briefly dropped below $4,000 before recovering, while Bitcoin continued to move lower.
USD/JPY continued to test higher levels as U.S. economic data remained strong. GDP and durable goods orders beat expectations, while Core PCE inflation was in line with forecasts but still high. USD/JPY came close to 162 several times, but the Bank of Japan did not intervene. Crude oil prices fell as negotiations continued, with traders focusing on the return of oil supply from the Middle East.
Markets This Week
U.S. Stocks
While technology stocks came under pressure, the Dow still managed to reach a new record high last week, supported by lower crude oil prices and the continuation of its technical uptrend. However, the index ended the week back near the 10-day moving average, suggesting momentum has slowed. This week, short-term selling opportunities may be more attractive if the Dow breaks below the 10-day moving average or rises too quickly above it. Resistance levels are at 52,500 and 53,000. Support is seen at 51,000, 50,000, 49,500, 49,000 and 48,500.
Japanese Stocks
A further drop in crude oil prices helped the Nikkei reach a new record high at the start of the week. However, concerns over the high valuations of AI-related stocks in Japan, Korea, and the U.S. later weighed on sentiment, pushing the index to close below the 10-day moving average by the end of the week. With the market ending the week poorly, and after such a strong rise this year, further losses could be seen this week. If the Nikkei remains below the 10-day moving average, looking for short-term selling opportunities may be the better approach. Resistance is seen at 71,000, 72,000, 73,000, 74,000 and 75,000, while support is at 68,750, 68,000, 66,500 and 65,000.
USD/JPY
Better-than-expected U.S. economic data and growing expectations for at least one more U.S. interest rate increase helped USD/JPY test the 162 level several times last week. The threat of intervention to support the yen remains, but the wide interest rate gap between the U.S. and Japan continues to keep the dollar strong. The uptrend remains intact, so without intervention, buying on weakness may continue to work in the short term. However, medium-term traders may look for selling opportunities around 162, expecting the risk of Bank of Japan intervention to increase at these levels. Resistance is at 162.00 and 165.00, while support is seen at 161.00, 160.50, 160.00, 159.00, 158.00, 157.00, 156.00, 155.50 and 155.00.
Gold
Gold broke below the $4,000 level midweek as U.S. inflation expectations remained high, despite the recent fall in crude oil prices. Prices recovered toward the end of the week, but the broader downtrend remains strong as the U.S. dollar continues to rise. For now, selling into strength still looks like the better short-term strategy unless gold can move back above the 10-day moving average and build stronger upside momentum. Resistance is at $4,200, $4,300, $4,400, $4,500, $4,600 and $4,665, while support is at $4,000, $3,900, and $3,800.
Crude Oil
The resumption of crude oil supplies from the Middle East pushed WTI crude lower again last week, with prices moving close to levels seen before the Iran-U.S. conflict. Negotiations over the terms to end the conflict are still continuing, but markets appear to be expecting a positive outcome. The short-term trend remains weak, with the 10-day moving average pointing clearly lower. However, support is holding near $70, so range trading between $70 and $75 could provide opportunities this week. Resistance is at $75, $85, $90, $95 and $100, while support is at $70, $67.50, and $65.
Bitcoin
Bitcoin failed to break above the $65,000 resistance level, encouraging sellers to return and pushing prices back toward the bottom of the recent range. The 10-day moving average is now pointing lower again, suggesting further downside is possible in the short term. Resistance is at $65,000, $75,000, $80,000, $85,000, and $90,000, while support is at $60,000, $55,000 and $50,000.
This Week’s Focus
- Monday: Japan Retail Sales and Construction Orders
- Tuesday: Japan Unemployment Rate and Industrial Production, China Manufacturing PMI, U.K. GDP, U.S. S&P/CS HPI Composite, Chicago PMI and CB Consumer Confidence
- Wednesday: Australia S&P Global Manufacturing PMI and Building Approvals, Japan Tankan Large Manufacturers Index and S&P Global Manufacturing PMI, E.U. HCOB Eurozone Manufacturing PMI and CPI, U.S. S&P Global Manufacturing PMI
- Thursday: Australia Trade Balance, E.U. Unemployment Rate, U.S. Nonfarm Payrolls and Factory Orders
- Friday: Australia S&P Global Services PMI, Japan S&P Global Services PMI, E.U. HCOB Eurozone Services PMI, U.K. S&P Global Services PMI, U.S. Independence Day Holiday
It will be a shortened trading week due to Friday’s U.S. Independence Day holiday, with U.S. employment data released on Thursday as the main event. Traders will be watching whether crude oil continues to fall back toward levels seen before the Middle East tensions began, and whether equities can stay near recent highs or face more pressure from concerns over AI valuations. Gold is also likely to remain in focus, with volatility expected around the $4,000 level.
EURGBP: Sells Off from Extreme Area (Blue Box)
In the world of trading, timing is everything. The EURGBP chart below highlights an important lesson in market analysis: waiting for the right area of interest can make the difference between chasing price and positioning with a clear plan.
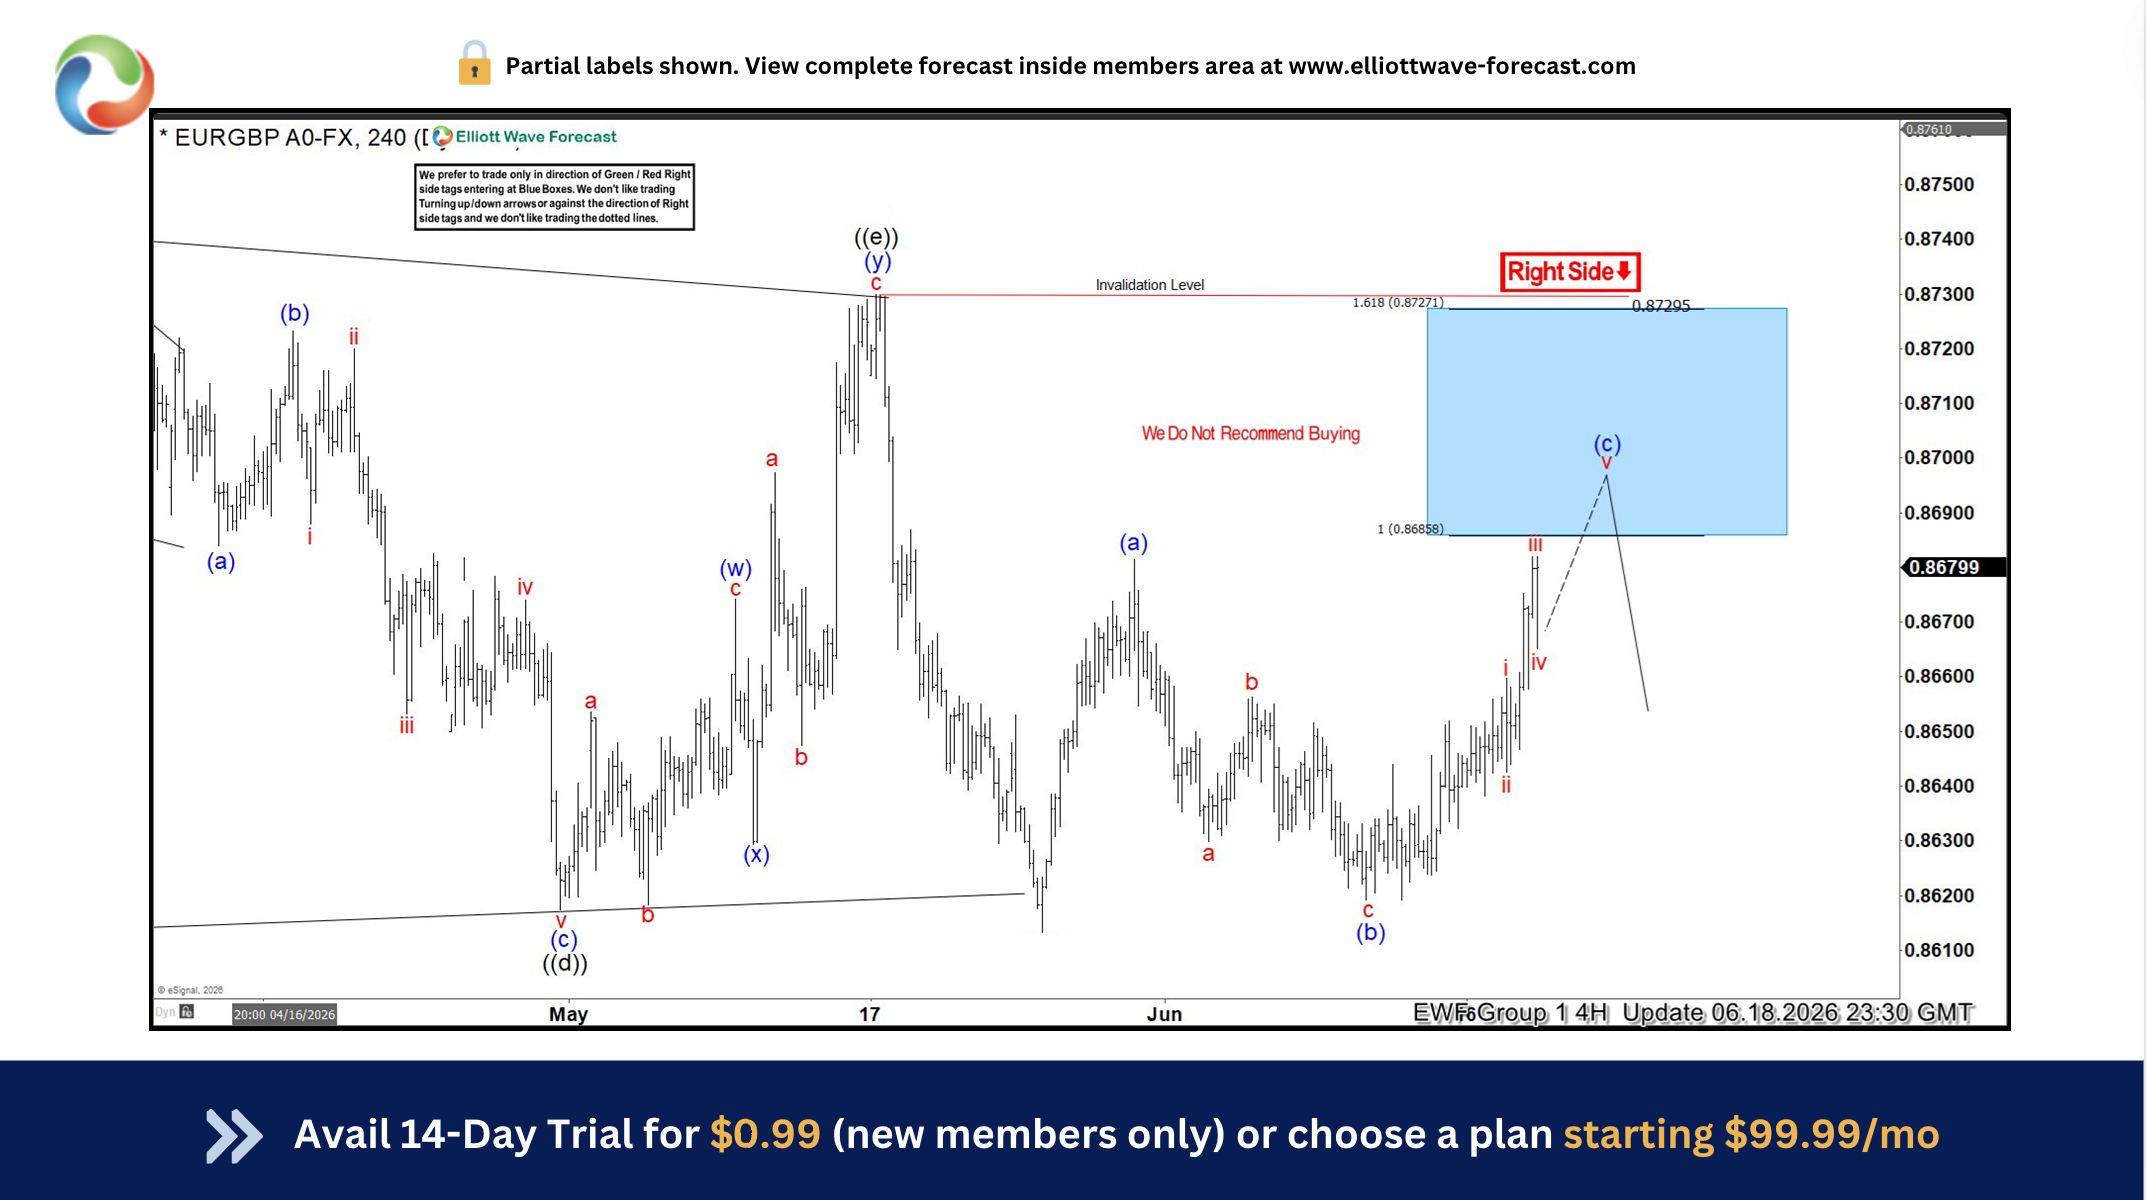
Using Elliott Wave analysis, the market structure suggested that EURGBP was not in a favorable area to Sell immediately. Instead, the focus was placed on waiting for price to complete its corrective pattern and reach the projected Blue Box area, where a higher-probability reaction was expected.
The Elliott Wave Roadmap
The chart shows EURGBP developing a corrective structure. The analysis identified that price was moving through a wave sequence and that the final leg higher was expected to complete inside the Blue Box area.
Rather than buying into strength or reacting emotionally to short-term movements, the forecast highlighted:
- A potential completion zone for the correction
- A defined area where Sellers could become interested
- A clear invalidation level that would determine whether the idea remained valid
This approach demonstrates one of the biggest advantages of Elliott Wave analysis: it provides traders with a roadmap instead of a reaction.
Why the Blue Box Matters?
The Blue Box represents a high-probability reversal zone derived from Fibonacci relationships within the Elliott Wave structure.
The key idea was simple:
Do not sell in the middle of the move. Wait for price to reach the area where the wave structure suggests the correction may be complete.
Many traders struggle because they enter too early. They see price moving and fear missing out. However, Elliott Wave encourages discipline by allowing the market to come to your planned level.
The Importance of Patience in Trading
The chart also includes the message:
“We do not recommend buying”
This is a powerful reminder that not every price movement creates an opportunity. Sometimes the best trade decision is no trade at all.
A disciplined trader understands:
- A setup is not complete until all conditions are met
- Patience protects capital
- Waiting for confirmation improves risk management
Managing Risk with Invalidation
Another important element shown on the chart is the invalidation level above the projected zone.
Every Elliott Wave setup requires a point where the analysis becomes incorrect. This allows traders to define risk before entering.
A proper trading plan includes:
- Where price is expected to react
- Where the idea is invalid
- The potential reward compared to the risk (Inside Members Area)
Without invalidation, a forecast becomes a guess.
The Forecast: Waiting for the Blue Box
The initial EURGBP analysis showed price moving into a corrective phase. Instead of buying before confirmation, the forecast identified the Blue Box as the area where the wave structure suggested buyers could become exhausted and sellers could step in.
The key principles were:
- Wait for price to reach the projected zone
- Avoid entering in the middle of the move
- Use invalidation levels to control risk
- Trade only when structure aligns with the forecast
The Blue Box represented a high-probability area based on the Elliott Wave pattern and Fibonacci relationships.
What Happened After Price Entered the Blue Box?
Once EURGBP reached the Blue Box area, price reacted exactly as the forecast anticipated.
The market pushed into the target zone, completing the expected wave structure. After reaching the area, momentum started to weaken and price failed to continue higher.
Instead, EURGBP reversed lower and moved away from the Blue Box. Se bellow chart.
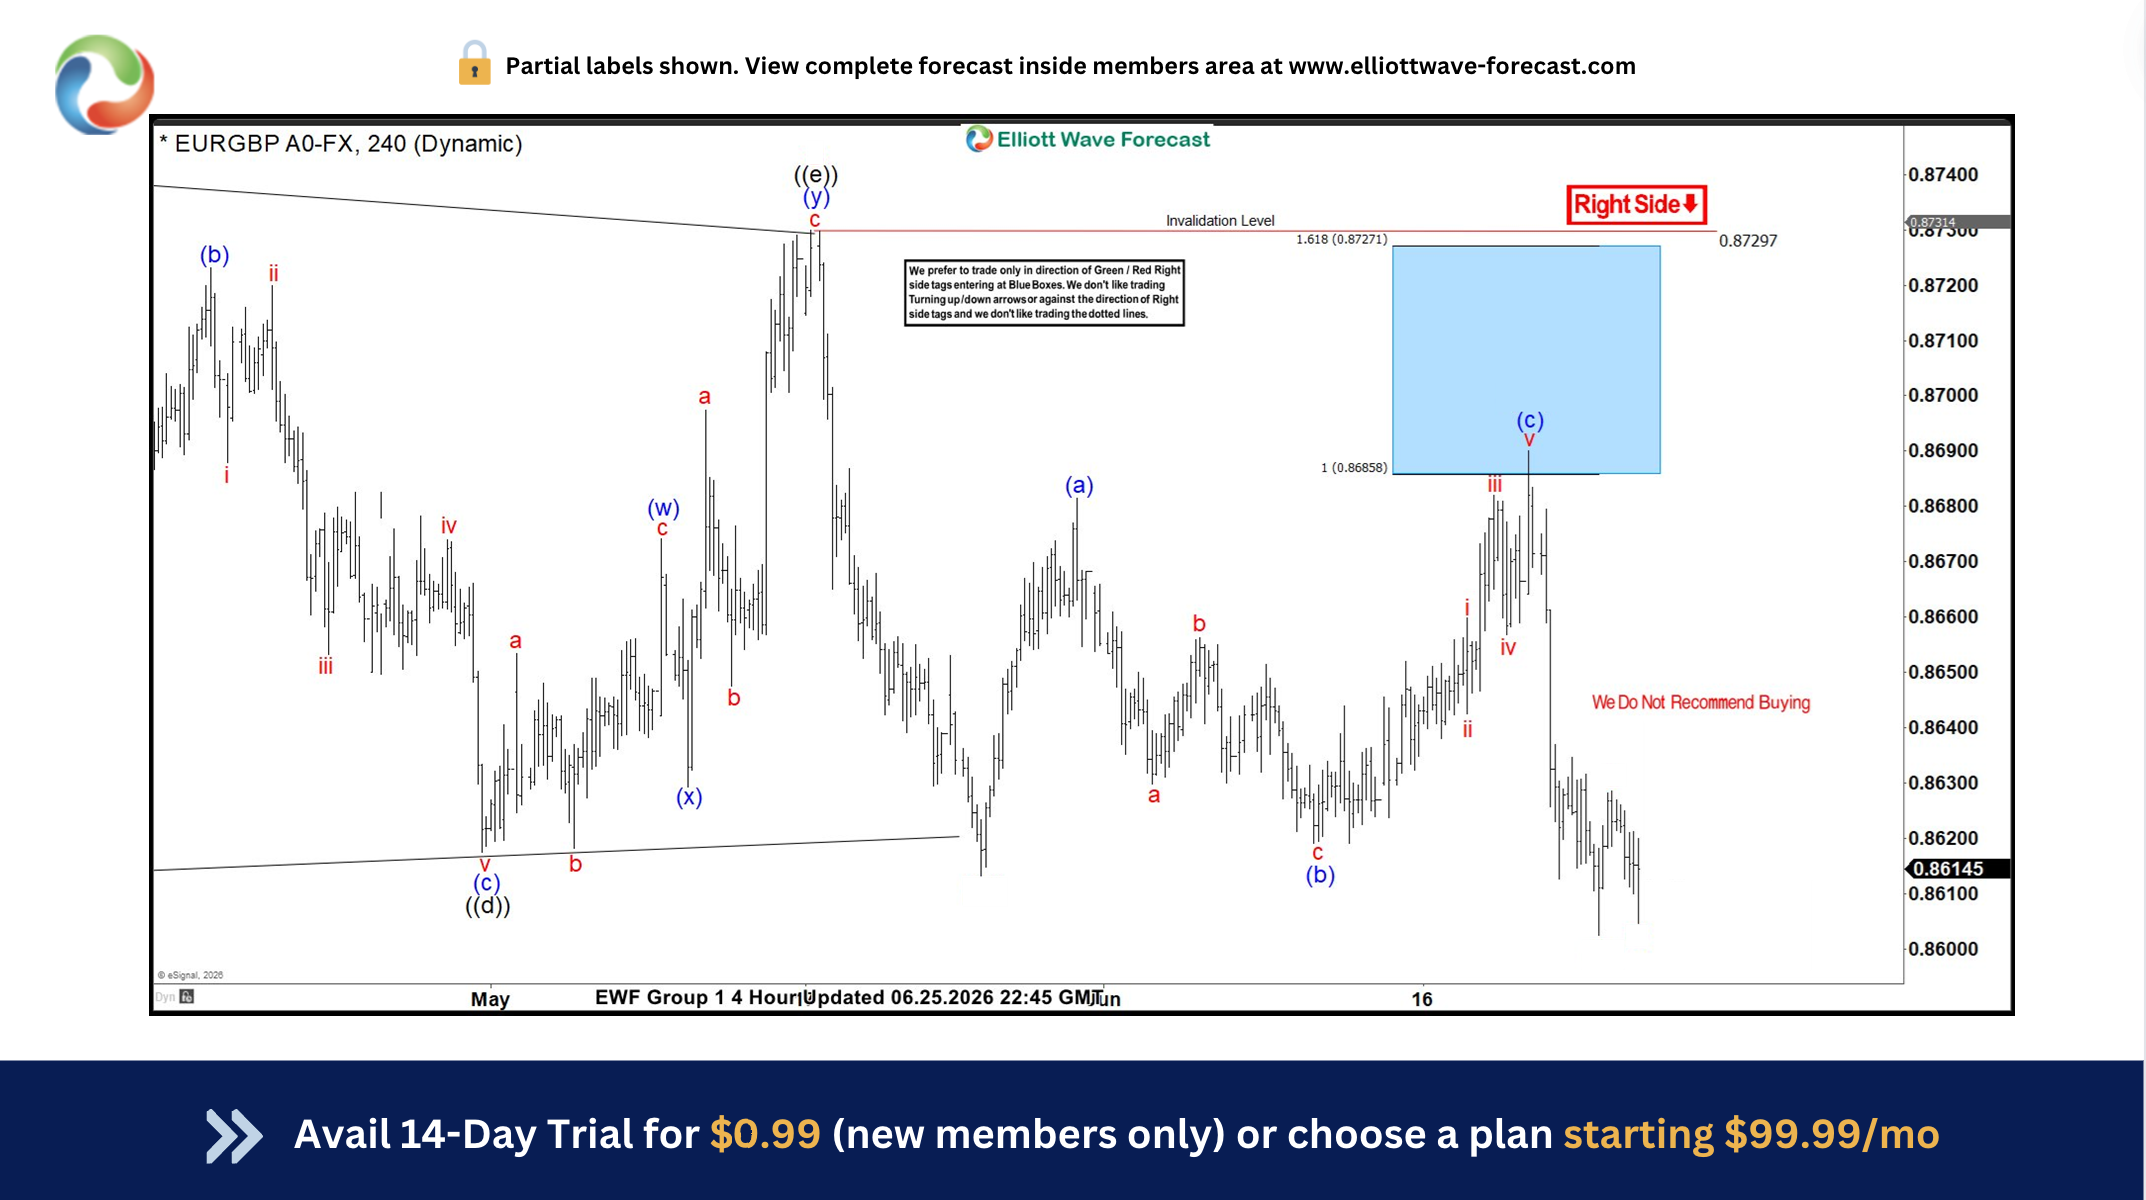
This reaction demonstrated the importance of having a predefined trading area. The forecast did not rely on predicting every candle — it focused on identifying where the market had a higher probability of changing direction.
The Power of Having a Trading Plan
Many traders struggle because they enter after a move has already happened. They buy after price rallies or sell after price falls, often placing themselves in poor positions.
The EURGBP example shows a different approach:
- Identify the wave structure
- Mark the potential completion zone
- Wait patiently for price to arrive
- Look for confirmation and manage risk
The Blue Box created a framework where traders could prepare instead of react emotionally.
Elliott Wave and Market Timing
Elliott Wave analysis is not about predicting the future with certainty. It is about understanding market structure and probabilities.
In this case, the structure suggested that the corrective move had a likely completion area. When price reached that zone, the market responded with the expected reversal.
This is why patience is one of the most important skills in trading.
The Lesson from EURGBP
The EURGBP setup highlights three important trading lessons:
- The market rewards patience
The best entries often come after waiting, not chasing. - A forecast needs a location
Knowing where price may react is more valuable than simply knowing the direction. - Risk management is part of the analysis
A valid setup includes both an opportunity zone and an invalidation level.
The EURGBP Blue Box reaction is a reminder that disciplined trading is about waiting for the market to reach your level — then acting with confidence when the setup appears.
Why EWF ?
At Elliottwave Forecast (EWF), we deliver consistent market updates through regular charts update. Our analysts update 1‑hour charts four times daily and 4‑hour charts once per day across all 78 instruments. In addition, we host five live sessions each day and maintain a 24‑hour chatroom, providing clients with real‑time market guidance and answers to any questions they may have.
You can start a 14‑day trial with us today here and cancel anytime by emailing support@elliottwave-forecast.com
USDJPY Eases from New High, Traders Remain Cautious of Intervention Risk
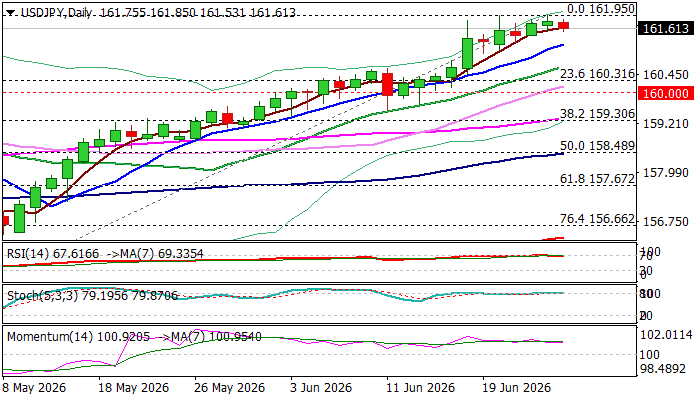
USDJPY was a tad lower on Friday but remains close to new peak at 161.95 (Thursday / 3 July 2025) and in the zone where Japanese authorities may intervene.
Profit-taking at the end of the week and on overbought daily studies was mainly behind today’s easing, which is likely going to be limited, as dollar remains well supported by strong expectations for Fed rate hike, as well as gap in interest rates between the US and other major economies (particularly BoJ rates).
The pair is on track for another weekly gain and second consecutive monthly advance; however, traders remain cautious about looming intervention.
Daily RSI is emerging from overbought territory though overall picture on daily chart remains firmly bullish.
Rising 10DMA (161.21) marks initial support, followed by 20DMA (160.65) and psychological 160 level, which should contain extended dips to keep larger bulls intact.
Res: 161.95; 162.89; 163.57; 164.24
Sup: 161.21; 160.65; 160.31; 160.00