Sample Category Title
USD/JPY Daily Outlook
Daily Pivots: (S1) 156.96; (P) 157.36; (R1) 157.99; More...
Intraday bias in USD/JPY stays neutral at this point. On the downside, below 156.41 minor support will bring retest of 155.01. Firm break there will resume the fall from 160.71 to 152.25 support next. On the upside, however, firm break of 157.92 will indicate that pullback from 160.71 has completed, and turn bias back to the upside for stronger rebound.

In the bigger picture, for now, corrective pattern from 161.94 (2024 high) is still seen as completed at 139.87. Rise from there is seen as resuming the long term up trend. So, break of 161.94 is expected at a later stage to resume the long term up trend. However, sustained break of 55 W EMA (now at 154.13) will dampen this view and bring deeper fall back towards 139.87 to extend the pattern from 161.94.
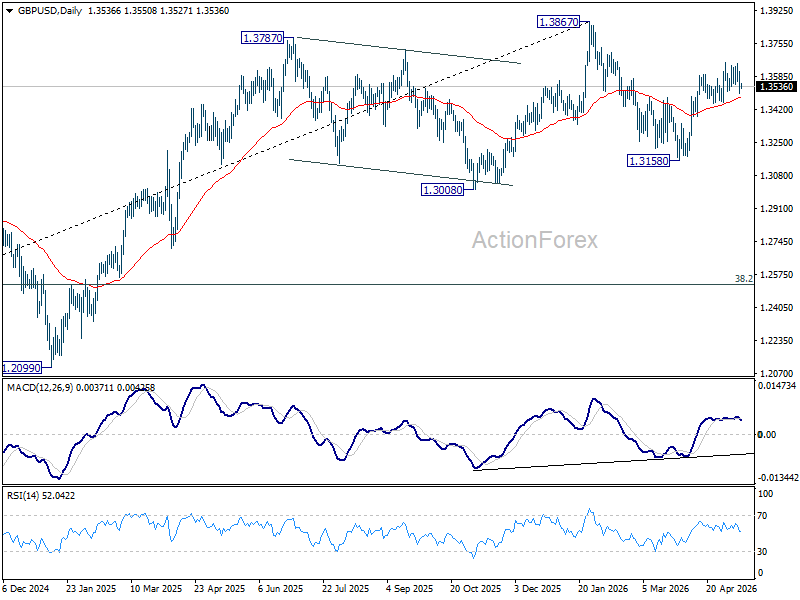
GBP/USD Daily Outlook
Daily Pivots: (S1) 1.3488; (P) 1.3548; (R1) 1.3597; More...
Intraday bias in GBP/USD remains neutral for the moment. Further rise is expected with 1.3453 support intact. On the upside, firm break of 1.3657 will resume the rally fro 1.3158 to retest 1.3867 high. However, decisive break of 1.3453 will argue that the rebound has already completed, and turn bias to the downside for retesting 1.3158 instead.
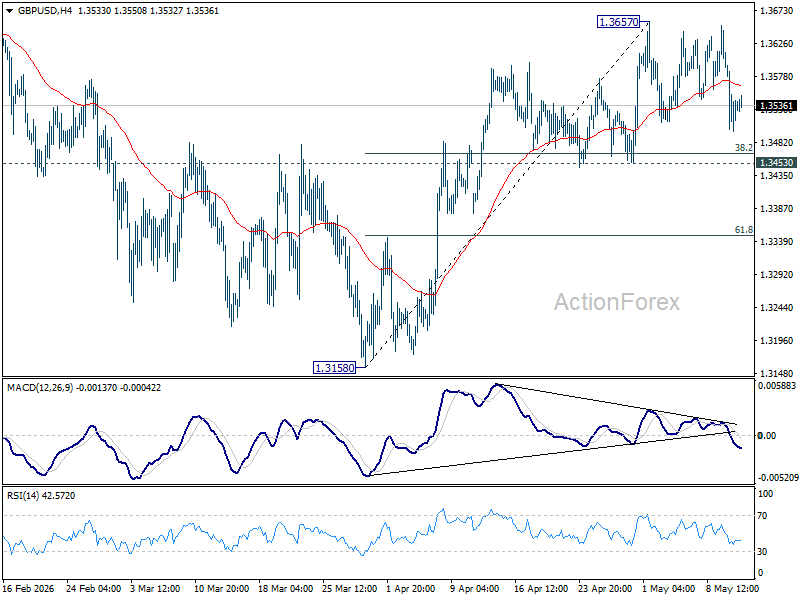
In the bigger picture, current development suggests that price actions from 1.3867 are merely a corrective pattern within the broader up trend from 1.0351 (2022 low). With 1.3008 support intact, medium term bullishness is maintained and break of 1.3867 is in favor for a later stage, towards 1.4248 key resistance (2021 high).
USD/CHF Daily Outlook
Daily Pivots: (S1) 0.7770; (P) 0.7796; (R1) 0.7827; More….
USD/CHF is staying in range trading and intraday bias remains neutral for the moment. With 0.7847 resistance intact, further decline is expected. On the downside, decisive break of 0.7760 will resume the whole decline form 0.8041, and target 100% projection of 0.8041 to 0.7774 from 0.7923 at 0.7656. However, firm break of 0.7847 resistance will indicate short term bottoming, and bring stronger rebound back to 0.7923 resistance.
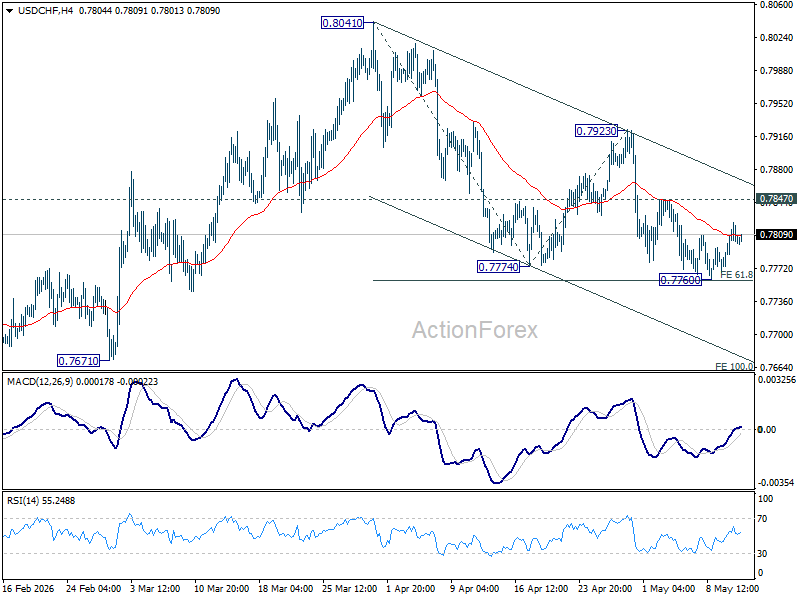
In the bigger picture, as long as 55 W EMA (now at 0.8051) holds, fall from 0.9200 is expected to continue, as part of the larger down trend. Firm break of 0.7603 will target 100% projection of 1.0146 (2022 high) to 0.8332 from 0.9200 at 0.7382.
AUD/USD Daily Report
Daily Pivots: (S1) 0.7214; (P) 0.7232; (R1) 0.7257; More...
Intraday bias in AUD/USD remains neutral as consolidations continue below 0.7277. With 0.7101 support intact, further rally is expected. On the upside, above 0.7277 will resume larger up trend and target 61.8% projection of 0.6420 to 0.7187 from 0.6832 at 0.7306.
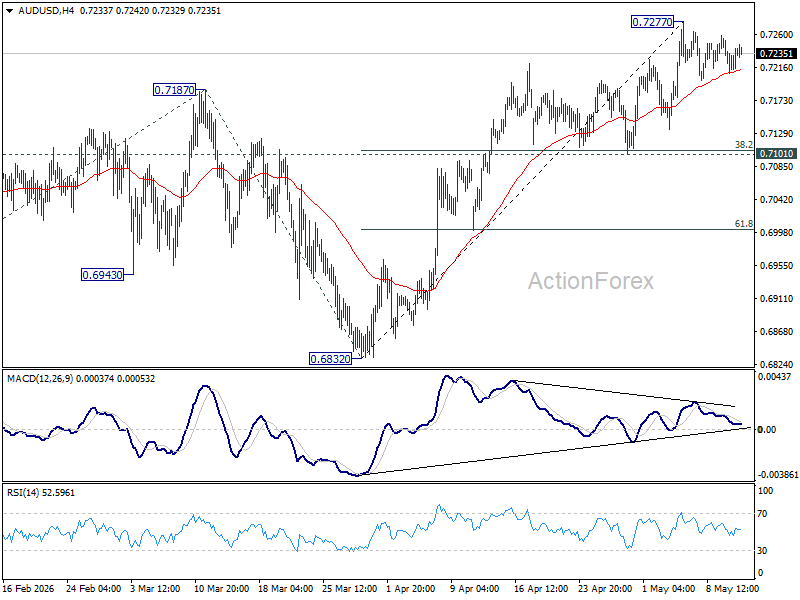
In the bigger picture, rise from 0.5913 (2024 low) is still in progress. Decisive break of 61.8% retracement of 0.8006 to 0.5913 at 0.7206 will solidify the case that it's already reversing the down trend from 0.8006 (2021 high). Further rally should then be seen to retest 0.8006. For now, outlook will remain bullish as long as 0.6832 support holds, in case of pullback.
PPI to Test CPI Signals
In focus today
In the US, April PPI data is due for release. Yesterday's CPI print showed sticky monthly services and super-core inflation, reinforcing concerns around persistent underlying price pressures. Markets will watch whether PPI confirms similar price momentum.
In the euro area, we will receive the second estimate of GDP growth in Q1. Focus is on the data on employment growth, which we expect at 0.1% q/q.
In Sweden, the final figures for April inflation are expected to confirm the low preliminary numbers, with CPIF at 0.8% y/y and underlying inflation at 0% y/y. We will also get an answer to what contributed to the low services inflation. It could be administrative prices, but there is also considerable uncertainty around travel related services, which vary greatly depending on the season. This year there is a new measurement method for certain hotels and new information for air travel.
In addition to the inflation details, we will also receive the Riksbank minutes from last week's rate announcement,.
Due to Ascension Day, Danske Morning Mail returns on Monday, 18 May. During the break, key releases include US retail sales and UK March/Q1 GDP on Thursday, while Thursday-Friday sees President Trump's visit to China to meet President Xi Jinping. We do not expect major breakthroughs, though smaller deals on trade, fentanyl and rare earth security are possible. Read more in Research US-China - Xi-Trump meeting preview: We expect no game changers, 12 May.
Economic and market news
What happened yesterday
In the US, headline inflation rose 0.6% m/m SA, in line with expectations, while core inflation was stronger than expected at 0.4% m/m SA (cons 0.3% m/m). Shelter rose 0.6% m/m and "super-core" (core services ex shelter) picked up to around 0.45% m/m, the highest in three months, underlining that domestic service price pressures remain uncomfortably firm. By contrast, core goods inflation was flat at 0.0% m/m, suggesting limited pass-through so far from higher commodity prices and keeping underlying pressures largely concentrated in services, reinforcing a cautious Fed. Read more in Global Inflation Watch - Shelter inflation boosts US CPI in April, 12 May.
In US monetary policy space, the Senate confirmed Kevin Warsh to a 14-year term as Federal Reserve governor by a 51-45 vote and is expected to vote as soon as today on a concurrent four-year term as Fed chair, positioning him to succeed Jerome Powell. Although Powell's term as chair formally ends on Friday, he stated last month that he will remain on the Fed board as a governor.
In the euro area, the German ZEW survey was slightly better than expected in May. The assessment of the current situation fell to -77.8 (cons: -78.0) from -73.7 while expectations improved to -10.2 (cons: -19.5, prior: -17.2). Despite the small improvement, expectations remain at very low levels as the industry-heavy German economy is expected to take a hit from higher energy prices. However, as the April manufacturing PMIs remained above 50 and the ZEW current assessment in May fell only to levels similar to what we saw in the last months of 2025, we are yet to see a significant hit on the German industry.
In the UK, more than 90 MPs called for PM Starmer to step down, and four ministers handed in their resignation yesterday. Bond markets fear looser fiscal policy in case of a change of leadership, which drove 30Y Gilt yields to the highest levels since 1998. If Starmer resigns, it could also open up for a more hawkish policy stance from the Bank of England, which was reflected in market pricing yesterday.
Equities: Global equities ended the day lower by 0.3% yesterday, after being down 1% at the lows. For once, semi-conductors in the S&P500 were among the weakest performers closing 1.4% lower, after being down about 4.5% earlier in the day. We will not overdo conclusions on such setback after an impressive 35% run over the past month. The defensive sectors, led by healthcare and staples, were among the top performers with gains of 1.9% and 1.6%, respectively in a broad based defensive outperformance. S&P500 closed down 0.2%, Nasdaq 0.7% lower, and Russell2000 down about 1%. Asian equities are mostly in green this morning after an initial setback. US and European futures are mostly in green today.
FI and FX: European yields ended the day higher across the board with 10Y Bunds breaking above 3.10% while 2Y EUR swap rates rose to close to 2.90% with now 85bp worth of hikes priced in for the ECB. The combination of higher energy prices, cautious risk sentiment and hot US CPI pushed EUR/USD lower yesterday. US inflation was faster than expected both in headline (3.8%; cons. 3.7%) and core terms (2.8%; cons. 2.7%). EUR/GBP was on the rise following mounting pressure for UK PM Starmer to resign. With up to 80 Labour MPs having called for Starmer to resign and six ministerial aides quit yesterday, prediction markets have ramped up bets of Starmer being out to around 70% by June and 85% by YE 2026. The SEK underperformed all G10 peers yesterday, with EUR/SEK pushing above 10.90 and USD/SEK rising to the 9.30-level. With no specific news out of Sweden, and Swedish rates moving mostly in line with European dittos in a larger risk-off move. Looking ahead, the rest of the week is quiet in terms of tier-1 data, but focus remains on Iran and the Trump-Xi meeting starting tomorrow.
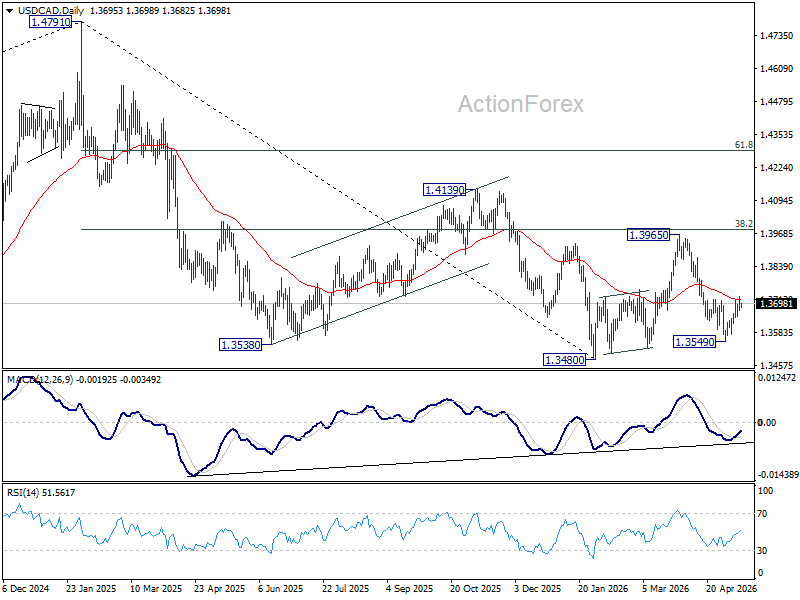
USD/CAD Daily Outlook
Daily Pivots: (S1) 1.3667; (P) 1.3695; (R1) 1.3722; More...
USD/CAD's breach of 1.3709 resistance indicates short term bottoming at 1.3549, on bullish convergence condition in 4H MACD. Rise from there is seen as the third leg of the corrective pattern from 1.3480. Intraday bias is mildly on the upside for further rise towards 1.3965 resistance. On the downside, though, break of 1.3646 minor support will bring retest of 1.3549 instead.
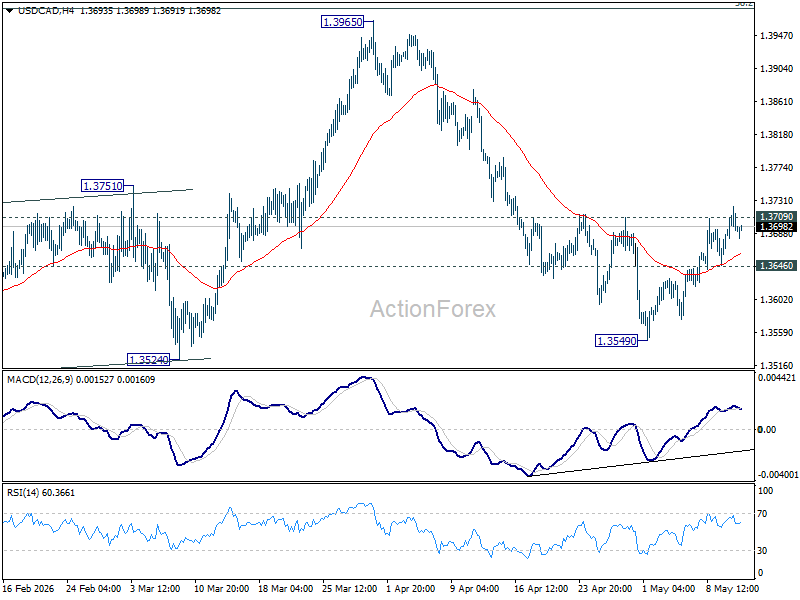
In the bigger picture, price actions from 1.4791 are seen as a corrective pattern to the whole up trend from 1.2005 (2021 low). Deeper fall could be seen, as the pattern extends, to 61.8% retracement of 1.2005 to 1.4791 at 1.3069. However, decisive break of 38.2% retracement of 1.4791 to 1.3480 at 1.3981 will argue that the correction has completed with three waves down to 1.3480 already.
Markets Hold Breath Ahead of Trump-Xi Summit as Hormuz Crisis Nears Critical Point
Markets are staying in a cautious holding pattern as investors awaited the highly anticipated Trump-Xi summit later this week, increasingly viewing the Beijing meeting as the decisive geopolitical checkpoint for both the Strait of Hormuz crisis and broader global trade relations. While financial markets remained relatively calm overall, underlying positioning continued reflecting elevated uncertainty around oil prices, inflation, technology supply chains, and geopolitical stability.
US equities closed mixed overnight, with NASDAQ retreating modestly after its recent record-setting rally. Asian markets traded mildly firmer led by gains in Japan and South Korea. Brent crude eased slightly but remained elevated above $106, signaling that geopolitical risk premium remains firmly embedded in energy markets even as traders avoid aggressive breakout positioning ahead of the summit. Gold continued fluctuating in a relatively tight range around the 4700 area, reinforcing the broader sense that markets are waiting for clearer direction from upcoming political developments.
In currency markets, Dollar remained the strongest major currency for the week so far, though without strong follow-through momentum. The greenback continued receiving support from rising oil prices and firmer US inflation data, which further reduced expectations for Federal Reserve rate cuts this year. Aussie is the second-strongest performer as resilient global risk appetite and AI-related optimism continued supporting commodity and semiconductor-linked assets. Loonie benefited from the rebound in crude prices.
By contrast, Yen is the weakest major currency as the impact of Japan’s recent intervention efforts faded. Sterling was the second weakest amid continuing concerns over political instability in the UK following mounting pressure on Prime Minister Keir Starmer after Labour’s poor local election performance. Swiss Franc also underperformed as rising global bond yields reduced demand for defensive assets. Euro and Kiwi traded closer to the middle of the major currency rankings.
The May 14–15 Trump-Xi summit in Beijing is viewed as far more than a standard diplomatic meeting. After Pakistan’s failed attempt to mediate between Washington and Tehran, markets see China as the only major power with enough economic leverage over Iran to help reopen the Strait of Hormuz. As the world’s largest buyer of Iranian oil and a likely cornerstone of Iran’s future reconstruction financing, Beijing is widely perceived as holding significant influence over Tehran’s strategic calculations.
That perception has effectively transformed the summit into the “Final Court of Appeal” for the Hormuz crisis. While discussions are expected to include tariffs, rare earth access, AI export controls, and broader trade relations, the energy and geopolitical dimension is likely to dominate market attention.
US President Donald Trump continued projecting a hardline posture ahead of the meeting. Speaking before departing for Beijing, Trump said he did not believe the United States needed China’s help to resolve the Iran conflict and reiterated that preventing Iran from obtaining nuclear weapons remained his only objective. “We’ll win it one way or the other, peacefully or otherwise,” he said, while also dismissing concerns about economic pain linked to the conflict. Markets, however, appear focused on whether the summit can ultimately produce enough diplomatic progress to prevent a longer and more economically damaging Hormuz crisis.
Meanwhile, the United States is reportedly seeking guaranteed access to Chinese-controlled critical minerals including rare earths, gallium, and germanium, while China remains eager for greater access to advanced US AI chips and semiconductor technology. The inclusion of Nvidia and Apple executives in summit-related discussions has intensified speculation that a broader “grand bargain” may be under consideration.
Washington could potentially ease certain technology export restrictions in exchange for stronger Chinese cooperation on Iran and regional energy stability. Such a framework could also involve expanded Chinese purchases of US agricultural, energy, and aerospace products under a new managed-trade arrangement.
In Asia, at the time of writing, Nikkei is up 0.79%. Hong Kong HSI is down -0.07%. China Shanghai SSE is up 0.45%. Singapore Strait Times is up 1.01%. Japan 10-year JGB yield is up 0.039 at 2.583. Overnight, DOW rose 0.11%. S&P 500 fell -0.16%. NASDAQ fell -0.71%. 10-year yield rose 0.05 to 4.46.
OECD Sees BoJ Raising Rates to 2% by End-2027
The OECD believes Japan’s monetary normalization cycle is still in its early stages, projecting the BOJ’s policy rate will rise from 0.75% to 2% by the end of 2027. Strong wage growth, resilient domestic demand, and improving inflation dynamics are increasingly supporting the case for continued tightening. Read More.
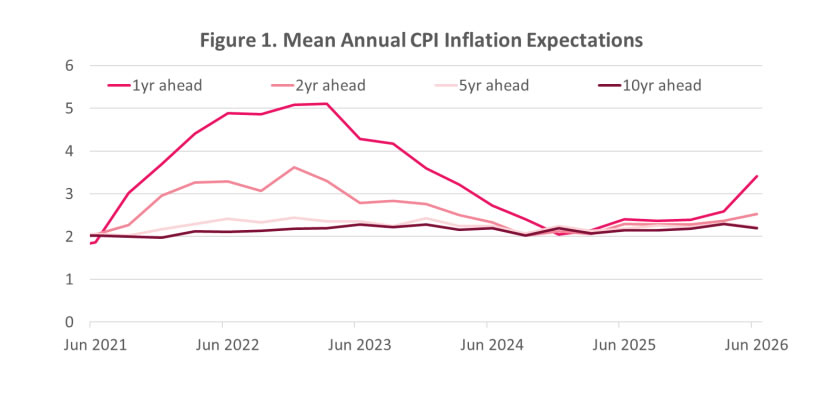
New Zealand Inflation Expectations Jump as RBNZ OCR Outlook Turns Hawkish
The RBNZ’s latest Survey of Expectations showed inflation concerns intensifying sharply in New Zealand, with one-year CPI expectations surging above 3.4% while markets also lifted their outlook for future OCR settings. At the same time, growth expectations weakened noticeably, highlighting a more difficult balancing act for policymakers. Read More.
Fed’s Goolsbee: Inflation Is Moving the Wrong Way, Labor Market Is Not
Chicago Fed President Austan Goolsbee warned that inflation is “going the wrong way,” expressing particular concern that services inflation remains too strong even beyond the direct impact of oil prices. Read More.
USD/CAD Daily Outlook
Daily Pivots: (S1) 1.3667; (P) 1.3695; (R1) 1.3722; More...
USD/CAD's breach of 1.3709 resistance indicates short term bottoming at 1.3549, on bullish convergence condition in 4H MACD. Rise from there is seen as the third leg of the corrective pattern from 1.3480. Intraday bias is mildly on the upside for further rise towards 1.3965 resistance. On the downside, though, break of 1.3646 minor support will bring retest of 1.3549 instead.
In the bigger picture, price actions from 1.4791 are seen as a corrective pattern to the whole up trend from 1.2005 (2021 low). Deeper fall could be seen, as the pattern extends, to 61.8% retracement of 1.2005 to 1.4791 at 1.3069. However, decisive break of 38.2% retracement of 1.4791 to 1.3480 at 1.3981 will argue that the correction has completed with three waves down to 1.3480 already.
Borrowed Stability
No surprise, US inflation accelerated in April – but the data released yesterday showed that it accelerated more than expected for both headline and core figures: the former rose to 3.8% – heavily impacted by the rapid rise in energy prices – while the latter, core inflation, the version that excludes food and energy prices due to their volatile nature, rose to 2.8%. Both are significantly higher and decidedly moving away from the Fed’s 2% inflation target. That was the predictable outcome of the Iranian war, which pushed US gasoline prices around 65% higher since the beginning of March.
On the front line, the Middle East war is at a standstill. The latest news suggests that Iranian crude exports from the main export port, Kharg Island, have just stopped. The US and Iran are incapable of finding an agreement to reopen the Strait of Hormuz. Oil flows are disrupted and global oil reserves are nosediving, pushing oil prices higher. Crude oil rose by more than 3% again yesterday and is consolidating above the $100pb mark this morning. Cherry on top, Russian oil flows also slowed last week, as several drone warnings reportedly disrupted ship loadings there.
Higher oil prices push inflation higher, but not only that. They also tame economic activity by raising operating costs for businesses. For households, they squeeze affordability.
In the US, for example, headline inflation now equals wage growth. Leading names including McDonald’s and Kraft Heinz warned last week that consumers are running out of money, meaning that if Americans keep spending, they will have to do so by taking on more debt. Consumer loans are already at record highs and still mounting, while interest rate cuts are no longer on the menu du jour. Not an excellent setup for healthy growth.
Elsewhere, the picture is no sunnier.
In Germany, the divergence between inflation and growth expectations is striking: it is screaming stagflation – high inflation, low growth. Energy crisis v2, resurging inflation, the trade war, Chinese EV competition, too much regulation, too much bureaucracy… Germany hasn’t been able to get its head above water since the Ukrainian war. The rest of Europe is also slowing and struggling as higher energy prices eat into purchasing power. To make matters worse, the European Central Bank (ECB) is expected to hike rates – maybe twice, maybe more – in the second half of the year to fight inflation.
Across the Channel, Brits are grappling with their own political shakeups after Nigel Farage scored big in the latest elections. The name Farage resonates in markets as a clearer path toward looser fiscal policy, higher spending and larger deficits, just as investors are already worried about Britain’s debt and inflation outlook. That combination is pushing investors to demand higher compensation to hold UK government debt, sending the UK 10-year gilt yield back above 5%. That’s the highest level since 1998. The higher the borrowing costs, the less the government can borrow, and the impact on growth would be negative. That’s why higher yields are weighing on sterling appetite; Cable tested the 1.35 level to the downside yesterday, while bears were also encouraged by a stronger dollar following the US CPI data.
And even in quiet and peaceful Switzerland, price pressures are being loudly felt at the pump, meaning that even a strong franc is not enough to fight back against energy-led inflation.
As such, global bond traders are worried – worried that central banks will have to raise rates to tame inflation.
Economists are worried too – worried that rate hikes will not do much other than further slowing economies without necessarily deflating prices, as the problem does not come from the demand side but from an external factor that will not go away with higher rates.
For the US, cutting rates into rising inflation is no longer an option, even with the Federal Reserve’s (Fed) brand new central banker who would – we all know – lower rates as soon as he could. But first, the war in the Middle East would need to end.
Meanwhile, AI spending continues to keep the US economy afloat – at least better than Europe’s. The jobs market is slowing, but payroll numbers continue to defy the mass layoffs announced by Big Tech and the threat of slowing consumer spending.
As such, the US 2-year yield – the best proxy for Fed rate expectations – rose to 4% yesterday after the hotter-than-expected inflation data.
The US dollar also rose, on the back of higher oil prices and a hawkish shift in Fed expectations following the inflation report. USDJPY advanced above the 100-DMA and headed toward 158.
On the equities front, the S&P 500 – which has been fully ignoring rising yields for a month – finally blinked and fell, before recovering losses as dip buyers stepped in near 7340. Amazingly, futures have also flipped back into positive territory from earlier losses.
The market is so crowded with dip buyers that the dips barely become perceptible.
But every new point on the S&P 500 and Nasdaq feels like another Jenga block balancing on borrowed stability.
I say that because the Korean Kospi erased $300bn in less than 100 minutes yesterday after a high-ranking politician floated the idea that the biggest winners of the AI race – we’re looking at you Samsung and SK Hynix – should pay citizens a “dividend” through taxes on AI profits. Earlier this month, Samsung’s labour union also demanded that 15% of operating profit be handed to chip division employees. Fifteen percent. Otherwise, employees would go on an 18-day strike. Apparently, the company and the union have not yet reached an agreement, increasing the likelihood of a strike, while the memory chip shortage driven by massive AI demand remains one of the biggest stories in the tech industry.
Nevertheless, Samsung is rebounding this morning thanks to strong buying appetite on expectations that the company could earn $220bn in operating profit this year. Yes, that’s more than Apple and Alphabet. Only Nvidia – the world’s most valuable company – is expected to earn more.
The latter has been fuelling investor appetite for months, leading to a 455% rise in Samsung’s stock price over the past year, more than a 1000% rally in SK Hynix shares and a 250% rise in the Kospi over the same period. All are deep in overbought territory, all calling for a healthy correction to release the building pressure before moving higher again.
US Inflation Reaccelerates to 3.8%, and Chip Stocks Falter
Key Takeaways
- US inflation accelerated sharply in April, with headline CPI rising to 3.8% y/y and core CPI to 2.8% y/y, reinforcing the “higher-for-longer” Federal Reserve narrative and effectively eliminating expectations for rate cuts in 2026.
- Semiconductor stocks led a broad technology pullback after an extended rally, with the Philadelphia Semiconductor Index falling 3% as major chip names, including Qualcomm and Intel, experienced aggressive profit-taking.
- Chart of the day: USD/JPY climbed toward the key 157.90 intervention risk zone as rising US yields strengthened the US Dollar, although bearish RSI divergence now signals growing short-term upside exhaustion risks.
Top Macro Headlines
- US consumer prices jump further: Headline annual US CPI inflation rose to 3.8% y/y in April, higher than expected and the highest in three years. This means real wage growth has turned negative for the first time since 2023. Core inflation also jumped to 2.8% y/y, its steepest rise since September 2025.
- Iran peace deal on “life support”: Hopes for a Middle East peace resolution are fading rapidly after US President Donald Trump stated the US-Iran ceasefire is on “life support,” sending oil prices sharply higher.
- Semiconductor sector sells off: A 70% rally over the past six weeks in chip stocks unraveled, with the Philadelphia Semiconductor Index falling 3%. Market darlings like Qualcomm, down 11.5%, and Intel, down 7%, dragged down the broader tech sector.
- US and Japan address FX volatility: Amid a surging US Dollar, US and Japanese officials, including Bessent, agreed that excess foreign exchange volatility is undesirable.
- Anthropic share transfer rules raise doubts: AI giant Anthropic updated rules surrounding the buying and transfer of its shares, raising doubts about ownership rights ahead of its highly anticipated IPO.
Key Macro Themes
- Fed rate cut bets wiped out: The historic energy shock and 3.8% CPI print have completely wiped out market expectations for Federal Reserve interest rate cuts this year. If the Fed does move, current pricing from the CME FedWatch tool shows it will be to tighten.
- Political pressures stoke global yields: Wary that a successor to UK leader Keir Starmer may increase borrowing, long-term UK bond yields have surged to their highest levels since 1998. This complements rising yields in the US due to inflation fears.
- Potential froth coming off the AI rally: The sharp decline in semiconductors suggests investors are taking profits from an overheated sector, exacerbated by wild volatility in Asian tech markets and rising long-term borrowing costs.
Global Market Impact
Equities: The S&P 500 fell 0.2%, and the Nasdaq 100 dropped 0.9%, dragged down by semiconductor stocks. The Dow inched higher by only 0.1%. Europe closed in the red. US healthcare was a bright spot, gaining 2% with UnitedHealth up 3%.
Fixed Income: US Treasury yields surged 5 bps across the curve, reacting to inflation data and a soft 10-year note auction characterized by a low bid/cover ratio. UK 30-year yields hit highs not seen since 1998.
FX: The US Dollar rose broadly as rate cut expectations evaporated. Sterling fell 0.5%, becoming the biggest decliner among major currencies amid UK political uncertainty.
Commodities: Oil prices rebounded aggressively on fading ceasefire hopes, with WTI surging 4% to move back above the critical $100/bbl level. Brent rallied by 3% to close at $107.70/bbl.
Asia Pacific Impact
- Stock markets: Japan managed to end higher on Tuesday, 12 May, but Asia ex-Japan broadly declined. South Korea's KOSPI ended down 2% after a wild rollercoaster ride, setting the tone for the global semiconductor sell-off.
- Currencies: The South Korean Won slumped 1% against the surging US Dollar, reflecting vulnerability to the global energy shock and risk-off sentiment.
- Economic outlook: Focus shifts heavily to the upcoming Trump-Xi Beijing summit. Investors are seeking clarity on AI policies and broader trade relations as inflation risks mount globally.
Top 4 Economic Data/Events to Watch Today
- AU Westpac Consumer Confidence (May) - 9.30 am SGT Impact: AUD/USD, AUD crosses, ASX 200
- Eurozone Q1 GDP Flash and Industrial Production (Mar) - 5.00 pm SGT Impact: EUR/USD, EUR crosses, DAX
- US Producer Price Inflation (Apr) - 8.30 pm SGT; consensus: 4.9% y/y, Mar: 4.0% y/y Impact: US Treasuries, USD, US stock indices
- Asian Earnings Heavyweights: Tencent, Alibaba, Nissan, SoftBank Impact: Hang Seng Index, Nikkei 225, global tech stocks
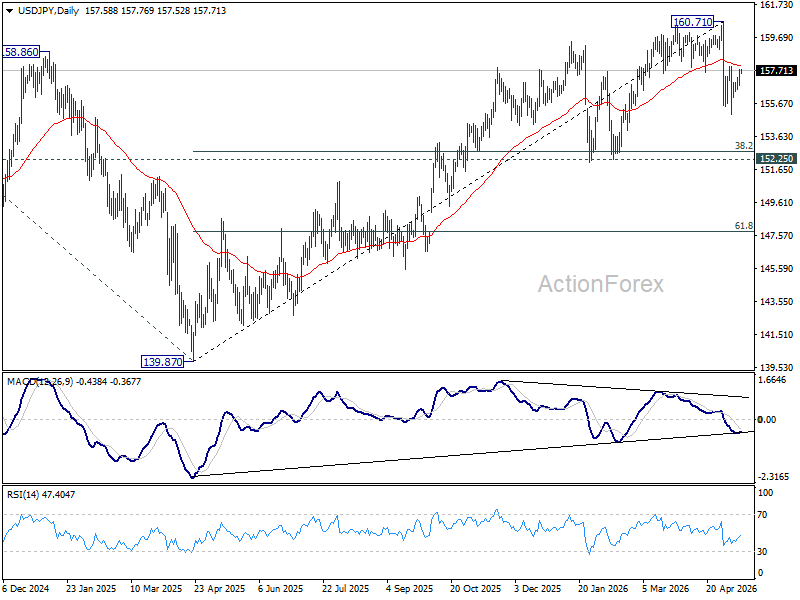
Chart of the Day: USD/JPY Squeezed Up to Intervention Risk Level of 157.90
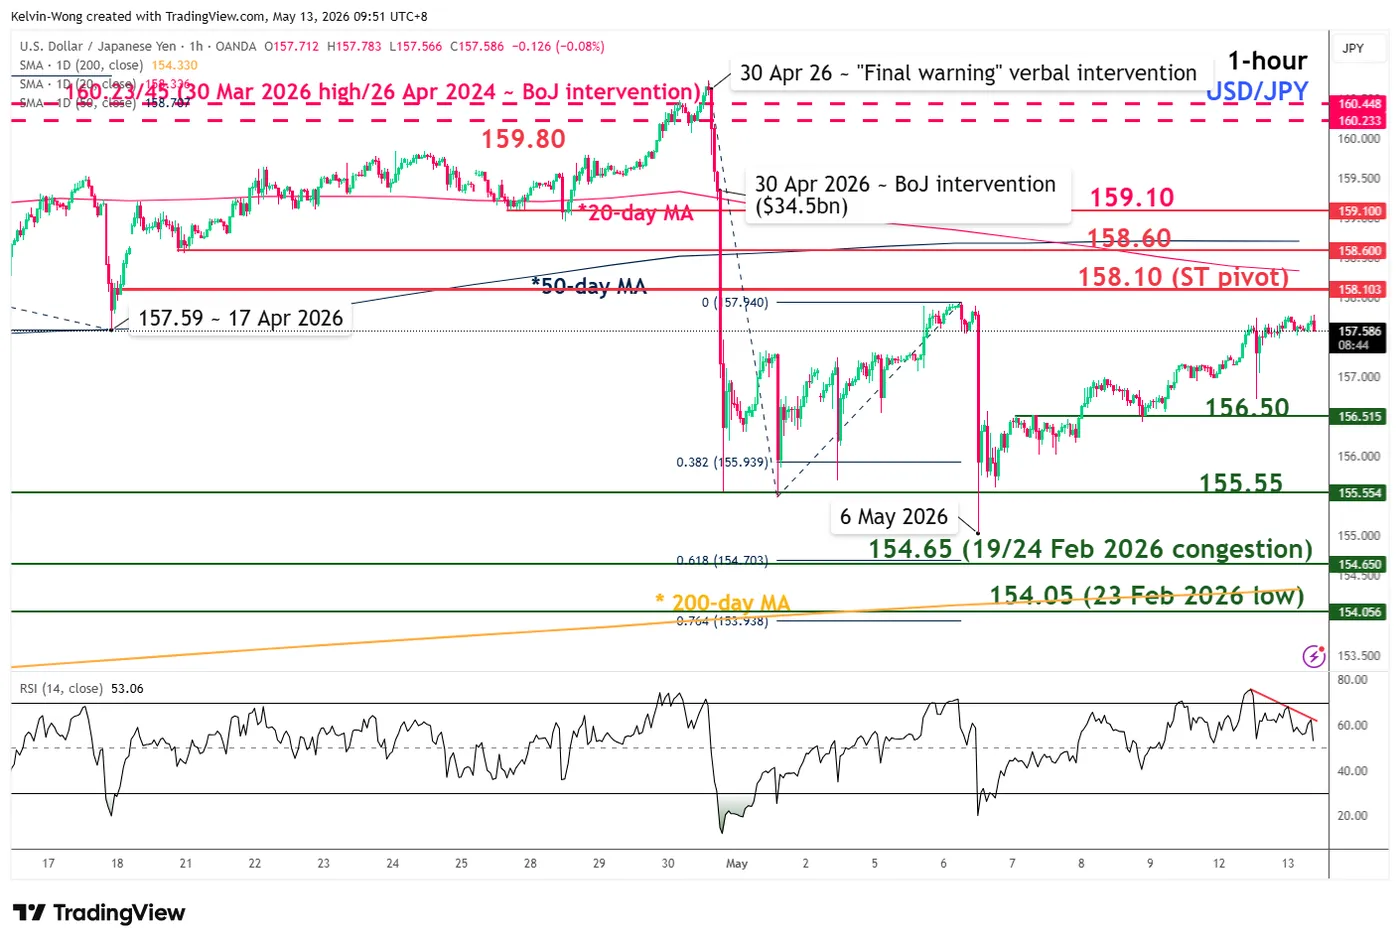
Fig. 1: USD/JPY minor trend as of 13 May 2026. Source: TradingView.
The recent four-day rebound of 1.8% in USD/JPY, from the 6 May 2026 low of 155.03, has reached the prior Japanese authorities’ “stealth intervention” level of 157.90.
In addition, short-term momentum has turned bearish, as the hourly RSI momentum indicator flashed a bearish divergence condition at its overbought region on Tuesday, 12 May, in the US session.
Watch the 158.10 key short-term pivotal resistance. A break below 156.50 may see a further potential drop to retest the next intermediate supports at 155.55 and 154.65.
However, a clearance with an hourly close above 158.10 negates the bearish scenario for a further squeeze up to see the next intermediate resistances coming in at 158.60, also the 50-day moving average, and 159.10.
New Zealand Inflation Expectations Jump as RBNZ OCR Outlook Turns Hawkish
New Zealand’s latest RBNZ Survey of Expectations showed a sharp rise in near-term inflation expectations, reinforcing concerns that price pressures may remain elevated even as growth slows. One-year-ahead CPI inflation expectations jumped from 2.59% to 3.41%, while two-year expectations rose from 2.37% to 2.53%, moving further above the Reserve Bank of New Zealand’s medium-term inflation target midpoint.
The survey, conducted shortly after official data showed annual CPI inflation holding at 3.1% in Q1, also pointed to a more hawkish interest rate outlook. Respondents lifted their expectation for the Official Cash Rate at the end of the June quarter from 2.25% to 2.34%. The one-year-ahead OCR expectation rose sharply from 2.58% to 3.01%. The shift suggests markets increasingly believe the RBNZ may need to raise interest rates amid persistent inflation pressures.
At the same time, the survey revealed a softer growth outlook. Expectations for one-year-ahead real GDP growth fell from 2.03% to 1.58%, while the two-year outlook eased from 2.30% to 2.16%.
| Indicator | Previous | Latest |
|---|---|---|
| Annual CPI Inflation | 3.1% | 3.1% |
| 1-Year Ahead CPI Expectations | 2.59% | 3.41% |
| 2-Year Ahead CPI Expectations | 2.37% | 2.53% |
| 5-Year Ahead CPI Expectations | 2.31% | 2.22% |
| 10-Year Ahead CPI Expectations | 2.30% | 2.19% |
| OCR Expectation (End-Jun 2026) | 2.25% | 2.34% |
| 1-Year Ahead OCR Expectations | 2.58% | 3.01% |
| 1-Year Ahead GDP Growth Expectations | 2.03% | 1.58% |
| 2-Year Ahead GDP Growth Expectations | 2.30% | 2.16% |