Sample Category Title
EURGBP: Sells Off from Extreme Area (Blue Box)
In the world of trading, timing is everything. The EURGBP chart below highlights an important lesson in market analysis: waiting for the right area of interest can make the difference between chasing price and positioning with a clear plan.
Using Elliott Wave analysis, the market structure suggested that EURGBP was not in a favorable area to Sell immediately. Instead, the focus was placed on waiting for price to complete its corrective pattern and reach the projected Blue Box area, where a higher-probability reaction was expected.
The Elliott Wave Roadmap
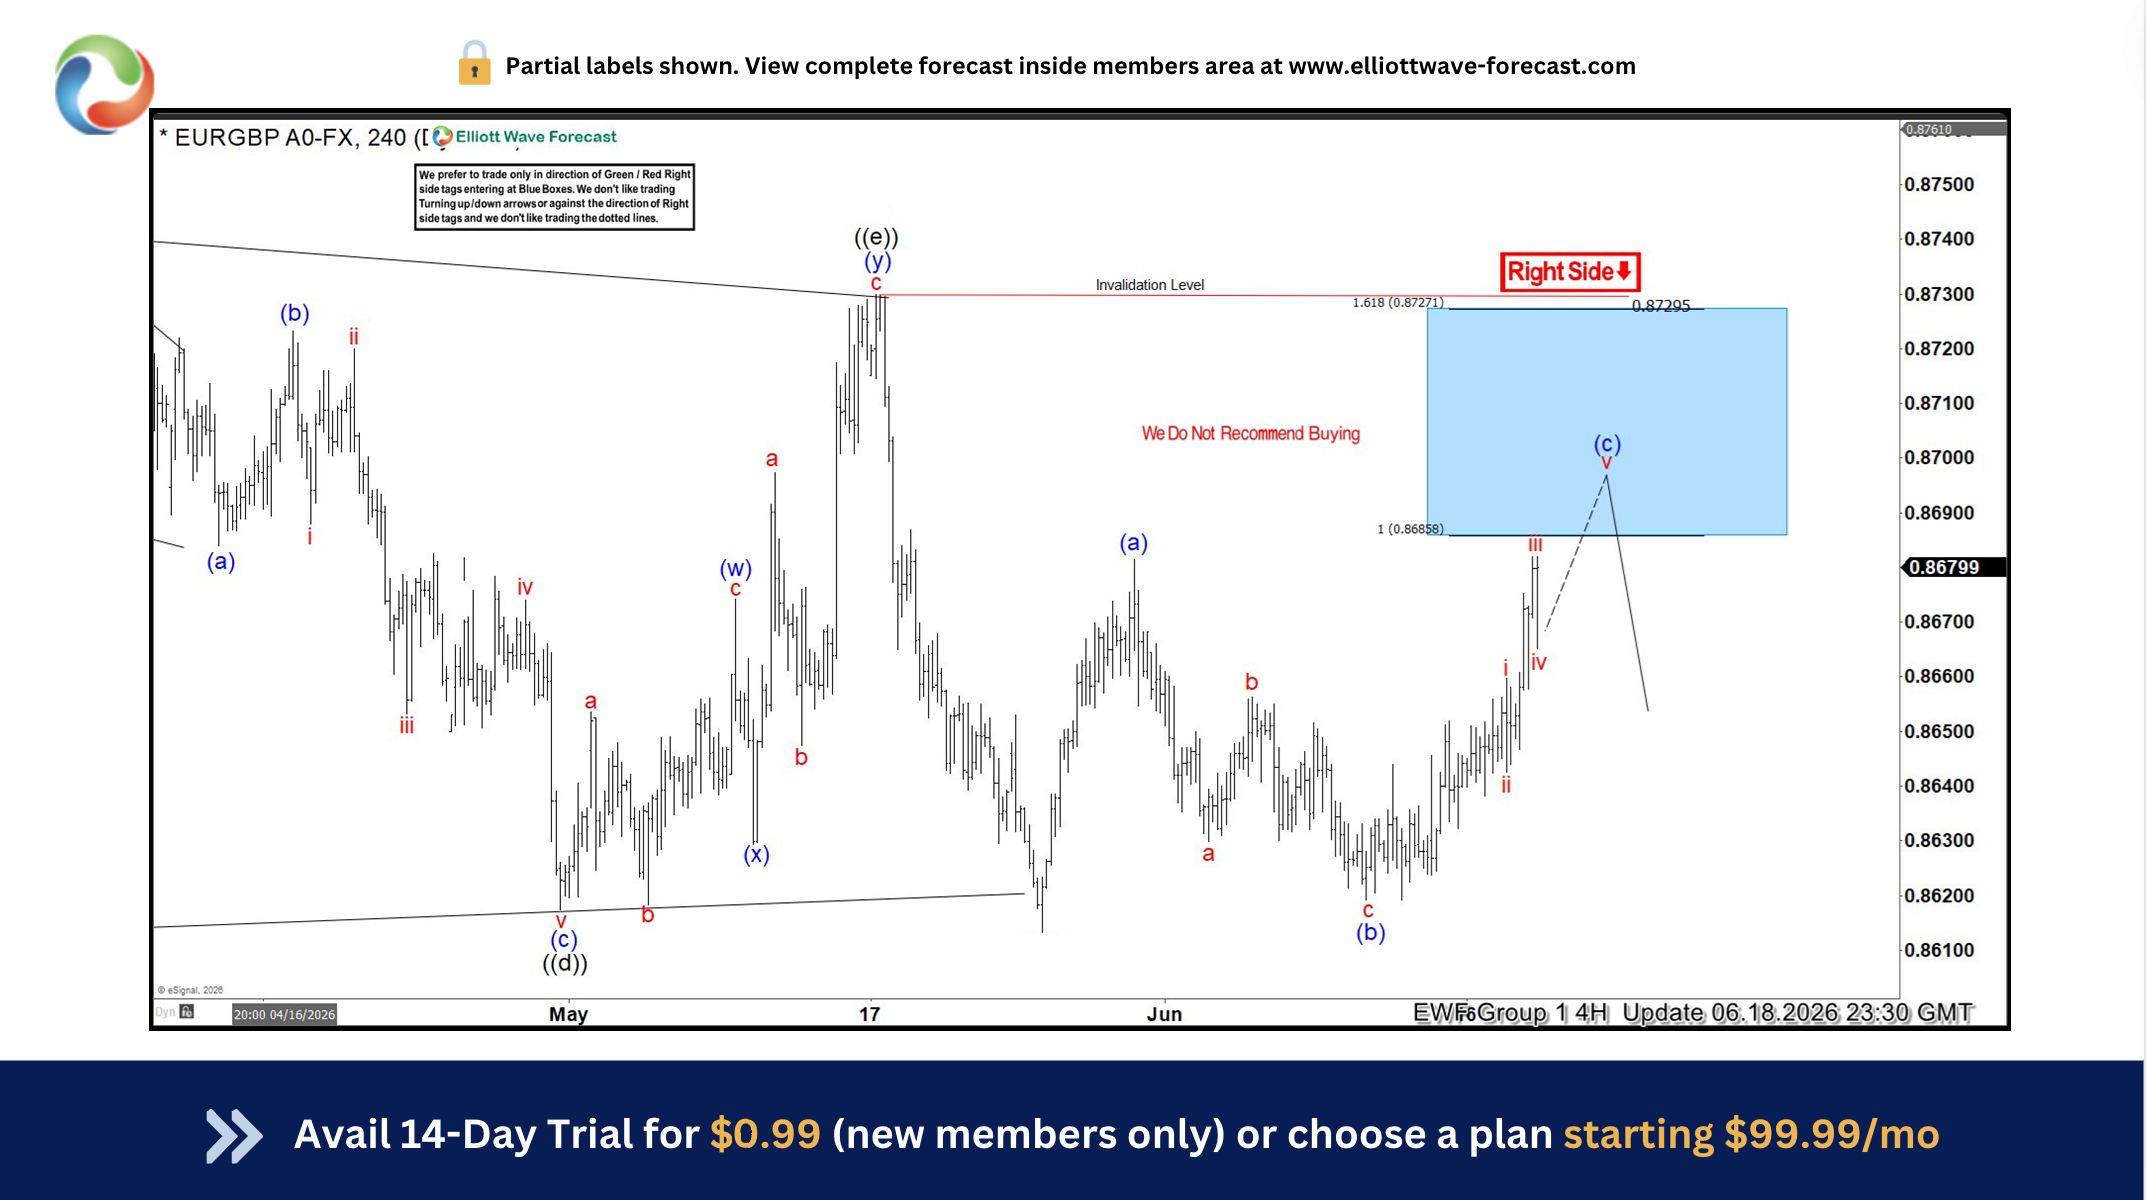
The chart shows EURGBP developing a corrective structure. The analysis identified that price was moving through a wave sequence and that the final leg higher was expected to complete inside the Blue Box area.
Rather than buying into strength or reacting emotionally to short-term movements, the forecast highlighted:
- A potential completion zone for the correction
- A defined area where Sellers could become interested
- A clear invalidation level that would determine whether the idea remained valid
This approach demonstrates one of the biggest advantages of Elliott Wave analysis: it provides traders with a roadmap instead of a reaction.
Why the Blue Box Matters?
The Blue Box represents a high-probability reversal zone derived from Fibonacci relationships within the Elliott Wave structure.
The key idea was simple:
Do not sell in the middle of the move. Wait for price to reach the area where the wave structure suggests the correction may be complete.
Many traders struggle because they enter too early. They see price moving and fear missing out. However, Elliott Wave encourages discipline by allowing the market to come to your planned level.
The Importance of Patience in Trading
The chart also includes the message:
“We do not recommend buying”
This is a powerful reminder that not every price movement creates an opportunity. Sometimes the best trade decision is no trade at all.
A disciplined trader understands:
- A setup is not complete until all conditions are met
- Patience protects capital
- Waiting for confirmation improves risk management
Managing Risk with Invalidation
Another important element shown on the chart is the invalidation level above the projected zone.
Every Elliott Wave setup requires a point where the analysis becomes incorrect. This allows traders to define risk before entering.
A proper trading plan includes:
- Where price is expected to react
- Where the idea is invalid
- The potential reward compared to the risk (Inside Members Area)
Without invalidation, a forecast becomes a guess.
The Forecast: Waiting for the Blue Box
The initial EURGBP analysis showed price moving into a corrective phase. Instead of buying before confirmation, the forecast identified the Blue Box as the area where the wave structure suggested buyers could become exhausted and sellers could step in.
The key principles were:
- Wait for price to reach the projected zone
- Avoid entering in the middle of the move
- Use invalidation levels to control risk
- Trade only when structure aligns with the forecast
The Blue Box represented a high-probability area based on the Elliott Wave pattern and Fibonacci relationships.
What Happened After Price Entered the Blue Box?
Once EURGBP reached the Blue Box area, price reacted exactly as the forecast anticipated.
The market pushed into the target zone, completing the expected wave structure. After reaching the area, momentum started to weaken and price failed to continue higher.
Instead, EURGBP reversed lower and moved away from the Blue Box. Se bellow chart.
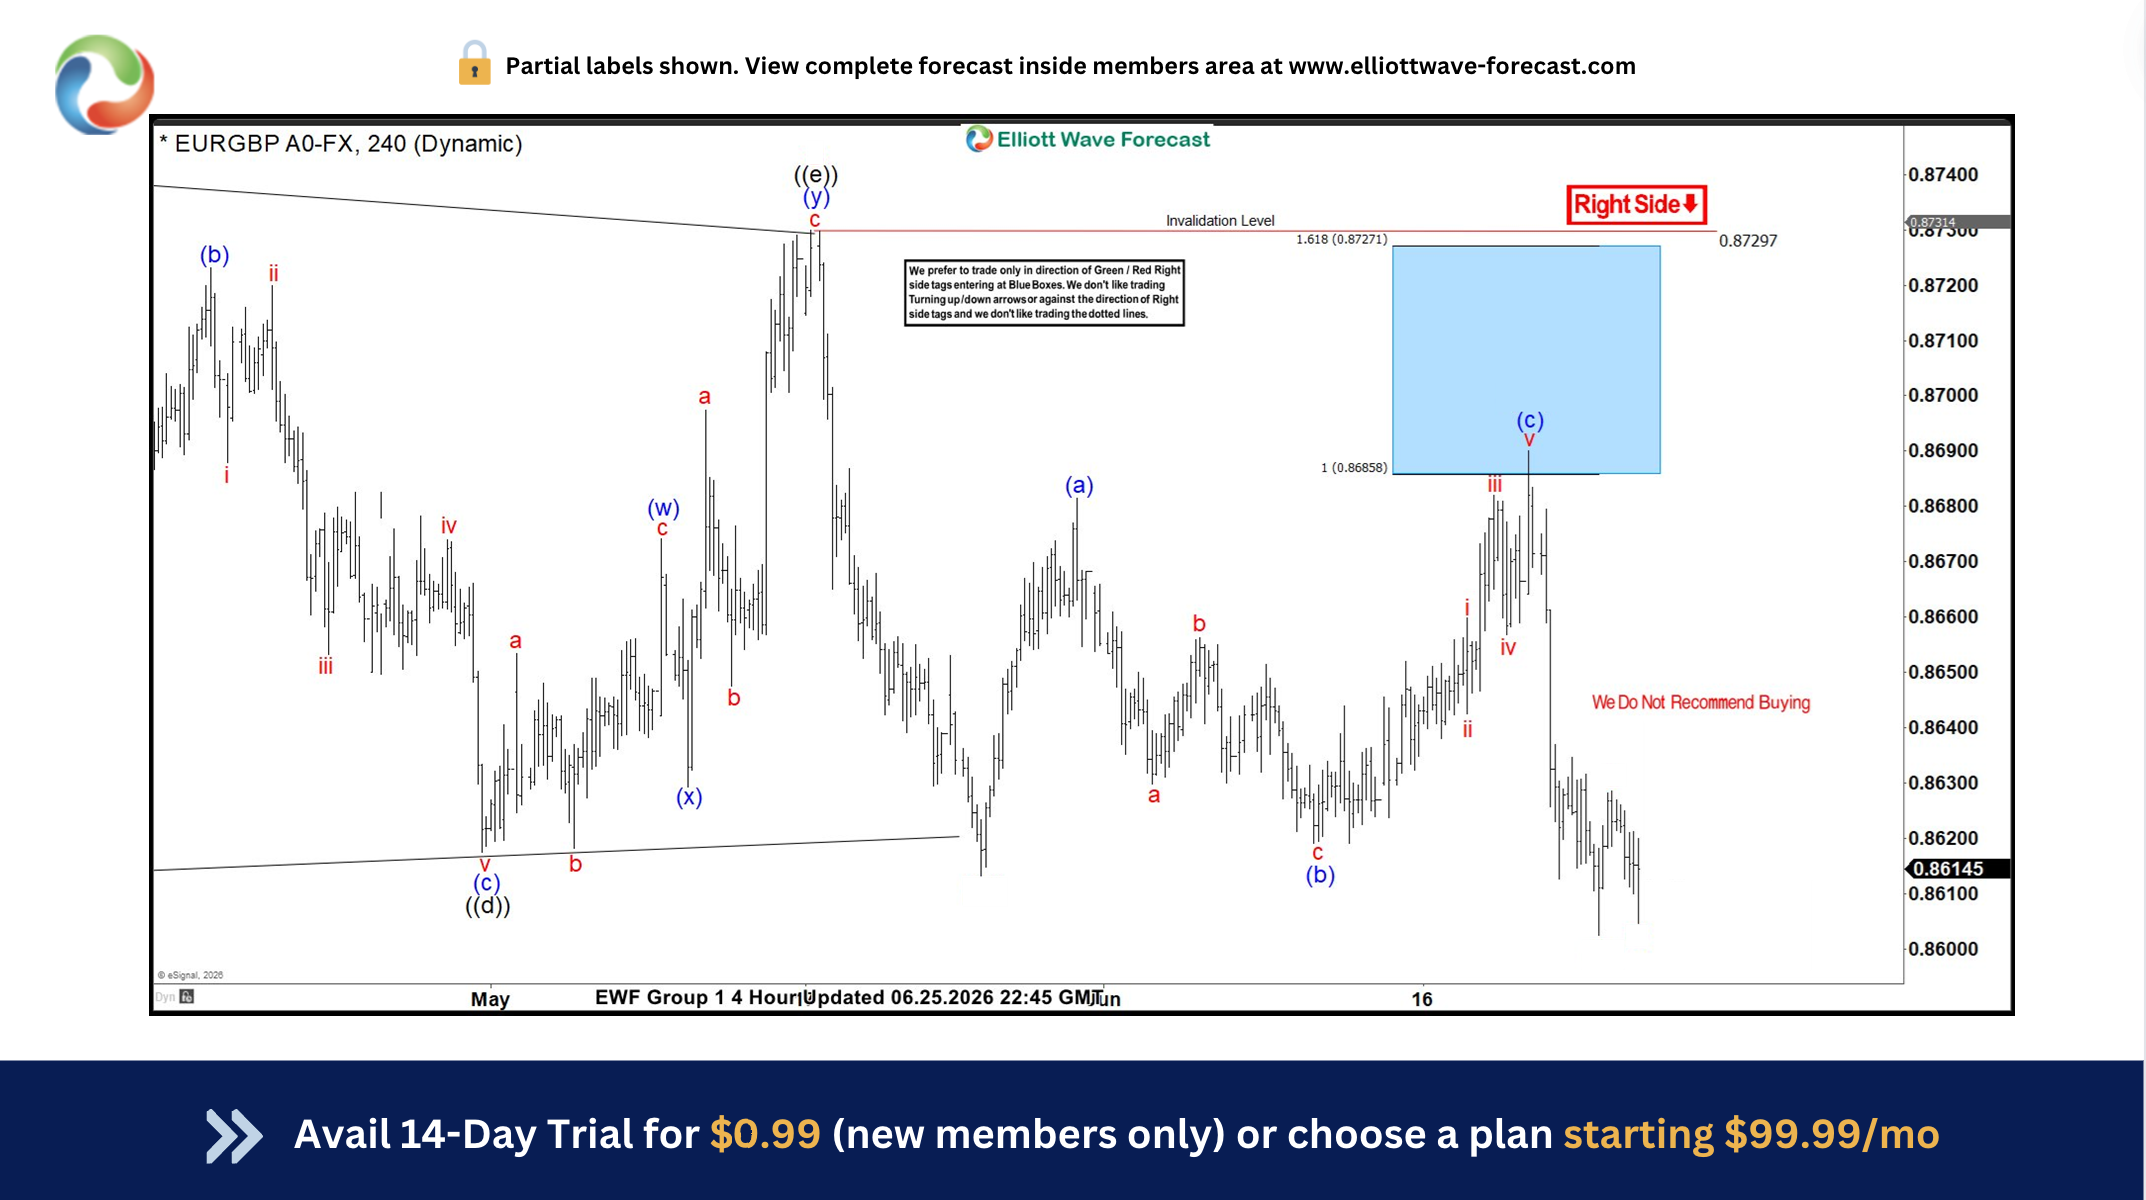
This reaction demonstrated the importance of having a predefined trading area. The forecast did not rely on predicting every candle — it focused on identifying where the market had a higher probability of changing direction.
The Power of Having a Trading Plan
Many traders struggle because they enter after a move has already happened. They buy after price rallies or sell after price falls, often placing themselves in poor positions.
The EURGBP example shows a different approach:
- Identify the wave structure
- Mark the potential completion zone
- Wait patiently for price to arrive
- Look for confirmation and manage risk
The Blue Box created a framework where traders could prepare instead of react emotionally.
Elliott Wave and Market Timing
Elliott Wave analysis is not about predicting the future with certainty. It is about understanding market structure and probabilities.
In this case, the structure suggested that the corrective move had a likely completion area. When price reached that zone, the market responded with the expected reversal.
This is why patience is one of the most important skills in trading.
The Lesson from EURGBP
The EURGBP setup highlights three important trading lessons:
- The market rewards patience
The best entries often come after waiting, not chasing. - A forecast needs a location
Knowing where price may react is more valuable than simply knowing the direction. - Risk management is part of the analysis
A valid setup includes both an opportunity zone and an invalidation level.
The EURGBP Blue Box reaction is a reminder that disciplined trading is about waiting for the market to reach your level — then acting with confidence when the setup appears.
Why EWF ?
At Elliottwave Forecast (EWF), we deliver consistent market updates through regular charts update. Our analysts update 1‑hour charts four times daily and 4‑hour charts once per day across all 78 instruments. In addition, we host five live sessions each day and maintain a 24‑hour chatroom, providing clients with real‑time market guidance and answers to any questions they may have.
You can start a 14‑day trial with us today here and cancel anytime by emailing support@elliottwave-forecast.com
USDJPY Eases from New High, Traders Remain Cautious of Intervention Risk
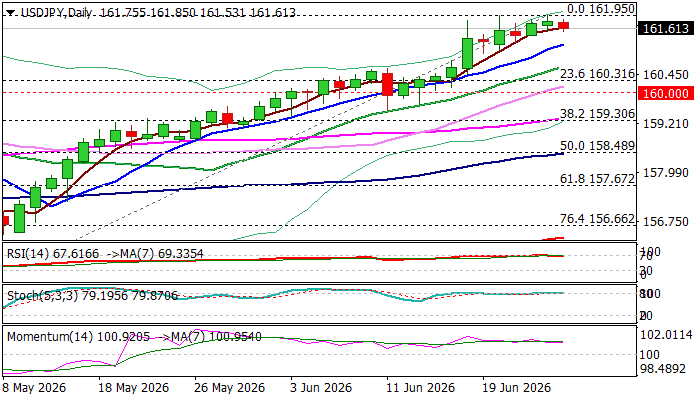
USDJPY was a tad lower on Friday but remains close to new peak at 161.95 (Thursday / 3 July 2025) and in the zone where Japanese authorities may intervene.
Profit-taking at the end of the week and on overbought daily studies was mainly behind today’s easing, which is likely going to be limited, as dollar remains well supported by strong expectations for Fed rate hike, as well as gap in interest rates between the US and other major economies (particularly BoJ rates).
The pair is on track for another weekly gain and second consecutive monthly advance; however, traders remain cautious about looming intervention.
Daily RSI is emerging from overbought territory though overall picture on daily chart remains firmly bullish.
Rising 10DMA (161.21) marks initial support, followed by 20DMA (160.65) and psychological 160 level, which should contain extended dips to keep larger bulls intact.
Res: 161.95; 162.89; 163.57; 164.24
Sup: 161.21; 160.65; 160.31; 160.00
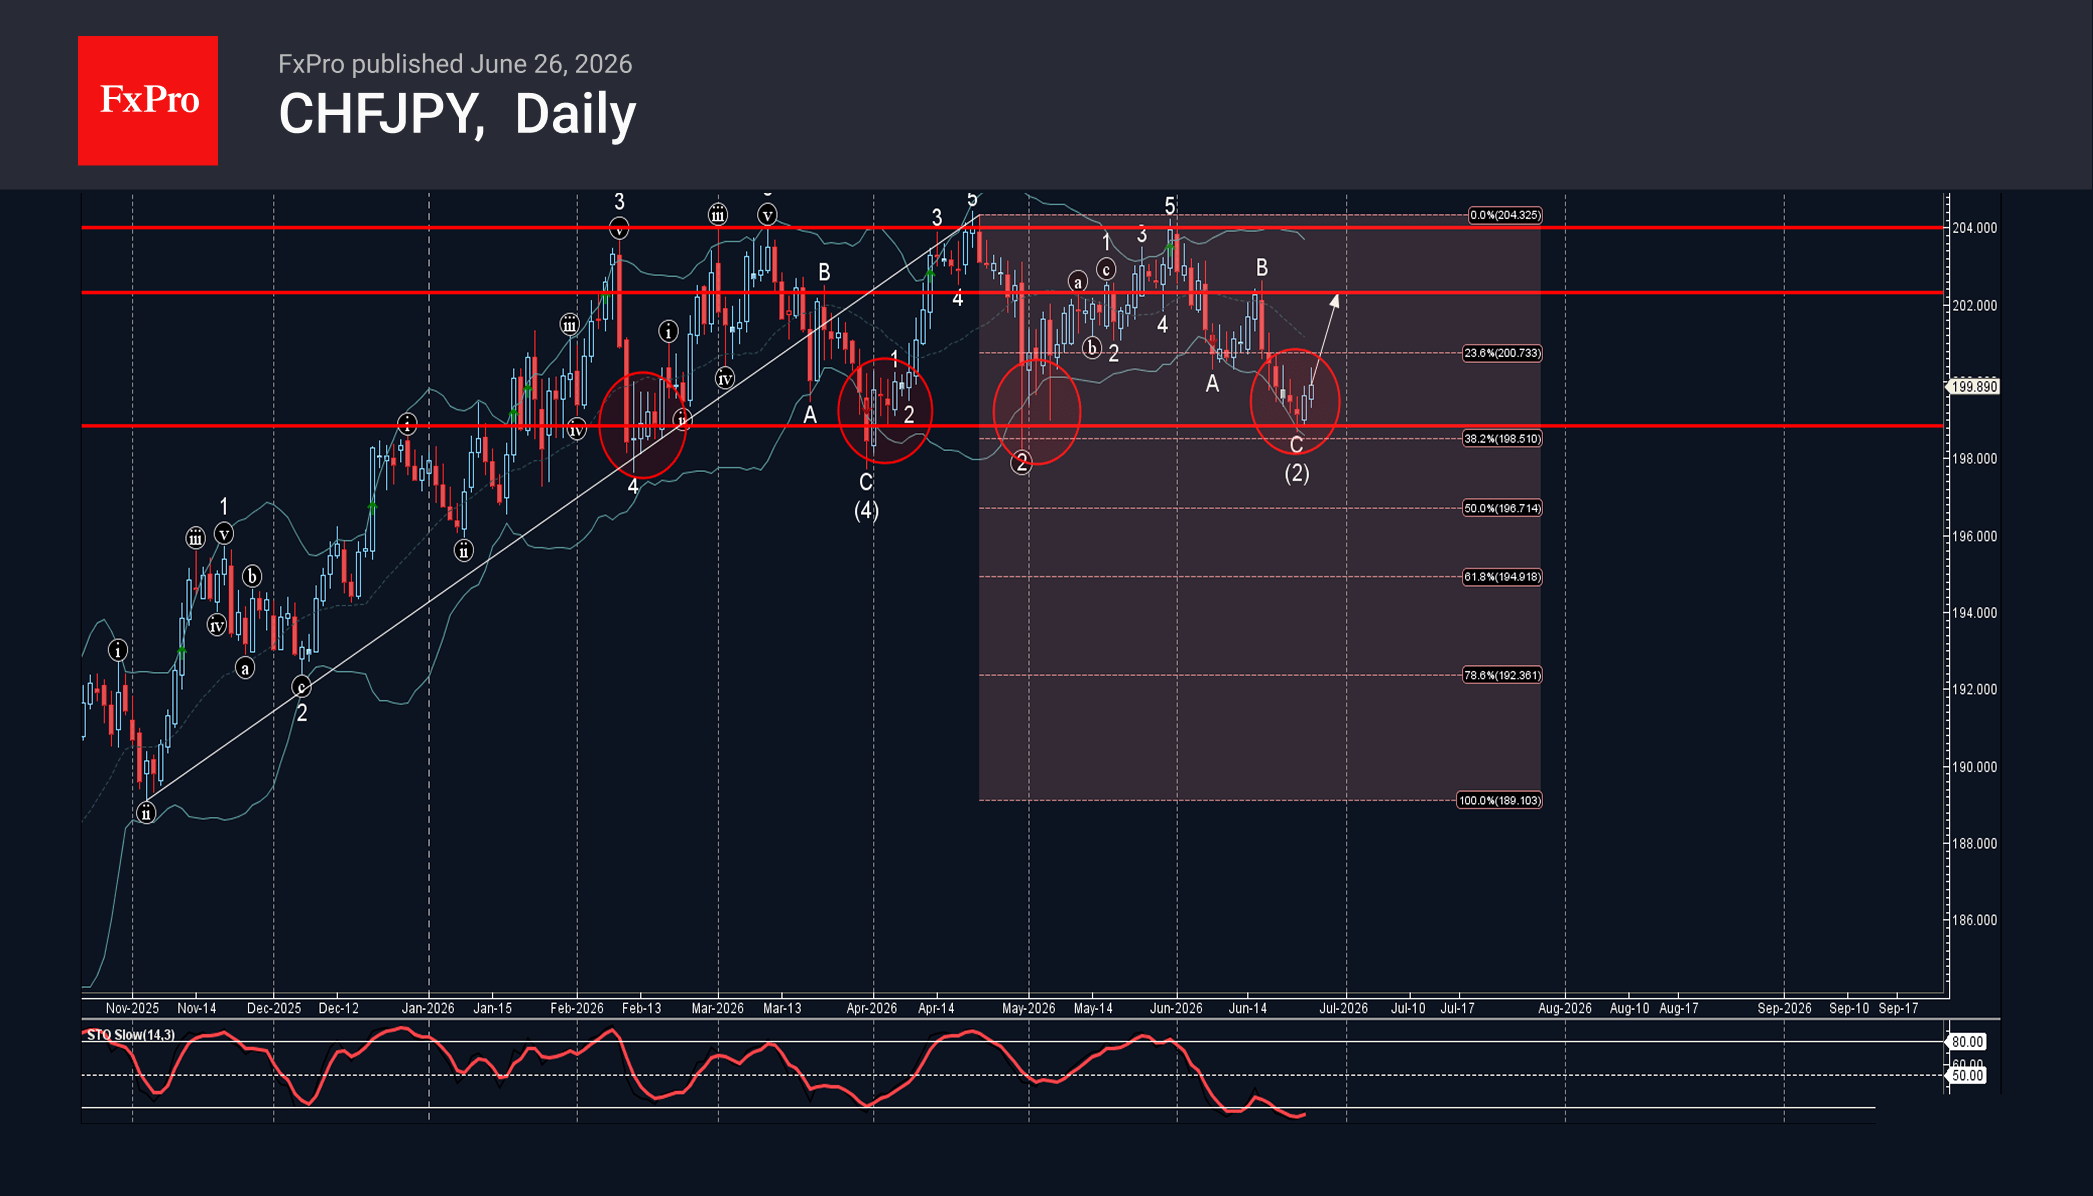
CHFJPY Wave Analysis – 26 June 2026
CHFJPY: ⬆️ Buy
– CHFJPY reversed from support zone
– Likely to rise to resistance level 202.30
CHFJPY currency pair recently reversed up from the support zone between the support level 198.80 (which stopped earlier waves 4,(4), 2) and the lower daily Bollinger Band.
This support zone was also strengthened by the 38.2% Fibonacci correction of the upward impulse from last November.
Given the strong daily uptrend and still oversold daily Stochastic, CHFJPY currency pair can be expected to rise to the next resistance level 202.30, that stopped earlier minor correction B.
Eco Data 6/29/26
| GMT | Ccy | Events | Act | Cons | Prev | Rev |
|---|---|---|---|---|---|---|
| 23:50 | JPY | Retail Trade Y/Y May | 5.30% | 3.10% | 2.10% | 2.80% |
| 08:00 | EUR | Eurozone M3 Money Supply Y/Y May | 3.20% | 2.70% | 2.70% | |
| 08:30 | GBP | M4 Money Supply M/M May | 0.10% | 0.20% | 0.20% | |
| 08:30 | GBP | Mortgage Approvals May | 56K | 63K | 66K | |
| 09:00 | EUR | Eurozone Economic Sentiment Indicator Jun | 95 | 94.3 | 93.5 | 93.7 |
| 09:00 | EUR | Eurozone Industrial Confidence Jun | -7.7 | -7.8 | -8 | -7.9 |
| 09:00 | EUR | Eurozone Services Sentiment Jun | 3.2 | 2.5 | 2.2 | 2.6 |
| 09:00 | EUR | Eurozone Consumer Confidence Jun | -17.7 | -17.7 | -17.7 |
| 23:50 | JPY |
| Retail Trade Y/Y May | |
| Actual | 5.30% |
| Consensus | 3.10% |
| Previous | 2.10% |
| Revised | 2.80% |
| 08:00 | EUR |
| Eurozone M3 Money Supply Y/Y May | |
| Actual | 3.20% |
| Consensus | 2.70% |
| Previous | 2.70% |
| 08:30 | GBP |
| M4 Money Supply M/M May | |
| Actual | 0.10% |
| Consensus | 0.20% |
| Previous | 0.20% |
| 08:30 | GBP |
| Mortgage Approvals May | |
| Actual | 56K |
| Consensus | 63K |
| Previous | 66K |
| 09:00 | EUR |
| Eurozone Economic Sentiment Indicator Jun | |
| Actual | 95 |
| Consensus | 94.3 |
| Previous | 93.5 |
| Revised | 93.7 |
| 09:00 | EUR |
| Eurozone Industrial Confidence Jun | |
| Actual | -7.7 |
| Consensus | -7.8 |
| Previous | -8 |
| Revised | -7.9 |
| 09:00 | EUR |
| Eurozone Services Sentiment Jun | |
| Actual | 3.2 |
| Consensus | 2.5 |
| Previous | 2.2 |
| Revised | 2.6 |
| 09:00 | EUR |
| Eurozone Consumer Confidence Jun | |
| Actual | -17.7 |
| Consensus | -17.7 |
| Previous | -17.7 |
Markets Dial Back Aggressive Fed Bets, Dollar Refuses to Break
The dominant narrative this week was not that the Federal Reserve became less hawkish—it was that markets became less convinced the Fed would need to become even more hawkish. Early in the week, investors aggressively priced in additional rate hikes after the June FOMC meeting, encouraged by a string of increasingly hawkish forecasts from major investment banks. By the end of the week, however, those expectations had cooled as inflation data largely met forecasts and the collapse in oil prices eased concerns over another wave of energy-driven inflation.
The shift was significant. Deutsche Bank's call for two rate hikes this year, followed by Bank of America's even more aggressive forecast for hikes in September, October and December, initially sent the Dollar soaring and pushed Dollar Index through a major long-term Fibonacci resistance. Gold briefly broke below the key $4,000 psychological level as markets positioned for a more forceful Fed response. But May's PCE report failed to deliver the upside inflation surprise needed to justify those extreme scenarios, while the continued plunge in crude oil prices following the US-Iran ceasefire materially improved the near-term inflation outlook. By week's end, markets had largely converged back toward a base case of one Fed hike before year-end.
What stood out most, however, was the Dollar's resilience. Treasury yields retreated, expectations for multiple rate hikes faded, and yet the Greenback held onto almost all of its gains to finish comfortably as the week's strongest major currency. That suggests investors are viewing the Dollar's advance as a broader trend rather than simply a reaction to changing Fed expectations. Attention now turns to next week's US employment report, which could quickly revive speculation of a more aggressive Fed if labor market strength persists. For the week, Dollar topped the currency rankings, followed by Loonie and Sterling, while New Zealand Dollar and Aussie were under the heaviest pressure.
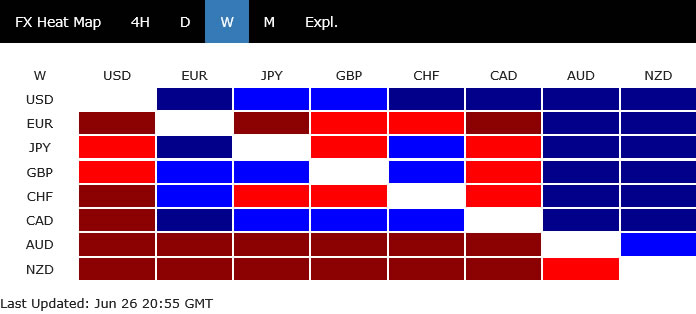
Fed Panic Cools as Oil Collapse Restores Inflation Confidence
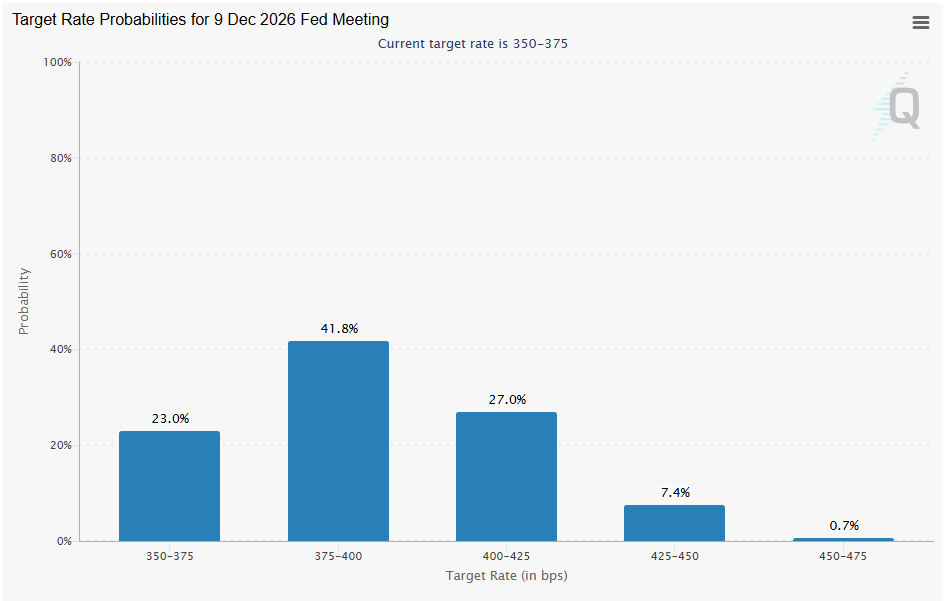
The sharp repricing in Fed expectations this week reflected a market that briefly feared policymakers might have to respond far more aggressively to persistent inflation. Following last week's FOMC meeting, Deutsche Bank forecast two rate hikes this year—in September and December—while Bank of America went even further, calling for increases in September, October and December. Those forecasts amplified concerns that inflation could remain stubbornly high well into 2027, pushing Treasury yields higher and driving Dollar Index through a key long-term Fibonacci resistance.
By the second half of the week, however, that narrative began to lose momentum. May's PCE report confirmed that headline inflation accelerated from 3.8 to 4.1, while core PCE edged up from 3.3 to 3.4. But because both readings matched expectations, investors were left without the upside surprise needed to justify pricing an even more aggressive Fed. The immediate result was an unwinding of some of the week's most extreme tightening bets, with markets shifting back toward a more conventional base case of one rate hike before year-end. Expectations for a September move eased to around 60, while the probability of two hikes this year fell back to roughly one-third.
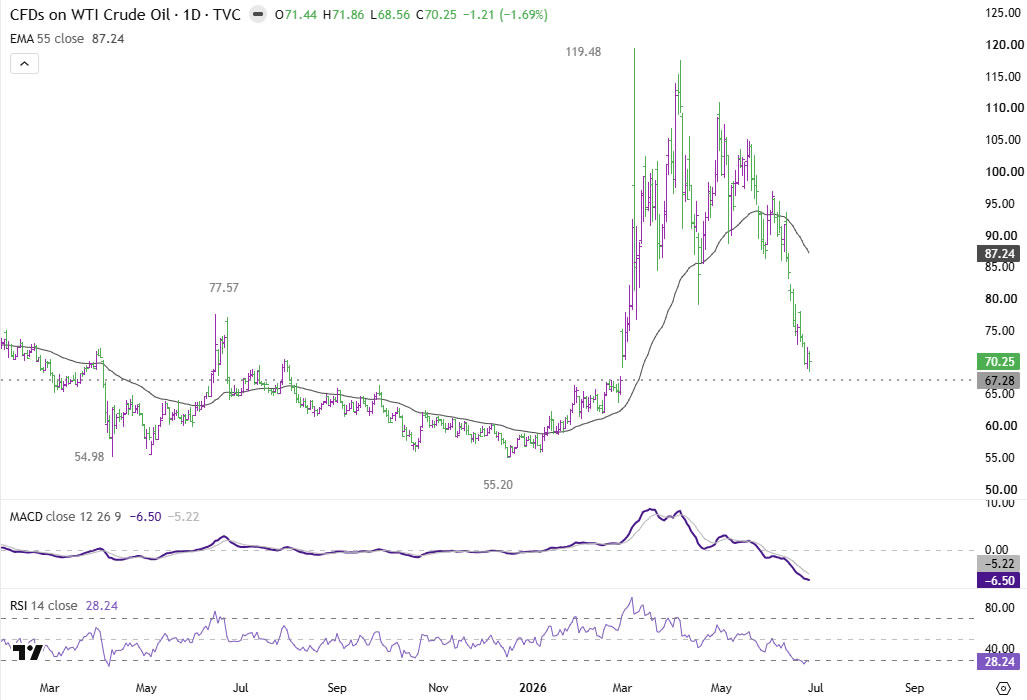
The other major driver was the continued collapse in oil prices. Following the US-Iran ceasefire agreement and the subsequent easing of sanctions, WTI crude extended its decline to finish the week near $70 a barrel, effectively returning to pre-war levels. That dramatically improves the near-term inflation outlook, as lower energy prices are likely to exert meaningful downward pressure on headline CPI and PCE over the next two months. While underlying inflation remains uncomfortably high and the Fed is unlikely to declare victory anytime soon, the retreat in oil prices has given policymakers valuable breathing room. Unless incoming data begin to surprise to the upside again, markets appear comfortable settling around a single Fed hike as the most likely outcome for 2026.
Dollar Rally Slows, But Bullish Momentum Remains Intact
Although the repricing of Fed expectations slowed the Dollar's advance toward the end of the week, it did little to undermine the broader bullish picture. Ordinarily, a retreat in Treasury yields, easing expectations for multiple rate hikes and collapsing oil prices would have prompted a much deeper correction in the Greenback. Instead, Dollar merely consolidated after a powerful rally, suggesting that bullish sentiment remains firmly in place.
That resilience points to a market convinced that the Dollar's recovery is not solely dependent on expectations for more aggressive Fed tightening. Even if the base case has shifted back to one rate hike this year, US interest rates are still expected to remain among the highest in the developed world, while the economy continues to outperform many of its major peers. At the same time, lingering uncertainty surrounding global growth and volatile equity markets continue to underpin demand for the Greenback whenever risk appetite deteriorates.
The focus now shifts to two developments that could determine whether Dollar resumes its advance. First is next week's June non-farm payrolls report. Another stronger-than-expected employment reading would likely revive speculation that the Fed may ultimately need to deliver more than one rate hike this year, reinforcing the recent Dollar breakout. The second is the technology sector. Despite this week's volatility, NASDAQ continues to trade above the 25,000 level, suggesting there has been no broad capitulation. However, a renewed wave of tech liquidation would almost certainly fuel another bout of risk aversion, providing an additional tailwind for the Dollar regardless of whether Fed expectations become more hawkish again.
Dollar Index Breakout Signals Long-Term Trend Reversal
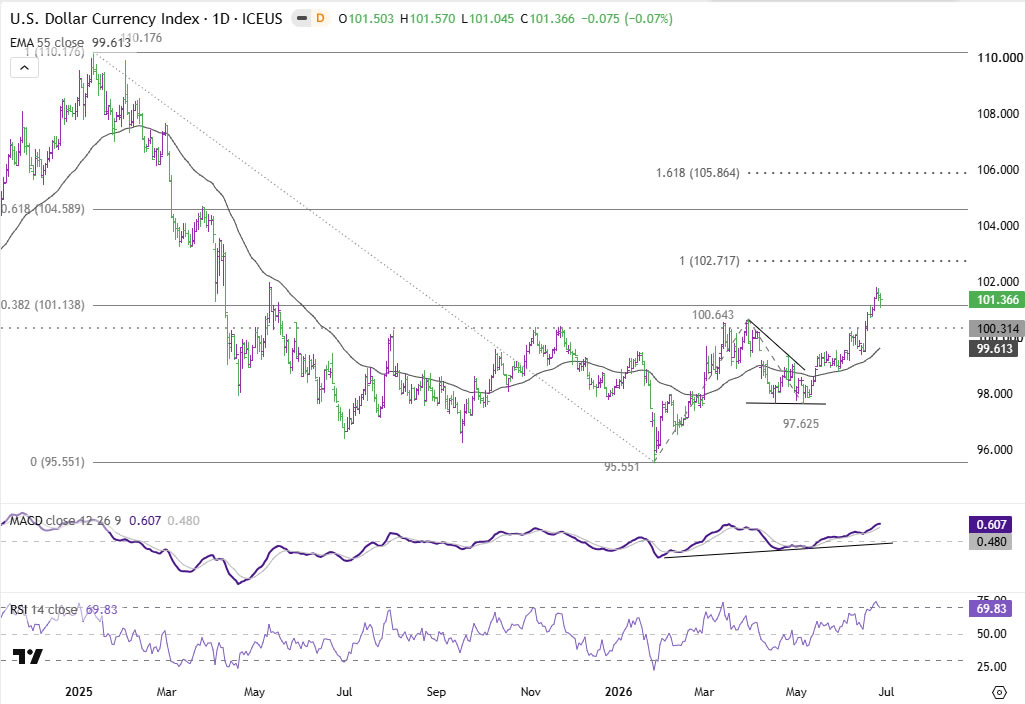
Technically, Dollar Index delivered one of its most important bullish signals in months by breaking decisively above 38.2 retracement of 110.17 to 95.55 at 101.13. The move suggests that the rebound from this year's 95.55 low is no longer merely a corrective bounce, but may already be reversing the broader downtrend that began from the 2025 peak. As long as former resistance at 100.31 now acts as support, the near-term outlook remains firmly tilted to the upside.
The next objective comes in at 100 projection of 95.55 to 100.64 from 97.62 at 102.71. Reaching that level appears achievable if incoming US data continue to support expectations for at least one additional Fed rate hike this year. However, a decisive break above 102.71 would likely require markets to once again price a more aggressive tightening path, such as two rate hikes before year-end. Without that shift in expectations, Dollar Index could instead encounter stronger resistance and enter a period of consolidation after its recent sharp advance.
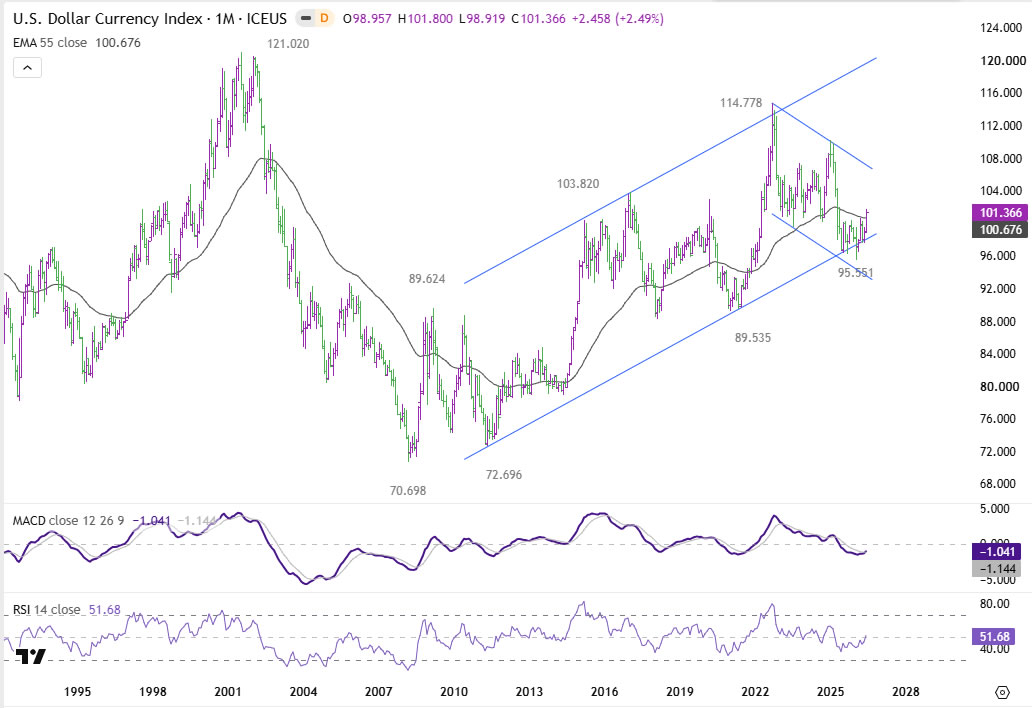
The longer-term charts paint an even more constructive picture for Dollar bulls. On the monthly timeframe, Dollar Index has reclaimed its 55 M EMA (now at 100.67), after finding support at the lower boundary of the rising channel that has guided price action since the 2008 low at 70.69. That combination often marks the beginning of a new medium- to long-term advance rather than simply another countertrend rally. While it is still too early to declare a full secular uptrend has resumed, sustained trading above the 55 M EMA would increasingly support the case for an eventual retest of the 2022 high at 114.77 at least. For now, that remains the longer-term scenario worth monitoring as the Dollar's technical backdrop continues to improve.
Treasury Yields Diverge as Inflation Fears Ease
US Treasury yields ended the week with a split personality. The policy-sensitive 2-year yield retreated from Monday's high above 4.23 to close around 4.09 as markets pared back expectations for multiple Fed rate hikes. Nevertheless, the broader technical picture remains bullish. As long as 4.01 support holds, the rise from this year's 3.36 low is still favored to extend toward 100 projection of 3.36 to 4.02 from 3.67 at 4.34. Even so, bearish divergence on the daily MACD suggests upside momentum is beginning to fade, raising the prospect of a period of range trading after hitting 4.34. rather than another sustained surge.
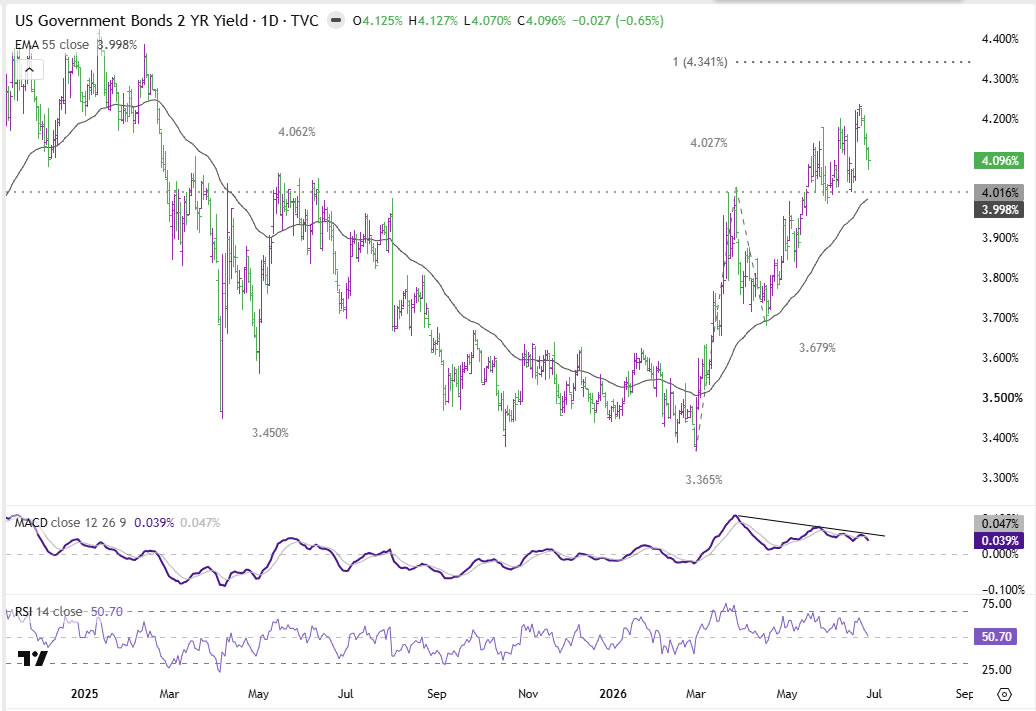
For Dollar bulls, the implication is straightforward. Dollar Index and the 2-year yield have been moving broadly in tandem throughout the recent rally, reflecting shifting expectations for Federal Reserve policy. Both have now reached important technical milestones. Extending the Dollar's breakout above 102.71 and lifting the 2-year yield toward or beyond 4.34 would probably require markets to move back toward pricing more than one Fed rate hike before year-end. Without that catalyst, both assets may spend time consolidating recent gains.
The 10-year yield tells a different story. Its break below the 38.2 retracement of 3.96 to 4.69 at 4.41 suggests the advance from 3.96 has already completed at 4.69. Deeper decline toward 61.8 retracement at 4.24 is now favored while 4.51 caps. Unlike the decline in the 2-year yield, which reflects less aggressive Fed pricing, the fall in the 10-year yield appears to be driven primarily by improving inflation expectations as oil prices return to pre-conflict levels.
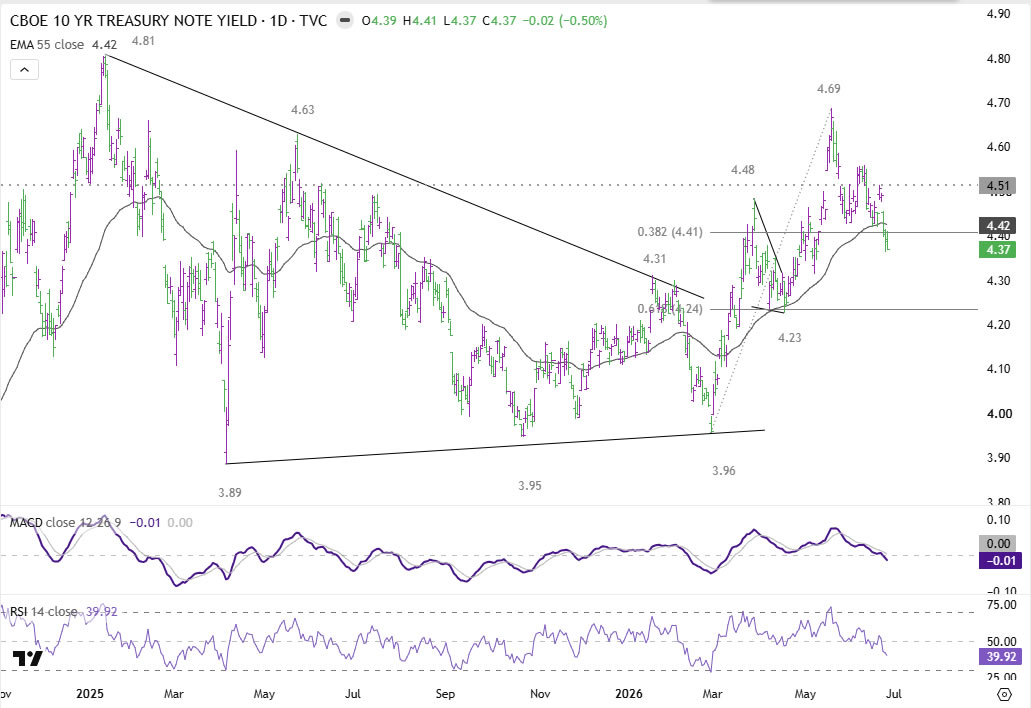
Equally important, equities have remained relatively resilient despite lower long-term yields, indicating that investors are not rushing into Treasuries for safety. Instead, the bond market is pricing a scenario in which inflation gradually cools while the Fed retains sufficient credibility to keep longer-term price expectations anchored—a backdrop that may temper, but not necessarily reverse, the Dollar's broader uptrend.
NASDAQ Holds Key Support, Leaving Dollar With One More Headwind
NASDAQ endured another volatile week as investors continued to reassess lofty AI-related valuations and the prospect of higher US interest rates. Despite the sharp swings, however, the technical damage remains limited. The index is still holding comfortably above 38.2% retracement of 20,690 to 27,190 at 24,707, suggesting that the price action from the record high is, for now, best viewed as a correction within the broader uptrend rather than the start of a larger reversal.
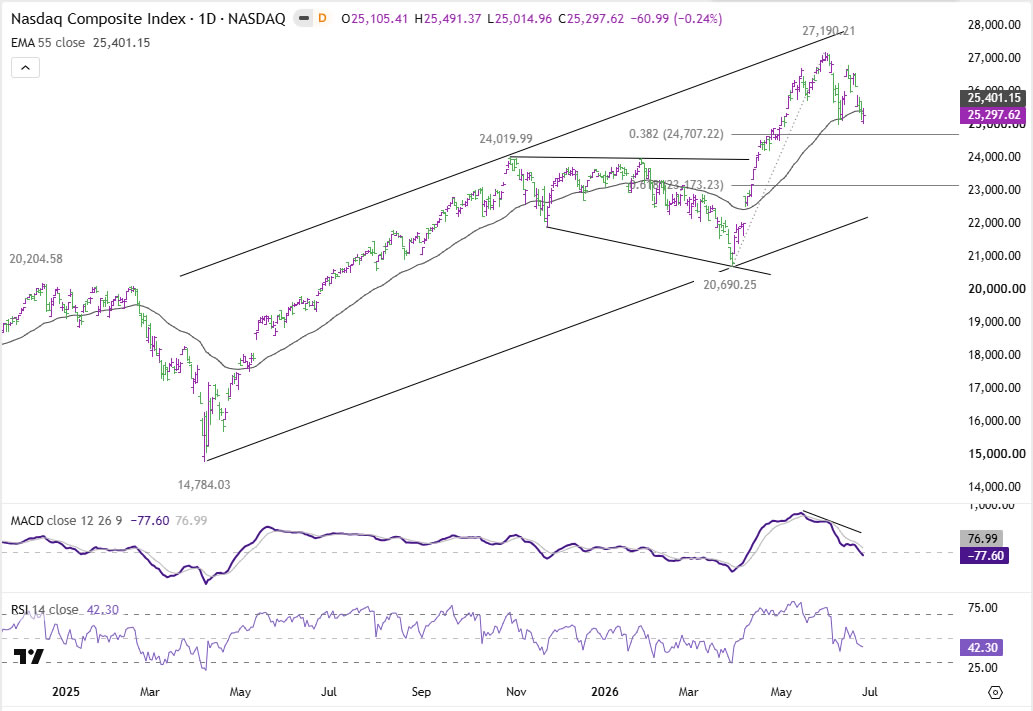
The price structure also hints that the correction could be entering its later stages. If the pullback from 27,190 completes as a three-wave consolidation above 24,707, NASDAQ would be well positioned to resume its long-term advance and eventually break to fresh record highs. Such a recovery would likely encourage investors to rotate back into growth assets, reducing demand for the Dollar as a defensive holding while easing concerns that tighter Fed policy will significantly derail corporate earnings.
The bullish scenario, however, depends on 24,707 holding firm. A decisive break below that support would suggest the entire advance from 20,690 is reversing rather than merely consolidating, exposing 61.8% retracement at 23,173 and potentially even deeper losses. That would almost certainly reignite broad risk aversion, providing fresh support for the Dollar regardless of whether Fed expectations become more hawkish. In that sense, NASDAQ may prove just as important as next week's US non-farm payrolls report in determining whether the Dollar resumes its rally or extends the current consolidation into July.
Looking Ahead: July Holds the Key
Markets have stepped back from the aggressive Fed scenarios that briefly dominated sentiment earlier in the week. With May's PCE inflation report delivering no upside surprise and oil prices collapsing back to pre-war levels, investors have largely converged on a base case of one Fed rate hike before year-end. Yet the Dollar's ability to retain almost all of its gains despite that repricing sends an important message: the Greenback's recovery is being supported by a broader improvement in both macro fundamentals and technical momentum, rather than simply by ever-more hawkish Fed expectations.
The focus now shifts to July, where the next phase of the Dollar's rally—or consolidation—will likely be determined. A stronger-than-expected June non-farm payrolls report could quickly revive speculation that the Fed will need to tighten more aggressively, while renewed weakness in technology stocks would provide an additional boost through the risk-aversion channel. On the other hand, softer labor market data and a stabilization in equities could keep Dollar Index consolidating after its recent breakout. Even so, with Dollar Index holding above a major long-term Fibonacci resistance, Treasury yields remaining elevated by historical standards, and the broader technical picture continuing to improve, the path of least resistance still appears to favor further Dollar strength into the second half of the year.
USD/CAD Weekly Outlook
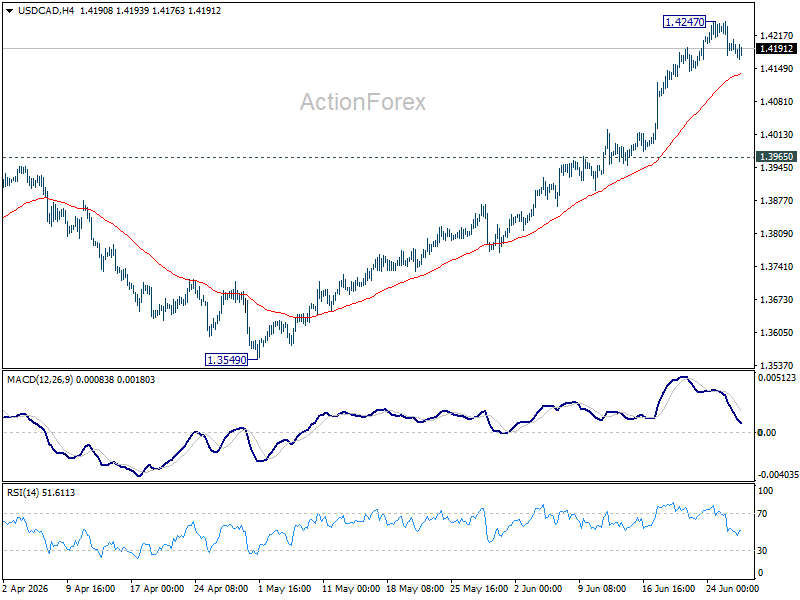
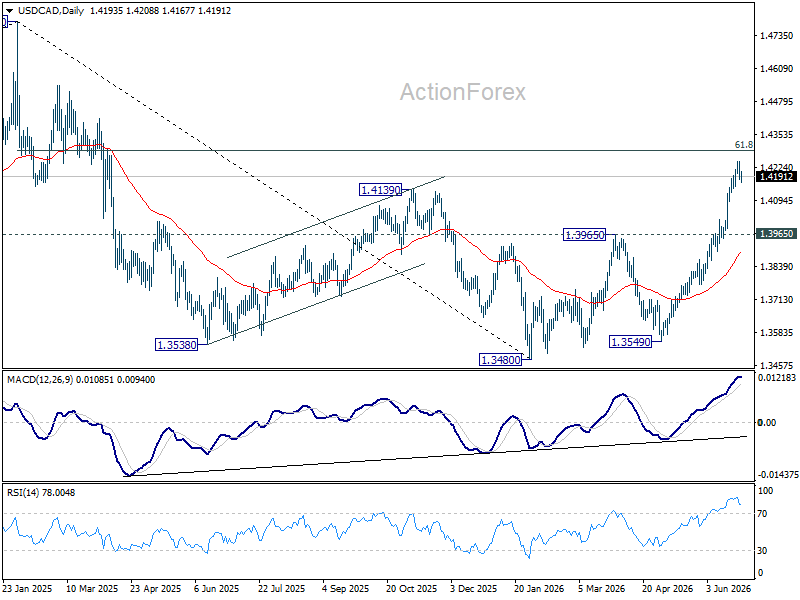
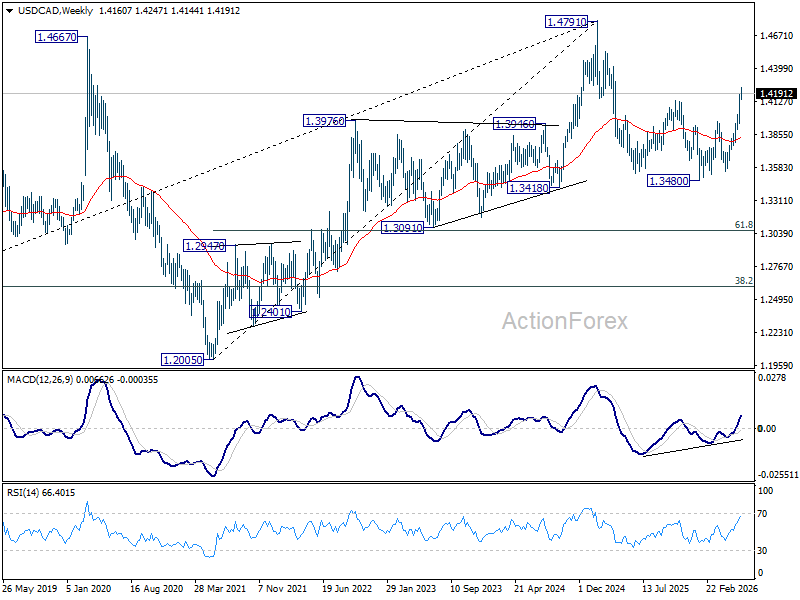
USD/CAD rose further to 1.4247 last week but retreated mildly since then. Initial bias remains neutral this week for consolidations. While deeper pullback cannot be ruled out, downside should be contained above 1.3965 resistance turned support. Above 1.4247 will resume the rally from 1.3480 to 61.8% retracement of 1.4791 to 1.3480 at 1.4290. Firm break there will pave the way back to 1.4791 high.
In the bigger picture, current development suggests that fall from 1.4791 has completed as a three wave correction to 1.3480. It's still early to judge if rise from there a corrective bounce, or resumption of the larger up trend from 1.2005 (2021 low). But in either case, retest of 1.4791 high should be seen next.
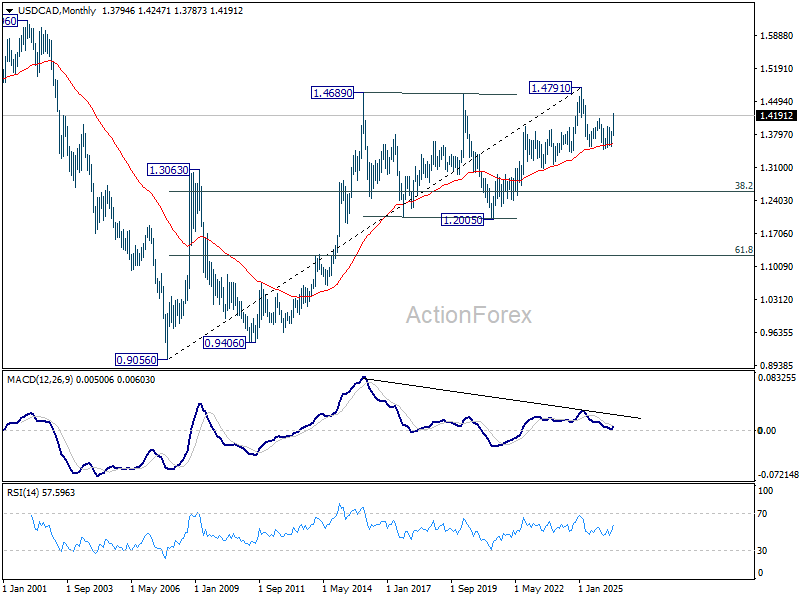
In the long term picture, rising 55 M EMA (now at 1.3588) remains intact. Thus, up trend from 0.9056 (2007 low) could still be in progress. However, considering bearish divergence condition M MACD, sustained trading below 55 M EMA will argue that the up trend has completed with five waves up to 1.4791, and turn medium term outlook bearish for correction to 38.2% retracement of 0.9056 to 1.4791 at 1.2600.
EUR/USD Weekly Outlook
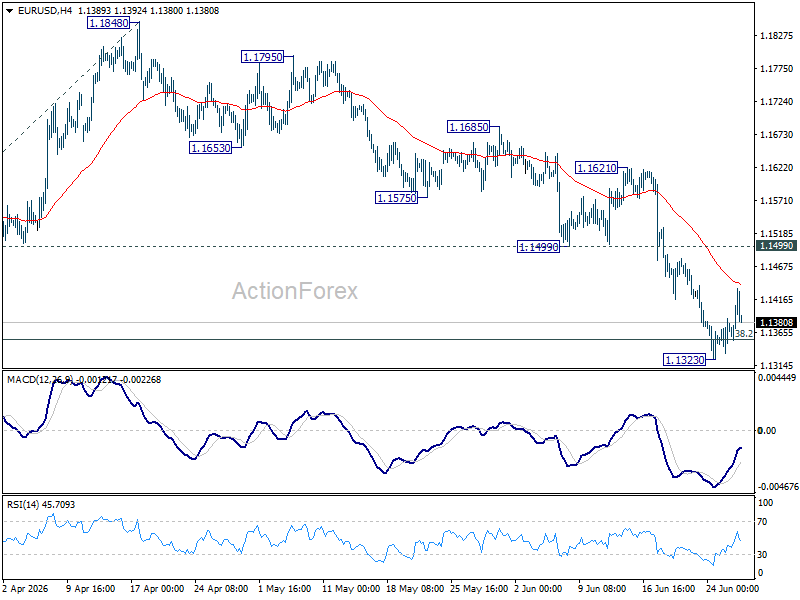
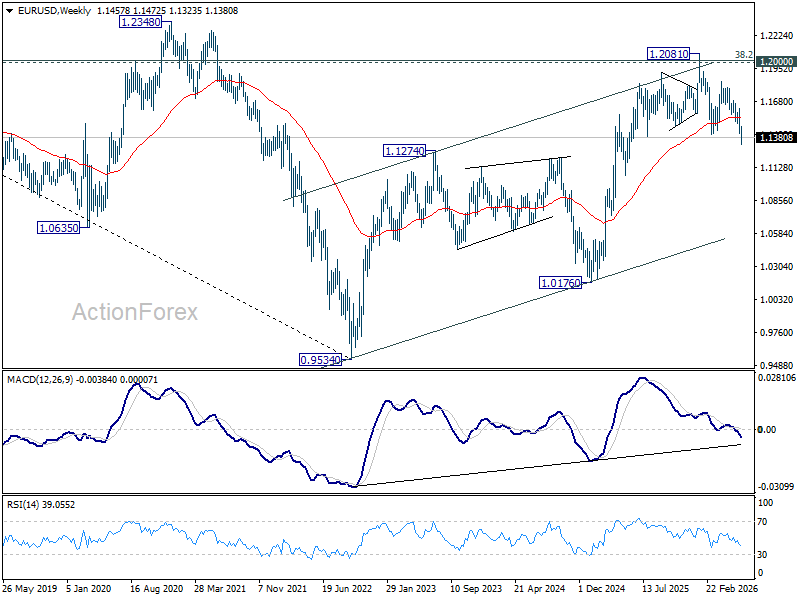
EUR/USD fell further to 1.1323 last week but recovered after breaching 1.1353 fibonacci level briefly. Initial bias remains neutral this week for consolidations. Further fall is expected as long as 1.1499 support turned resistance holds. Break of 1.1323 will resume the fall from 1.2081 to 100% projection of 1.2081 to 1.1408 from 1.1848 at 1.1175.
In the bigger picture, focus is back on 38.2% retracement of 1.0176 to 1.2081 at 1.1353. Decisive break there will revive the case of medium term bearish trend reversal after rejection by 1.2 key cluster resistance level. Further fall should be seen to 61.8% retracement at 1.0904. Nevertheless, strong rebound from 1.1353, followed by break of 1.1621 resistance, will retain medium term bullishness.
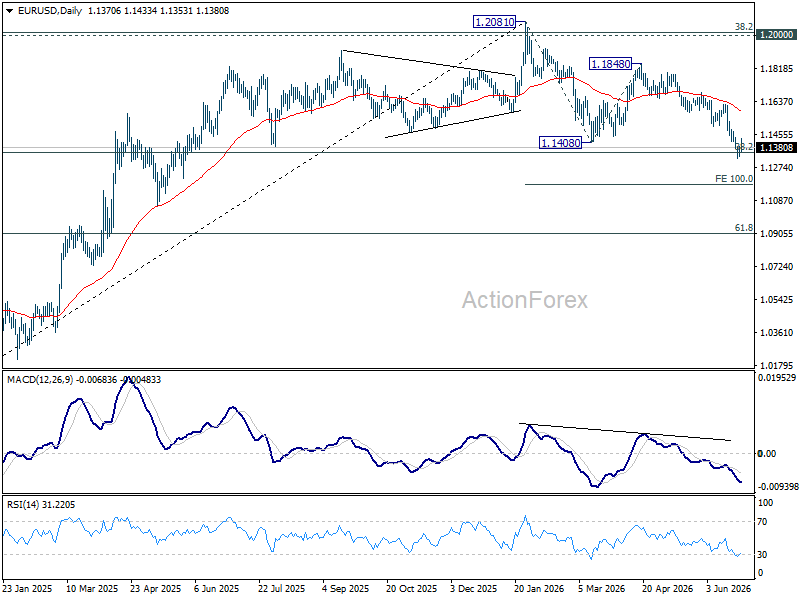
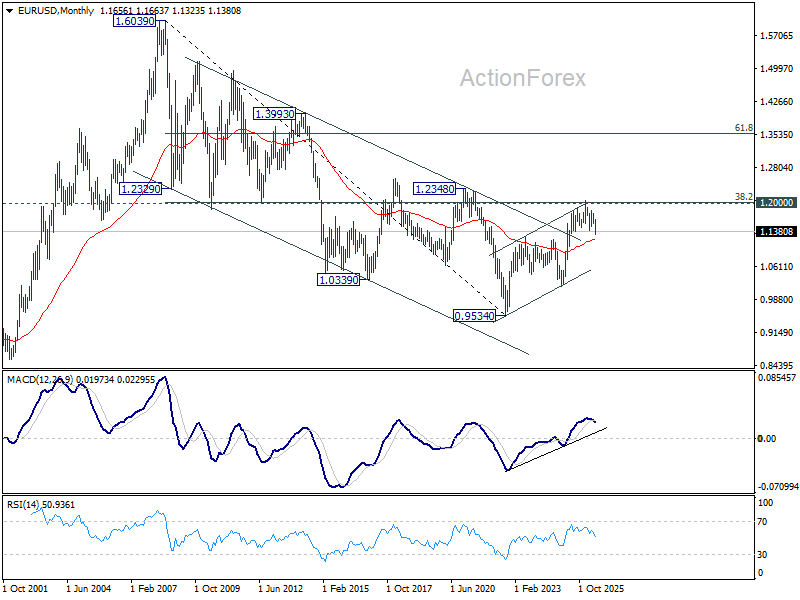
In the long term picture, 38.2% retracement of 1.6039 to 0.9534 at 1.2019, which is close to 1.2000 psychological level is the key for the outlook. Rejection by this level will keep the multi decade down trend from 1.6039 (2008 high) intact, and keep outlook neutral at best. However, decisive break of 1.2000/19, will suggest long term bullish trend reversal, and target 61.8% retracement at 1.3554.
USD/JPY Weekly Outlook
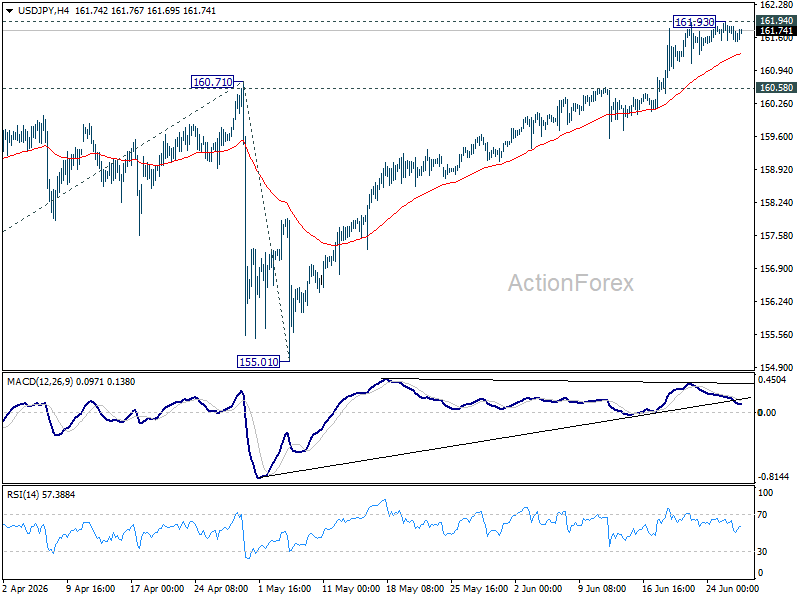
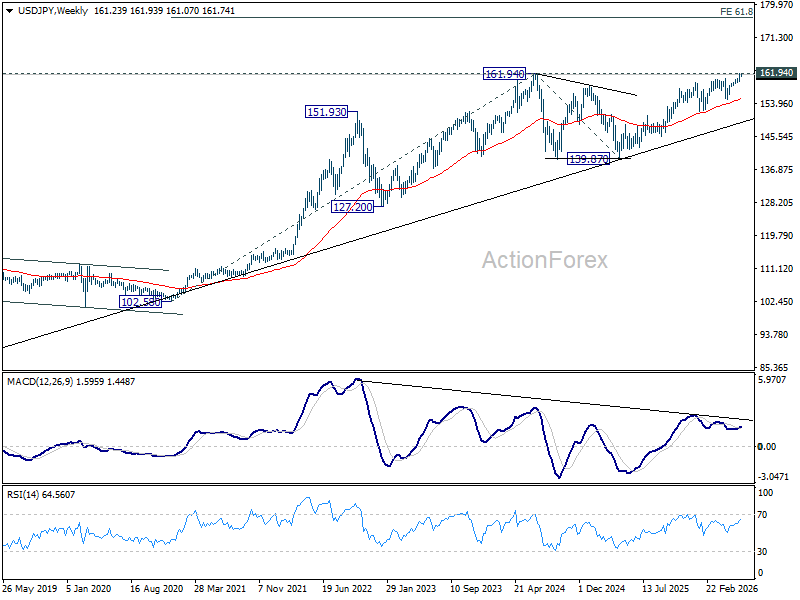
USD/JPY edged high last week but failed to break through 161.94 key resistance. Initial bias remains neutral this week first. On the downside, firm break of 160.58 support should confirm short term topping, on bearish divergence condition in 4H MACD. Deeper fall should then be seen to 55 D EMA (now at 159.63) and below. Nevertheless, decisive break of 161.94 high will resume the larger up trend to 100% projection of 152.25 to 160.71 from 155.01 at 163.47 next.
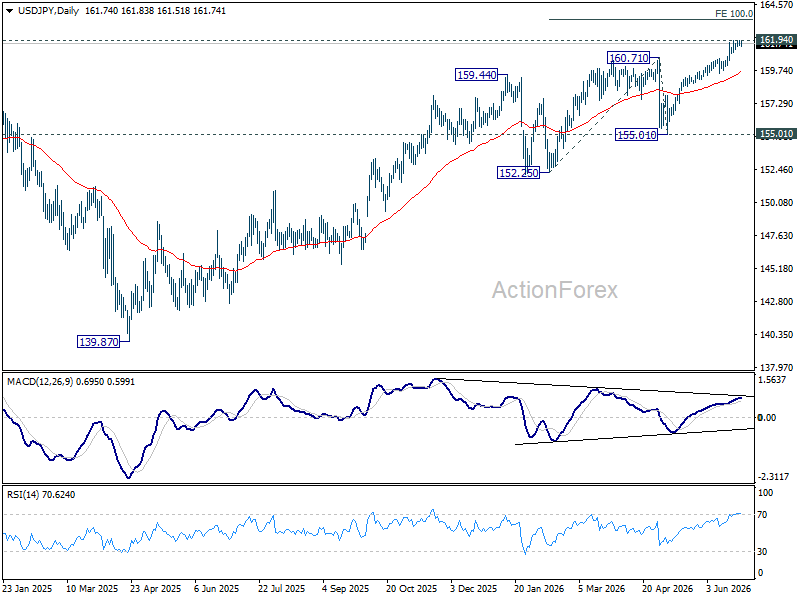
In the bigger picture, for now, corrective pattern from 161.94 (2024 high) is still seen as completed at 139.87. Rise from there is seen as resuming the long term up trend. This will remain the favored case as long as 55 W EMA (now at 155.17) holds.
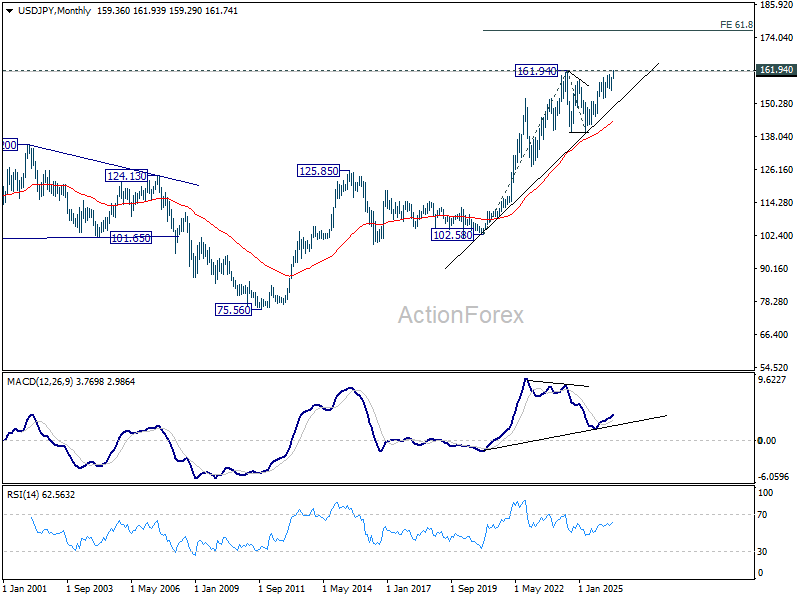
In the long term picture, up trend from 75.56 (2011 low) is still in progress and might be ready to resume. Firm break of 161.94 will target 61.8% projection of 102.58 (2020 low) to 161.94 (2024 high) from 139.87 at 176.55 in the medium term. Long term outlook will stay bullish as long as 139.87 support holds, even in case of deep pullback.
GBP/USD Weekly Outlook
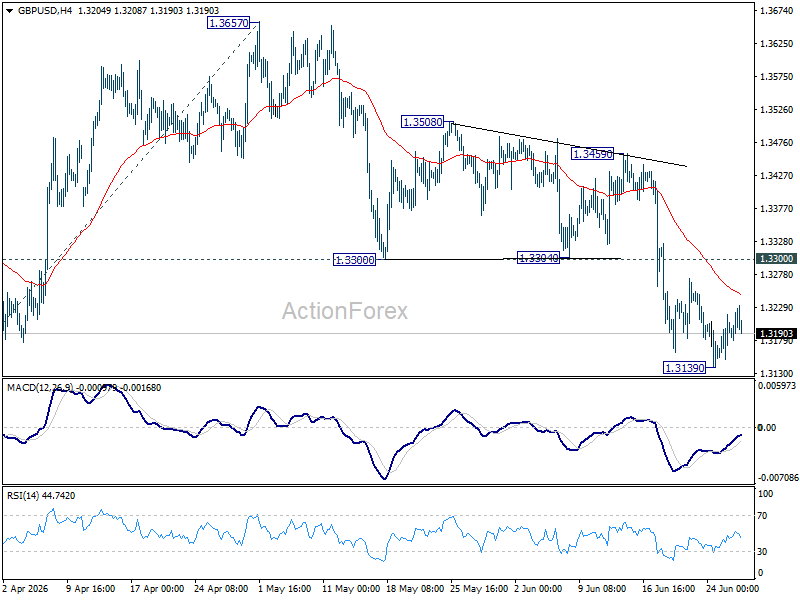
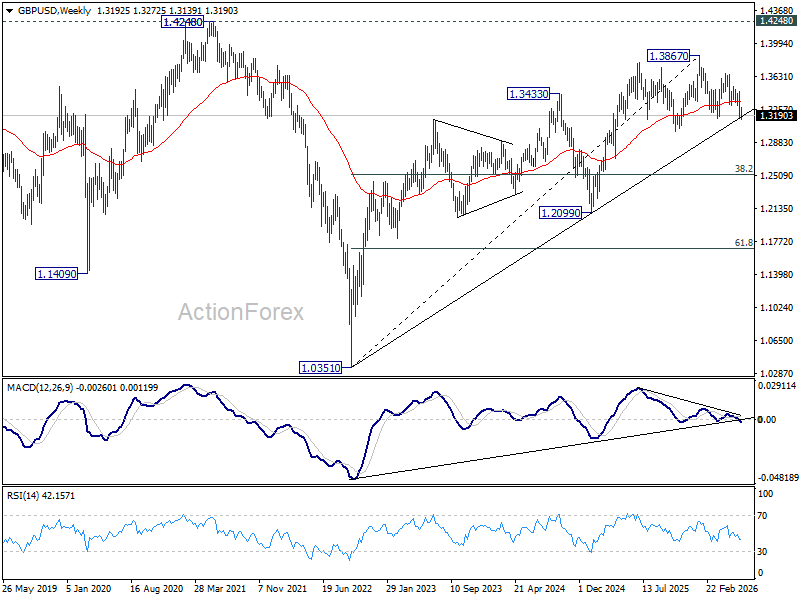
GBP/USD's break of 1.3158 support suggests that fall from 1.3867 is resuming. But as a temporary low was formed at 1.3139, initial bias is neutral this week for some consolidations first. Upside should be limited by 1.3300 support turned resistance. Below 1.3139 will target 100% projection of 1.3867 to 1.3158 from 1.3657 at 1.2948.
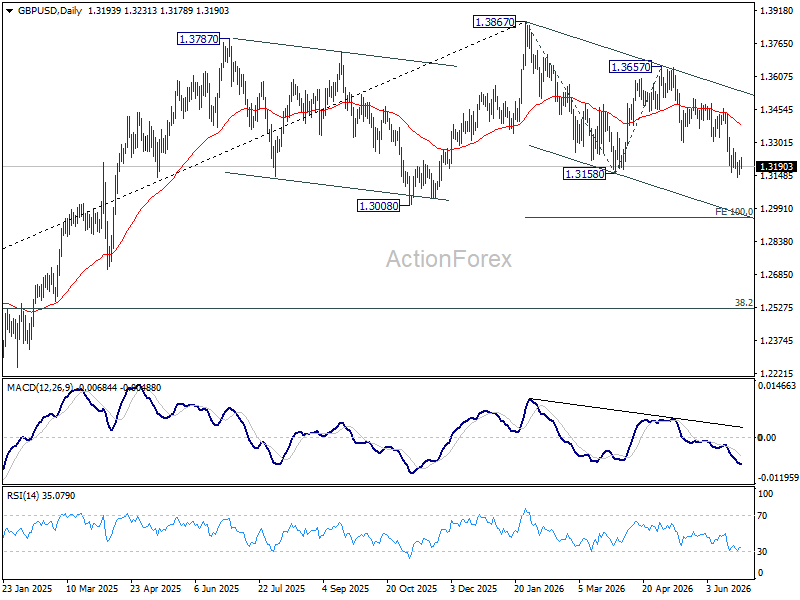
In the bigger picture, price actions from 1.3867 are a corrective pattern within the broader up trend from 1.0351 (2022 low). With 1.3008 support intact, medium term bullishness is maintained and break of 1.3867 is in favor for a later stage, towards 1.4248 key resistance (2021 high). However, firm break of 1.3008 will at least bring deeper fall to 38.2% retracement of 1.0351 to 1.3867 at 1.2524, with increased risk of bearish reversal.
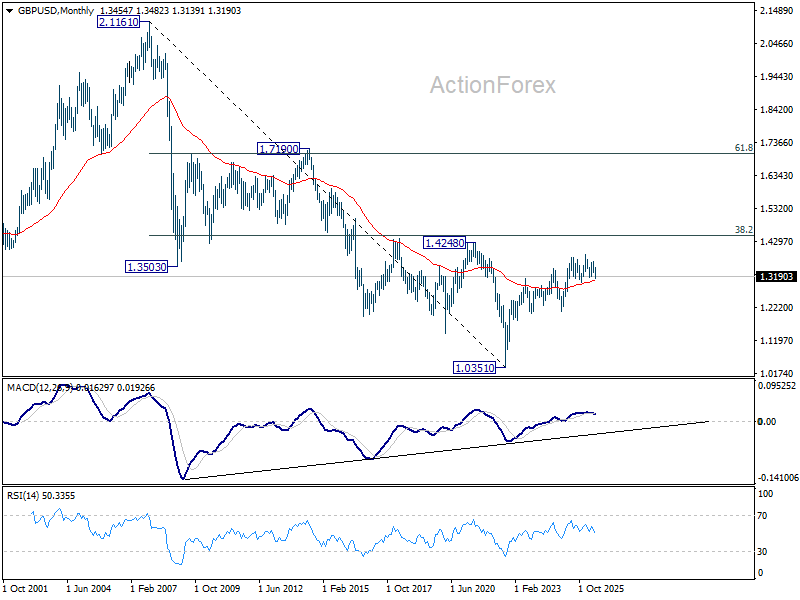
In the long term picture, as long as 1.4248/4480 resistance zone holds (38.2% retracement of 2.1161 to 1.0351 at 1.4480), the long term outlook will remain bearish. That is, price actions from 1.0351 are seen as a corrective pattern to down trend from 2.1161 (2007 high) only. Nevertheless, decisive break of 1.4248/4480 will be a strong sign of long term bullish reversal.
USD/CHF Weekly Outlook
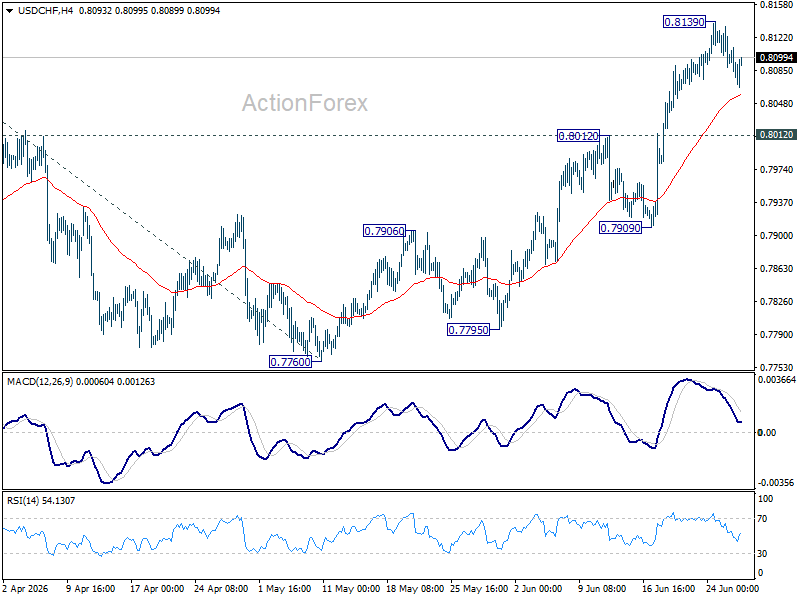
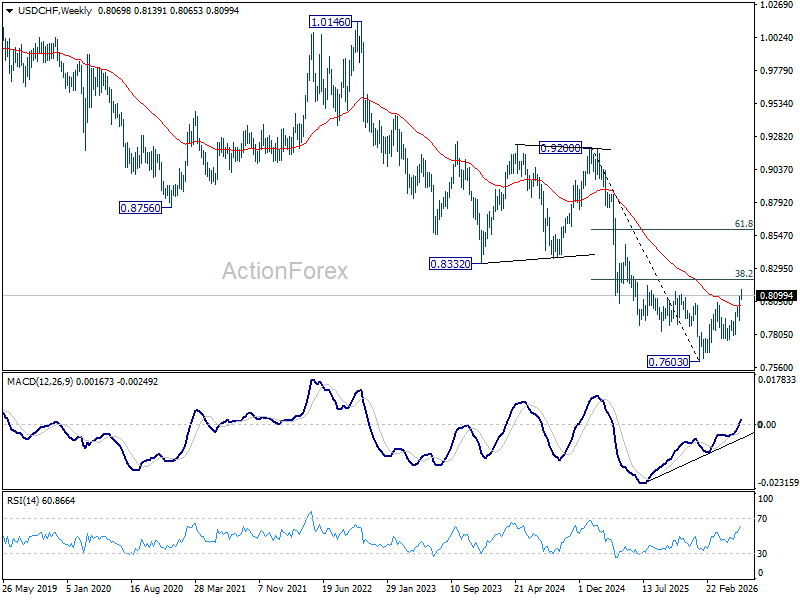
USD/CHF rose further to 0.8139 last week but retreated since then. Initial bias remains neutral this week for some consolidations. Downside should be contained by 0.8012 resistance turned support to bring another rally. Above 0.8139 will target 100% projection 0.7603 to 0.8041 from 0.7600 at 0.8198 next.
In the bigger picture, while a medium term bottom was formed at 0.7603, it's still early to call for bullish trend reversal. As long as 38.2% retracement of 0.9200 (2025 high) to 0.7603 at 0.8213 holds, the larger down trend could still continue through 0.7603 at a later stage. However, firm break of 0.7603 will argue that the trend has reversed and turn focus to 0.8332 support turned resistance (2023 low) for confirmation.
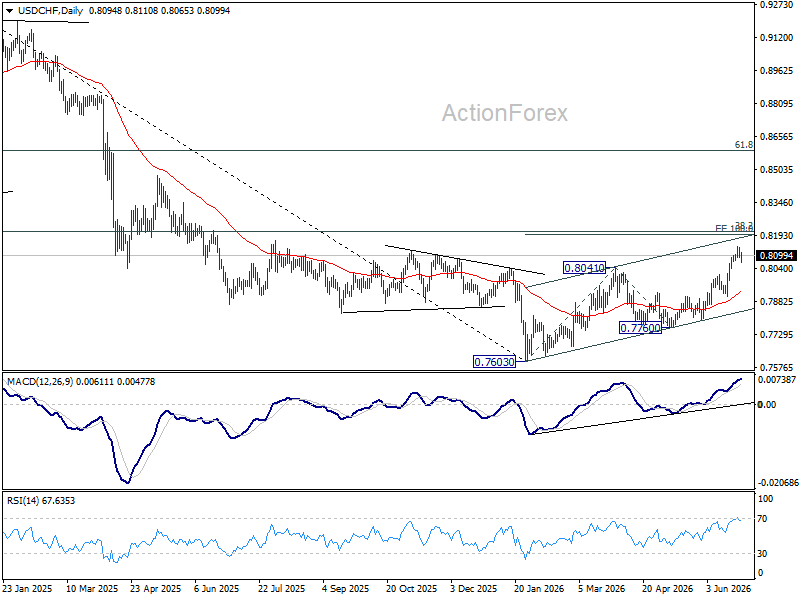
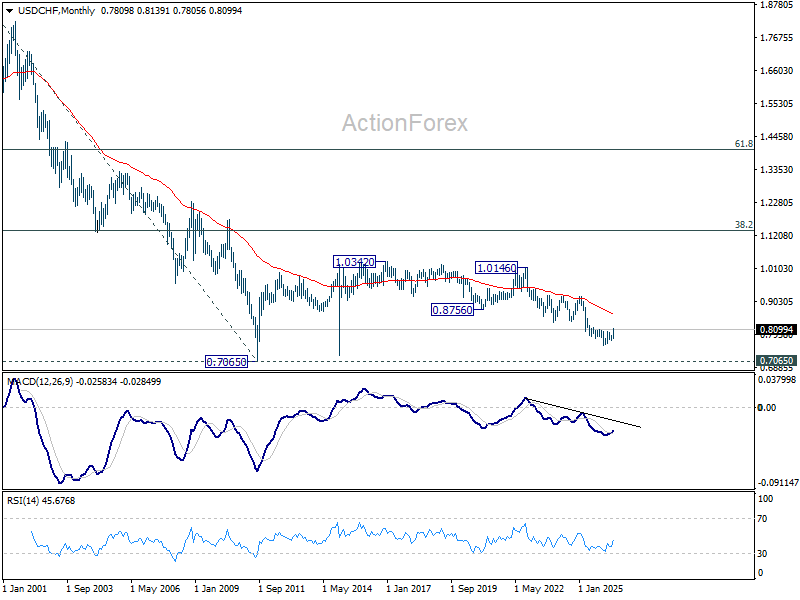
In the long term picture, price action from 0.7065 (2011 low) are seen as a corrective pattern to the multi-decade down trend from 1.8305 (2000 high). It's uncertain if the fall from 1.0342 is the second leg of the pattern, or resumption of the downtrend. But in either case, outlook will stay bearish as long as 0.8756 support turned resistance holds (2021 low). Retest of 0.7065 should be seen next.
AUD/USD Weekly Report
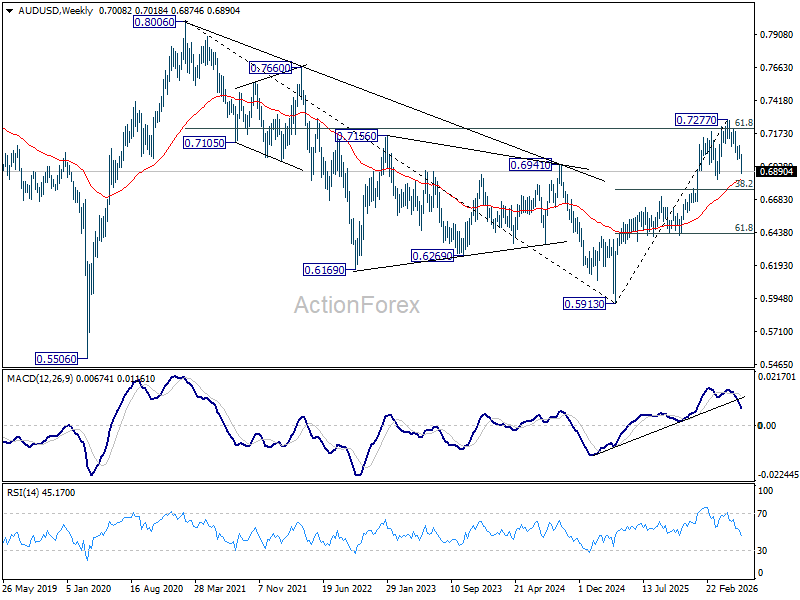
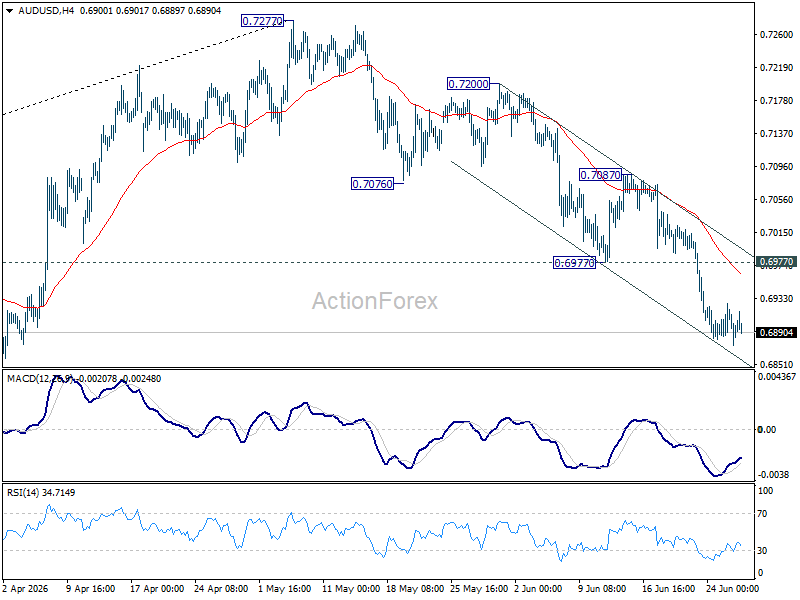
AUD/USD's fall from 0.7277 continued last week. There is no clear sign of bottoming yet despite loss of momentum as seen in 4H MACD. Further decline is expected as long as 0.6977 support turned resistance holds. Retest of 0.6832 support should be seen next. Firm break there will target 0.6756 fibonacci level.
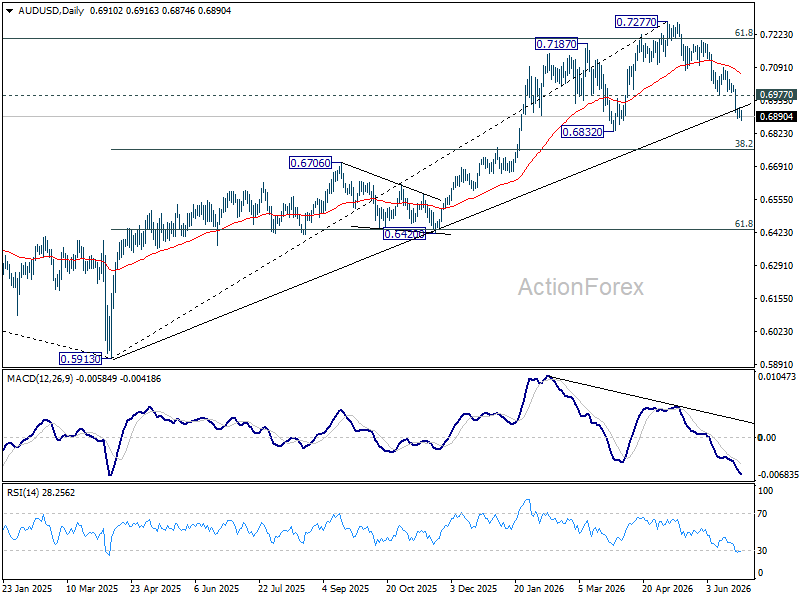
In the bigger picture, considering bearish divergence condition in D MACD, a medium term top could be formed at 0.7277 after failing to sustain above 61.8% retracement of 0.8006 (2021 high) to 0.5913 (2024 low) at 0.7206. Deeper fall could be seen to 38.2% retracement of 0.5913 to 0.7277 at 0.6756 as a correction. But strong support should be seen there to bring rebound. Consolidations would continue below 0.7277 for a while.
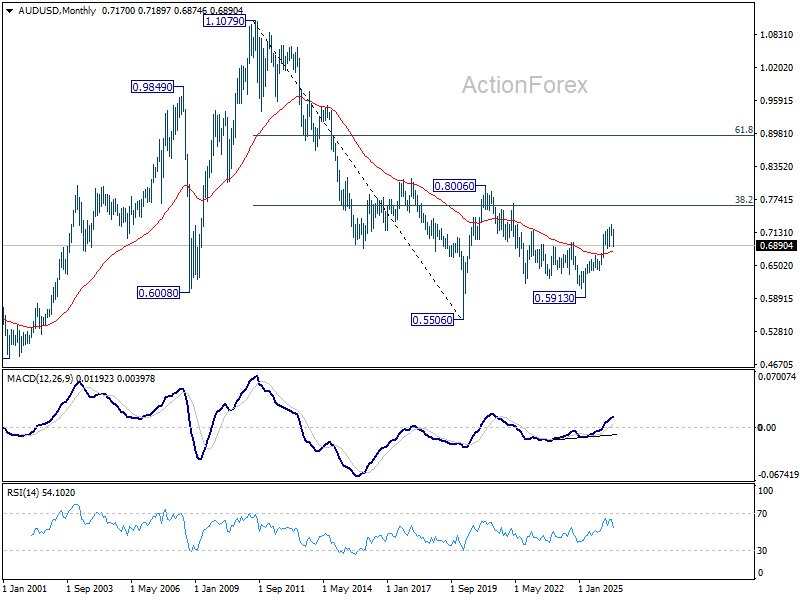
In the long term picture, rise from 0.5913 is seen as the third leg of the whole pattern from 0.5506 (2020 low). It's still early to judge if this is an impulsive or corrective pattern. But in either case, further rise should be seen back to 0.8006 and possibly above. This will remain the favored case as long as 55 W EMA (now at 0.6828) holds.