Sample Category Title
US Inflation Will Put Everything into Perspective
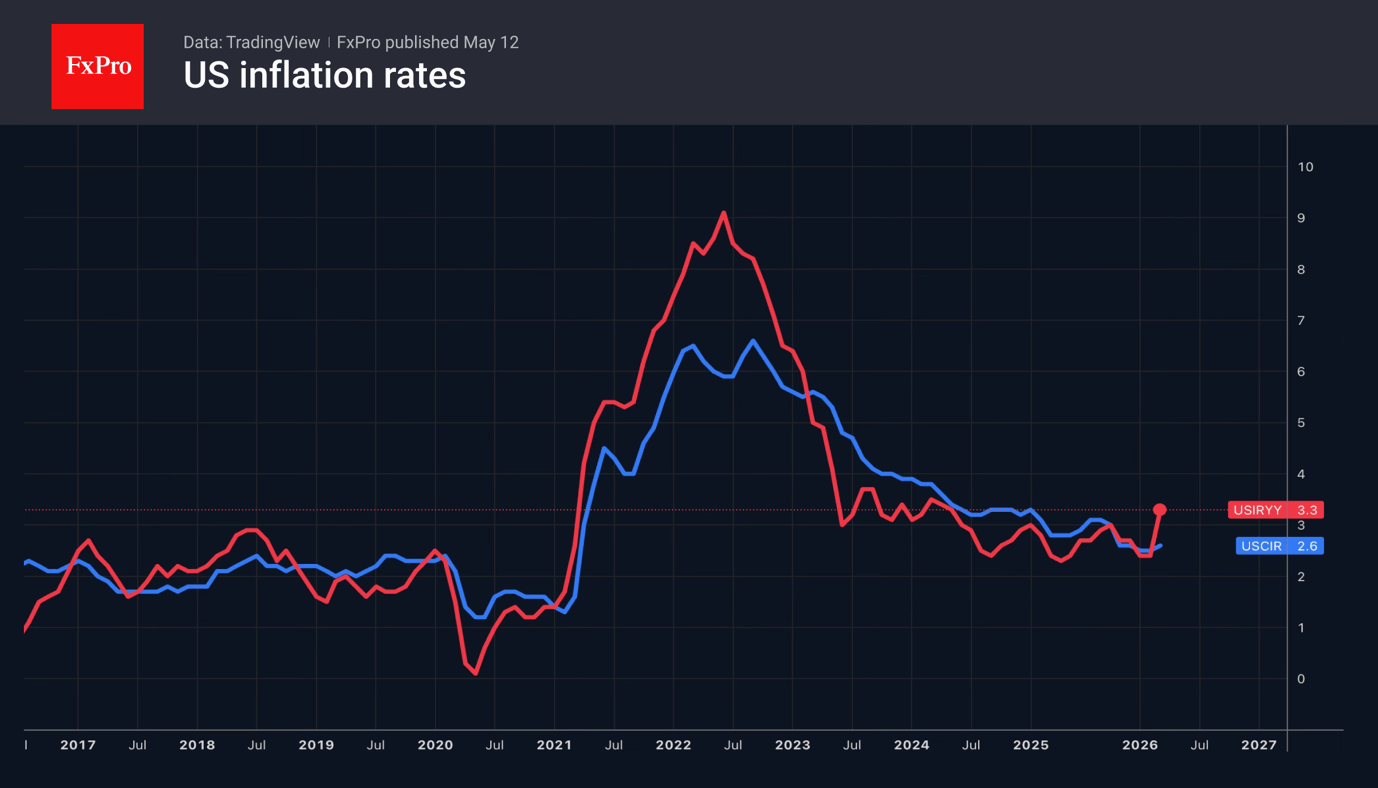
- An acceleration in the US CPI will support the US dollar.
- Currency interventions have provided temporary relief for the yen.
The US dollar has been stuck within a 0.4% range over the past week, amid a stalemate in the Middle East. NACHO or ‘Not a chance Hormuz Opens’ has replaced TACO. Investors are coming to terms with the idea that the blockade of the main oil artery is here to stay. Under such conditions, the chances of a rise in Brent and a strengthening of the USD are increasing, especially as the latter is fuelling expectations of a new batch of US inflation data.
Growing expectations of a key rate hike are supporting the euro. Economists surveyed by Bloomberg expect two rate hikes this year, from 2% to 2.5%, compared to just one in the previous similar survey. Economists expect inflation in the eurozone to accelerate to 2.9% by the end of the year.
CME derivatives suggest the federal funds rate will remain unchanged in 2026 and rise to 4% with a 50-50 probability by April 2027. The timing of monetary policy tightening could be brought forward if inflation accelerates in April, which could put pressure on EURUSD.
According to Bank of America, the data does not justify the Fed resuming its cycle of monetary easing this year. Core inflation is too high, and the strong April jobs report has put an end to the idea of rate cuts. The bank has pushed back its forecast for monetary policy easing from September 2026 to July 2027.
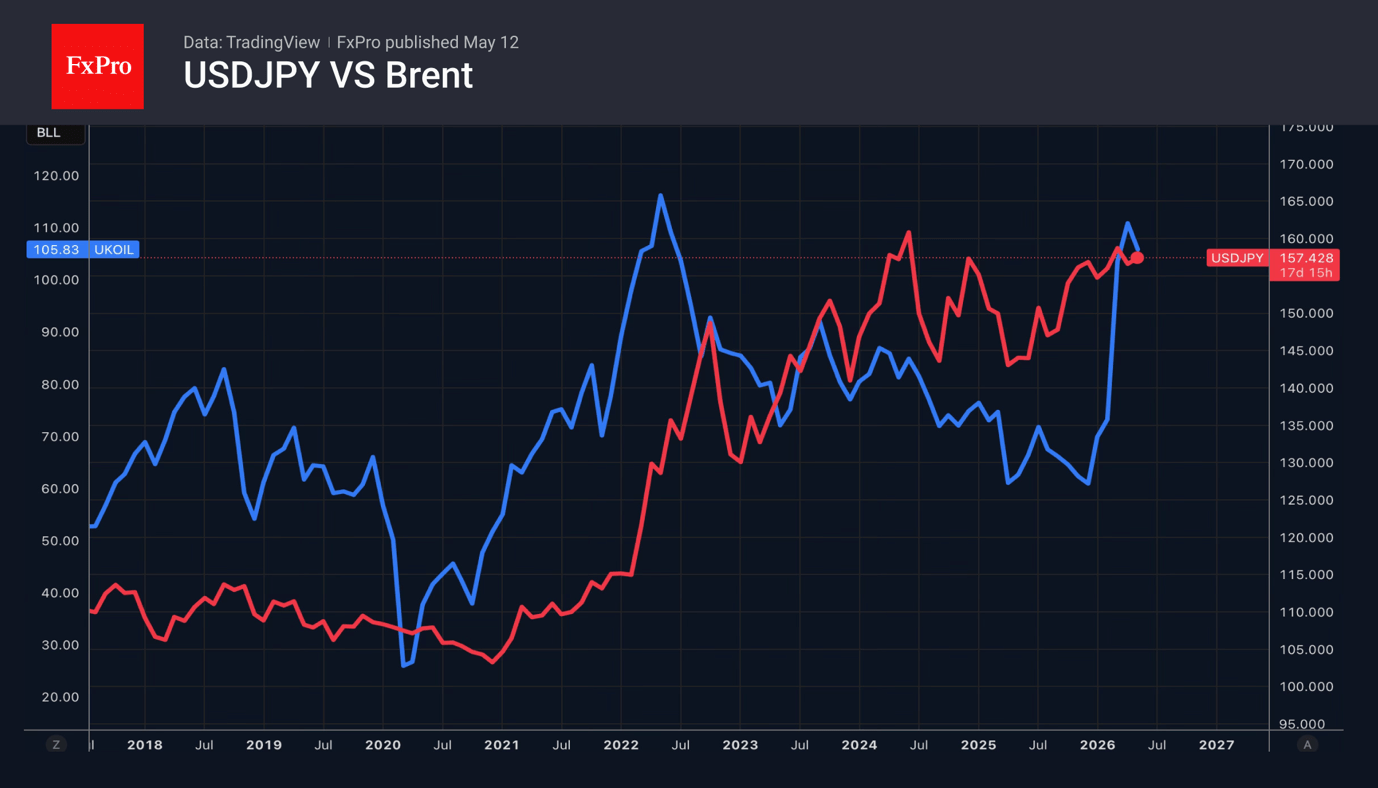
Meanwhile, the USDJPY bulls are regaining their footing. The scale of currency interventions is estimated at ¥8.65–10.08 trillion, comparable to the ¥9.74 trillion recorded in 2024. These interventions have led to a reduction in speculative yen shorts to monthly lows. Nevertheless, given the upward trend in Brent and strong demand for the US dollar as a safe-haven currency, Japan’s funds may not be sufficient to deter hedge funds and asset managers.
The minutes of the latest Governing Board meeting may have supported the yen. One of its members stated that an overnight rate hike could be on the cards, even if the situation in the Middle East remains unclear. The futures market is pricing in a 72% probability of monetary tightening in June. However, the Bank of Japan has repeatedly pushed back the timing of expected monetary tightening, and the wide interest rate differential favours USDJPY.
Bitcoin Hits the Pause Button at $80k
Market Overview
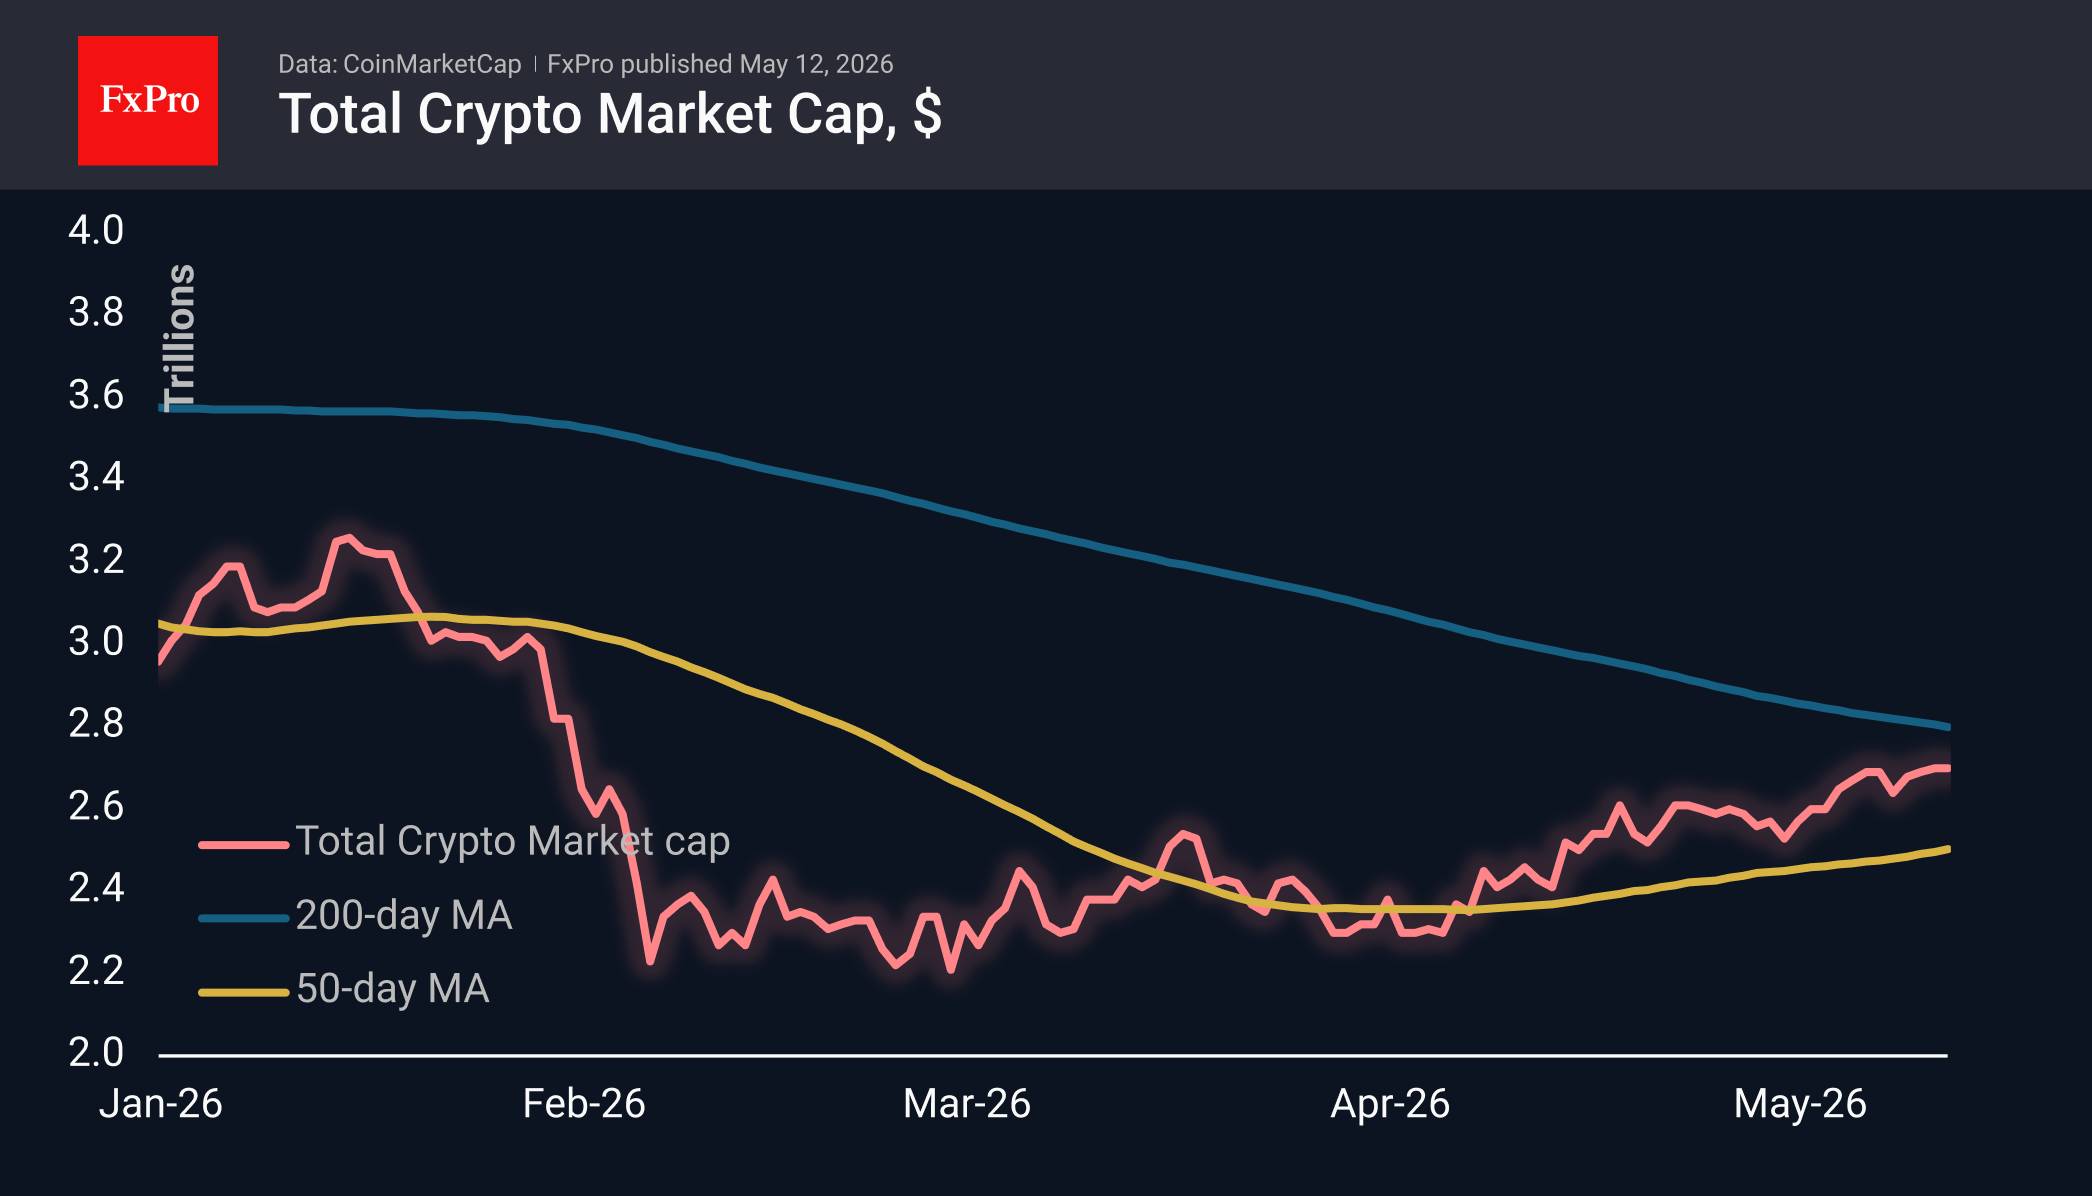
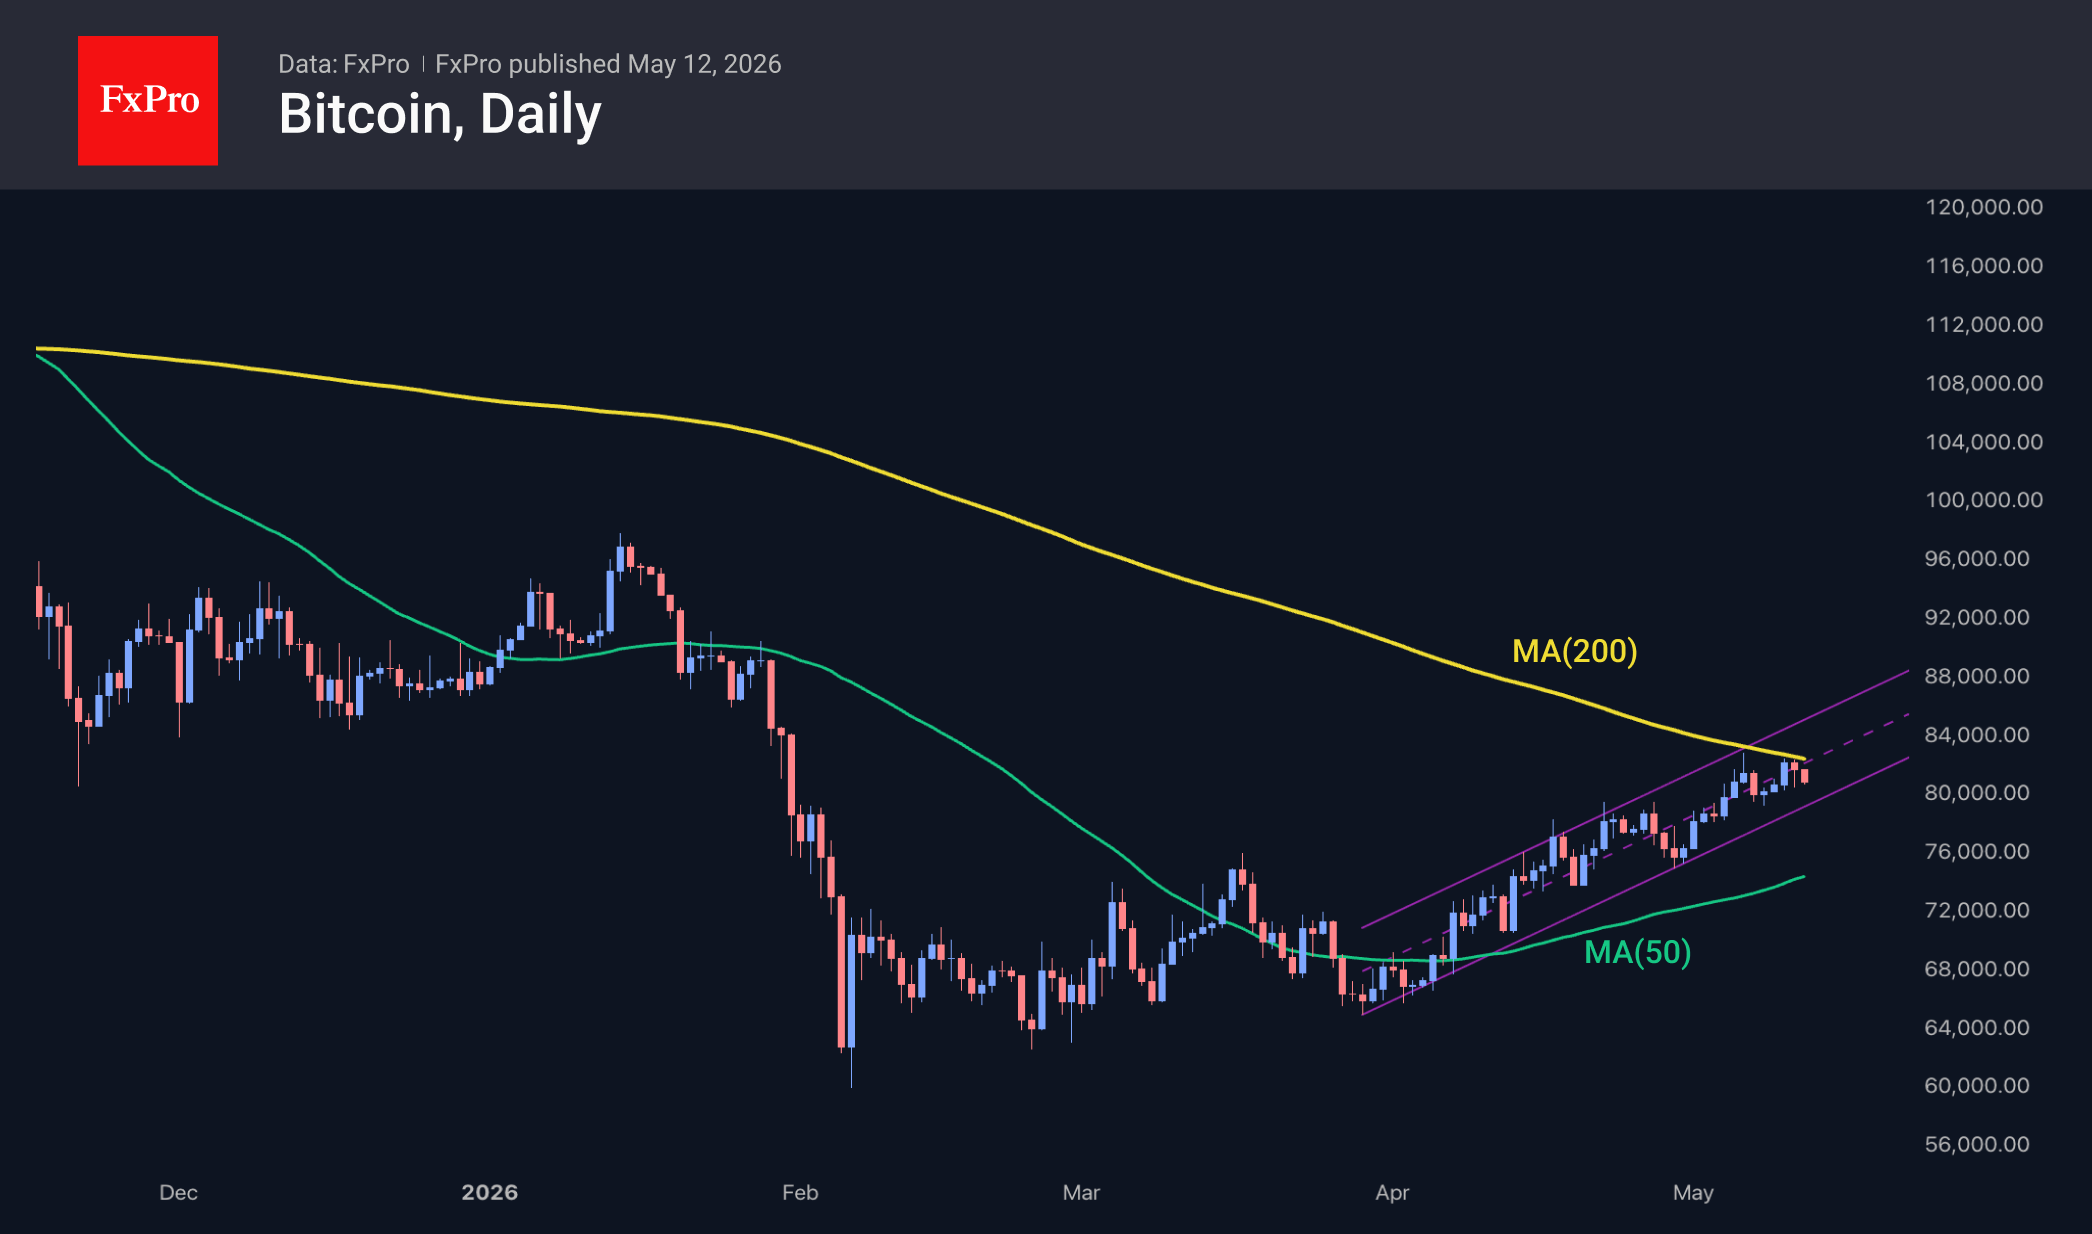
The crypto market capitalisation has stalled at around $2.70 trillion, reflecting Bitcoin’s indecision around $80,000. At the same time, risk aversion is mounting in global markets, which can be easily linked to profit-taking following the rally and the US dollar’s upward momentum. Among the top coins, the leaders over the past day were Theta (+8.5%), Toncoin (+4.9%) and NEAR Protocol (+2.1%). The underperformers were Dash (-4.2%), Official Trump (-3.5%) and Zcash (-3.5%).
The sentiment index has settled just below the midpoint of the range, recording readings of 47, 48 and 49 over the last three days. At the same time, we continue to note how difficult it is for the crypto market to consolidate at the upper end of the spectrum, which indicates a predominance of bears.
Bitcoin points to much the same thing, having lost its upward momentum as it approached the 200-day moving average. Although this line is trending downwards, the market has failed to break through it for the past six days. On the other hand, as the decline is quite modest, it resembles nothing more than a breather following a rally, leaving a strong chance of growth resuming.
News Background
According to CoinShares, global investments in crypto funds rose by $858 million last week. Investments in Bitcoin increased by $706 million, in Ethereum by $77 million, in Solana by $48 million, and in XRP by $40 million. Outflows from Bitcoin short positions totalling $14 million marked the largest of the year.
Investments rose amid a compromise on stablecoin yields under the CLARITY Act. The Senate Banking Committee is expected to consider the bill next week, CoinShares notes.
Strategy acquired 535 BTC for $43 million last week — at an average price of $80,340 per coin. The week before, the company skipped its weekly BTC purchase ahead of its quarterly report. Strategy now holds 818,869 BTC, purchased for $61.86 billion at an average price of $75,540 per Bitcoin.
Strategy will continue to build up its reserves of the leading cryptocurrency. At the same time, the volume of purchases will significantly exceed any potential sales, stated the company’s founder, Michael Saylor. According to him, it is important to remain a ‘net buyer’ and end each year with more coins than at the start.
Jordi Visser, founder of 22V Research, has increased his investment in Ethereum. In his view, this year will see the start of mass asset tokenisation, which will form the basis for payments by AI agents. For autonomous transactions, they will need digital assets such as Ethereum or stablecoins.
German ZEW Sentiment Rises to -10.2, But Economy Still Burdened by Energy Shock
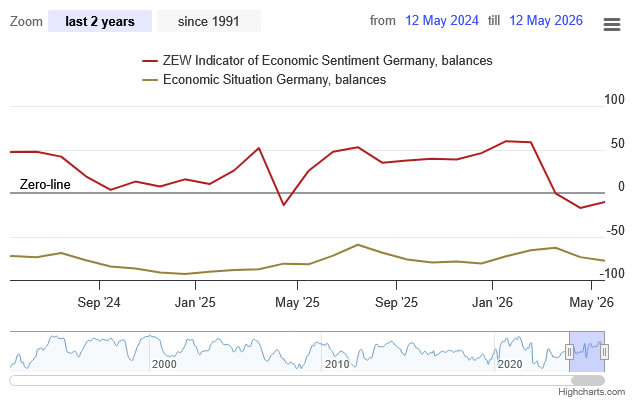
Germany’s ZEW Economic Sentiment index improved from -17.2 to -10.2 in May, beating expectations of -20.5 and signaling a modest improvement in investor confidence despite ongoing economic pressures linked to the Middle East conflict. Eurozone ZEW Economic Sentiment also rose sharply from -20.4 to -9.1, while the Eurozone current conditions gauge improved slightly by 1.6 points to -41.4.
However, the underlying picture for Germany’s economy remained weak. The Current Situation index deteriorated further from -73.7 to -77.8, slightly worse than expectations, highlighting the continued strain from weak industrial production, elevated energy costs, and soft domestic demand.
ZEW President Achim Wambach said financial market experts are increasingly hoping the Iran war will end soon, but warned that rising energy prices and inflation above 2% continue to burden the German economy.
The industry breakdown showed a highly uneven recovery outlook. Germany’s automotive sector deteriorated sharply, with the industry indicator falling to -57.2, while mechanical engineering also weakened further to -32.1. Private demand conditions remained deeply negative and deteriorated further.
By contrast, sentiment improved strongly in information technology, where the indicator jumped to 56.6, while construction and metal production also showed signs of stabilization.
ZEW said there is "cautious hope" for a recovery in the second half of 2026 if Middle East tensions ease and government stimulus measures begin supporting growth more effectively.
| Indicator | Previous | Latest | Expectation |
|---|---|---|---|
| German ZEW Economic Sentiment | -17.2 | -10.2 | -20.5 |
| German Current Situation | -73.7 | -77.8 | -77.5 |
| Eurozone ZEW Economic Sentiment | -20.4 | -9.1 | |
| Eurozone Current Situation | -43.0 | -41.4 | |
| German Automotive Sector Indicator | -44.2 | -57.2 | |
| Mechanical Engineering Indicator | -22.9 | -32.1 | |
| Private Demand Indicator | -33.4 | -41.6 | |
| Information Technology Indicator | 44.5 | 56.6 |
EUR/GBP Surges as Markets Price “Zombie Government” Risk as Starmer Crisis Deepens
Sterling plunged sharply today while UK bond yields surged above 5.1% after the first ministerial resignation calling for Prime Minister Keir Starmer to step down transformed simmering political anxiety into something much more dangerous for markets: the perception that Britain may now be drifting toward a “zombie government.”
The trigger came shortly after 9:15 a.m. London time when junior minister Miatta Fahnbulleh announced her resignation and publicly urged Starmer to “do the right thing for the country and the Party and set a timetable for an orderly transition.” Markets had already been increasingly nervous following Labour’s disastrous local election results last week. But Fahnbulleh’s resignation suddenly made the leadership crisis feel real rather than theoretical.
The political arithmetic has also deteriorated rapidly. Reports now indicate that more than 80 Labour MPs — roughly one-fifth to one-quarter of the Parliamentary Labour Party — have either privately or publicly demanded that Starmer resign immediately or commit to a timetable for departure by September. The situation intensified after Catherine West revealed she had received overwhelming encouragement for a potential leadership transition.
For traders, 80 MPs is not just another headline number. It represents a psychological tipping point. Under Labour Party norms, a prime minister whose authority is widely seen as “fatally wounded” often struggles to regain control once coordinated resignation pressure begins building internally.
Markets are now increasingly pricing a full leadership contest as effectively inevitable.
The problem for investors is not simply who replaces Starmer. The deeper fear is that Britain may temporarily end up with a government too politically weakened to respond coherently to mounting economic challenges. Rising oil prices linked to the Iran conflict, elevated borrowing costs, and growing fiscal pressures are all hitting simultaneously while Labour increasingly appears consumed by internal survival battles.
That concern was visible immediately in markets. Sterling sold off aggressively while the 10-year gilt yield surged back above 5.1%, suggesting investors are demanding a growing political risk premium to hold UK assets. Importantly, the simultaneous fall in Sterling and rise in yields signals markets are not merely reacting to global macro conditions, but specifically reassessing confidence in Britain’s political management capacity.
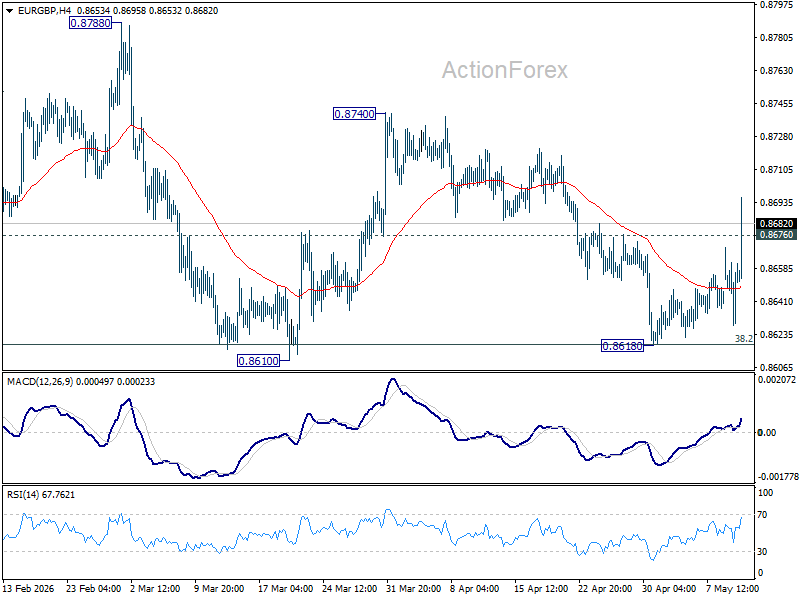
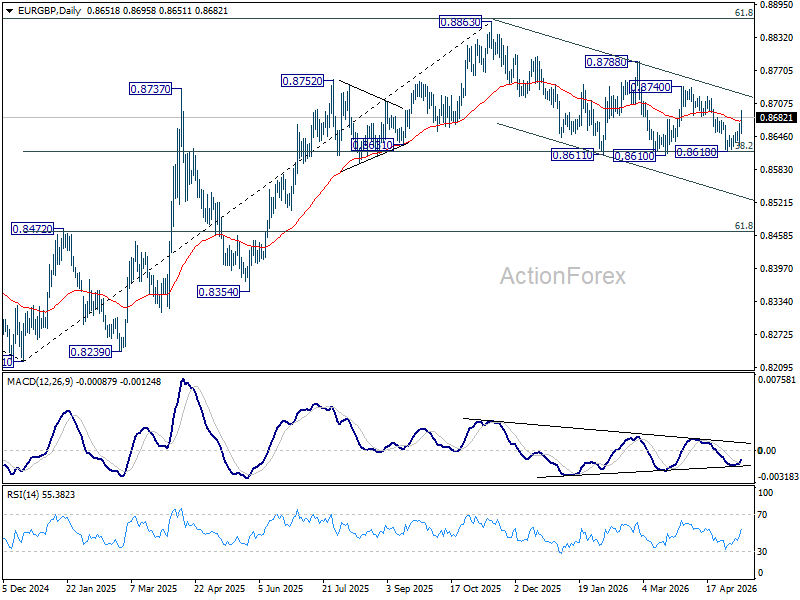
Technically, EUR/GBP’s breakout above 0.8676 confirms that fall from 0.8740 likely ended at 0.8618. Just as importantly, the repeated defense of 38.2% retracement of 0.8821 to 0.8863 at 0.8618 continues preserving the broader medium-term bullish structure in the pair.
The next upside target now sits at 0.8740 resistance. A decisive break above that level could open the way toward a retest of 0.8863, the 2025 high.
EUR/USD on Edge: Middle East and China in Focus
EUR/USD dipped slightly on Tuesday, retreating to 1.1762. The US dollar has returned to favour as a defensive asset after US President Donald Trump questioned the sustainability of the truce with Iran and rejected Tehran’s latest peace proposal.
Trump also plans to convene a meeting with his national security team to discuss a potential resumption of military operations and a review of plans to escort commercial vessels through the Strait of Hormuz.
The ongoing conflict continues to keep oil prices elevated, fuelling inflationary pressures and expectations that interest rates may remain higher for longer to contain price pressures.
Investors are now turning their attention to US inflation data for April, which is expected to indicate how the Iran conflict is impacting the economy and help guide potential Federal Reserve decisions.
An additional market factor is the expected meeting later this week between Donald Trump and Chinese President Xi Jinping, which is likely to focus on trade relations and the development of artificial intelligence.
Technical Analysis
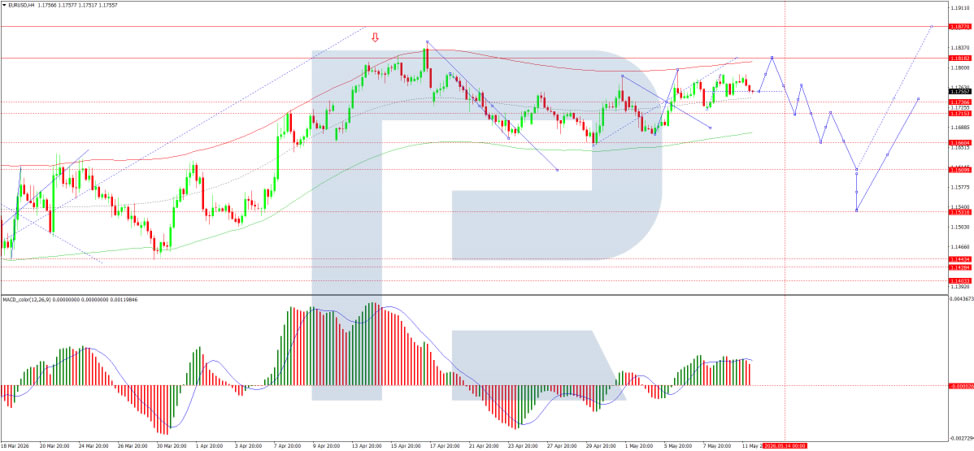
On the H4 chart, EUR/USD is trading within a consolidation range around 1.1755, with potential downside towards 1.1688. At the same time, a move higher towards 1.1818 remains possible, with further upside to 1.1870. This scenario is supported by the MACD indicator, with its signal line above zero and pointing firmly upwards, indicating continued bullish momentum.
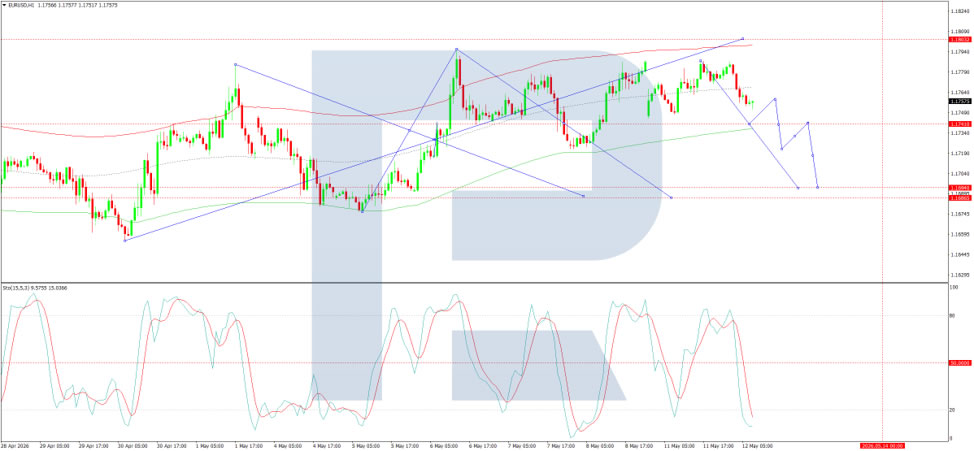
On the H1 chart, EUR/USD has reached 1.1786. A decline towards 1.1740 is likely, followed by a possible rebound to 1.1760 and further upside towards 1.1818. This scenario is confirmed by the Stochastic oscillator, with its signal line near 20 and pointing firmly upwards.
Conclusion
EUR/USD remains sensitive to geopolitical developments in the Middle East and upcoming US–China discussions. Strong inflation data could support the US dollar, while positive diplomatic progress may ease pressure on the pair and support further euro gains.
Bitcoin Smoothly Reacts Higher from Blue Box Zone
In this technical blog, we will look at the past performance of the 1-hour Elliott Wave Charts of Botcoin ticker symbol: BTCUSD. In which, the rally from the 29 April 2026 low unfolded as an impulse structure. Showing a higher high sequence in larger time frame charts favored more upside extension to take place. Therefore, we advised members not to sell the pair & buy the dips in 3, 7, or 11 swings at the blue box areas. We will explain the structure & forecast below:
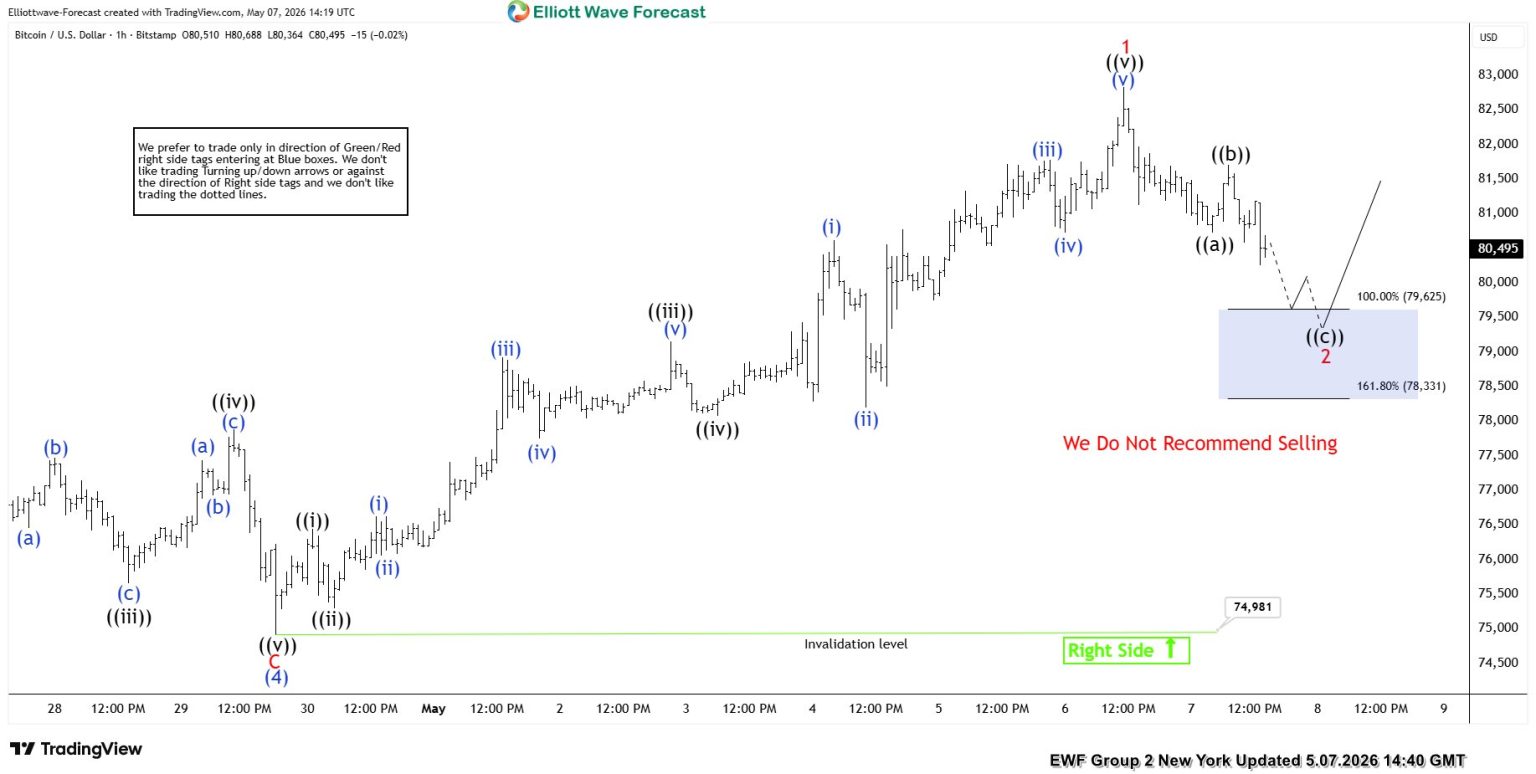
Bitcoin 1-Hour Elliott Wave Chart From 5.07.2026
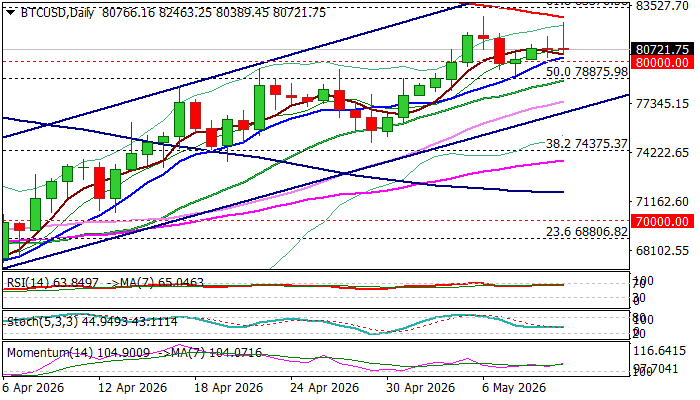
Here’s the 1-hour Elliott wave chart from the 5.07.2026 New York update. In which, the cycle from the 4.29.2026 low ended in wave 1 at $82833 high. Down from there, the BTCUSD made a pullback in wave 2 to correct that cycle. The internals of that pullback unfolded as Elliott wave zigzag structure where wave ((a)) ended at $80728 low. Wave ((b)) bounce ended at $81706 high and wave ((c)) managed to reach the blue box area at $79625- $78331. From there, buyers were expected to appear looking for the next leg higher or for a 3 wave bounce minimum.
Bitcoin Latest 1-Hour Elliott Wave Chart From 5.12.2026
This is the latest 1-hour Elliott wave Chart from the 5.12.2026 Asia update. In which the Bitcoin is showing a reaction higher taking place, right after ending the zigzag correction within the blue box area. Allowed members to create a risk-free position shortly after taking the long position at the blue box area. However, a break above $82833 high is needed to confirm the next leg higher towards $87072- $91961 target area.
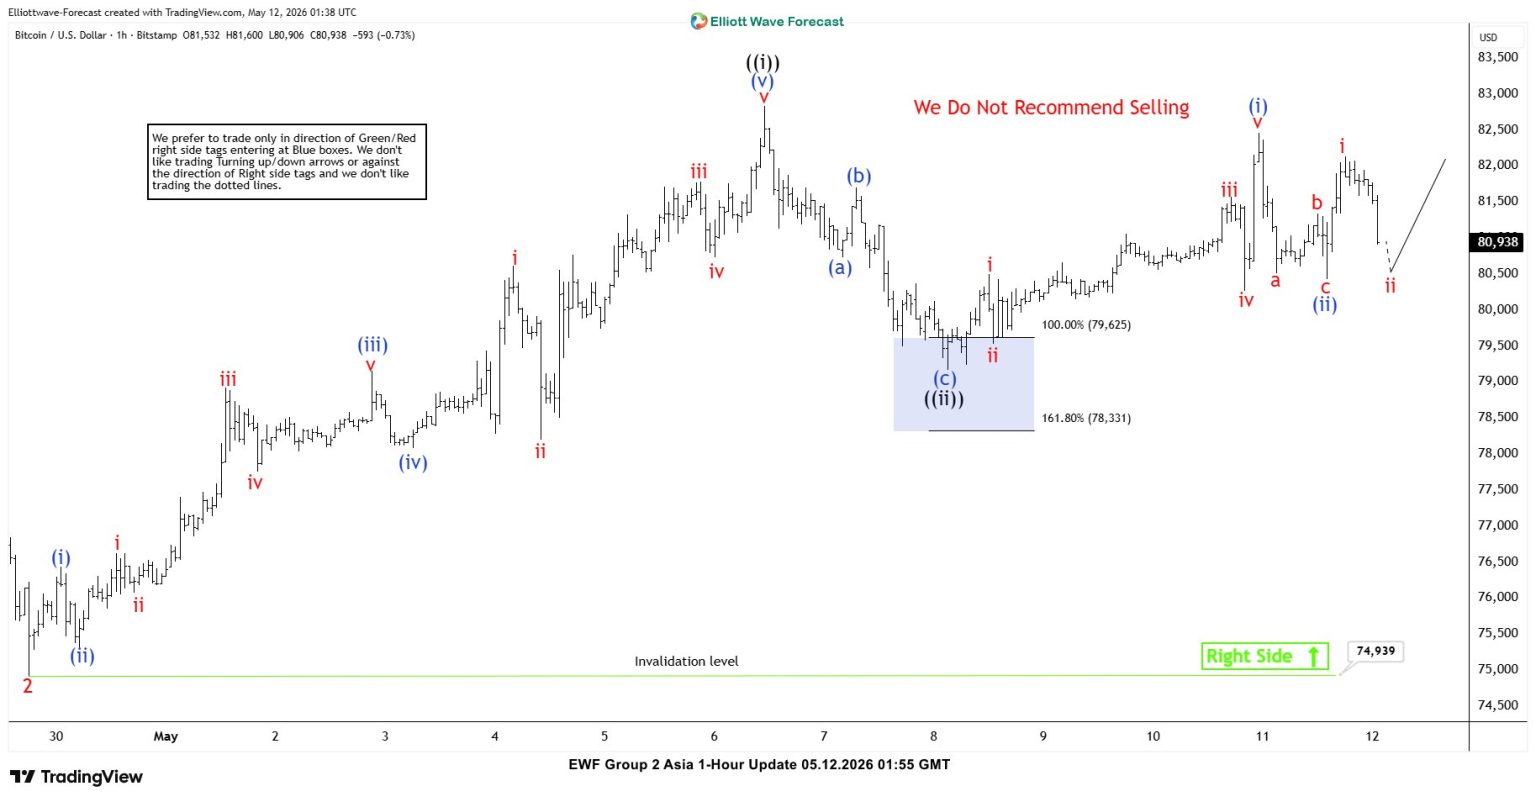
Chart Alert: Nikkei 225 Bullish Run Is Facing Minor Exhaustion Below 64,145
Key Takeaways
- Nikkei 225 continued its strong rally to a fresh record high of 63,788, driven largely by technology-related heavyweights such as SoftBank Group and Murata Manufacturing.
- Despite the broader medium-term bullish trend remaining intact, technical indicators now suggest a near-term corrective pullback risk below the 64,145 resistance level, supported by a developing bearish “Head & Shoulders” pattern.
- Momentum conditions have weakened as hourly RSI bearish divergence and Elliott Wave/Fibonacci analysis point to exhaustion in the recent five-wave bullish impulsive sequence, increasing the probability of a short-term retracement toward 61,945 and lower support zones.
The price actions of the Japan 225 CFD index, a proxy of the Nikkei 225 index futures, have rallied as expected in the past four weeks and surpassed 62,044, as highlighted in our earlier report.
It hit a fresh intraday all-time high of 63,788 on Monday, 11 May 2026, led by technology-related component stocks in the past month, such as SoftBank Group, up 58%, and Murata Manufacturing, up 53%.
However, the price actions of financial assets do not move vertically, as there will be periods of countertrend movements or trend reversals due to changing sentiment.
Right now, the Nikkei 225 faces the risk of a minor corrective countertrend decline within a medium-term uptrend phase.
Let’s unpack in greater detail.
Nikkei 225: Minor Bearish “Head & Shoulders” Sighted
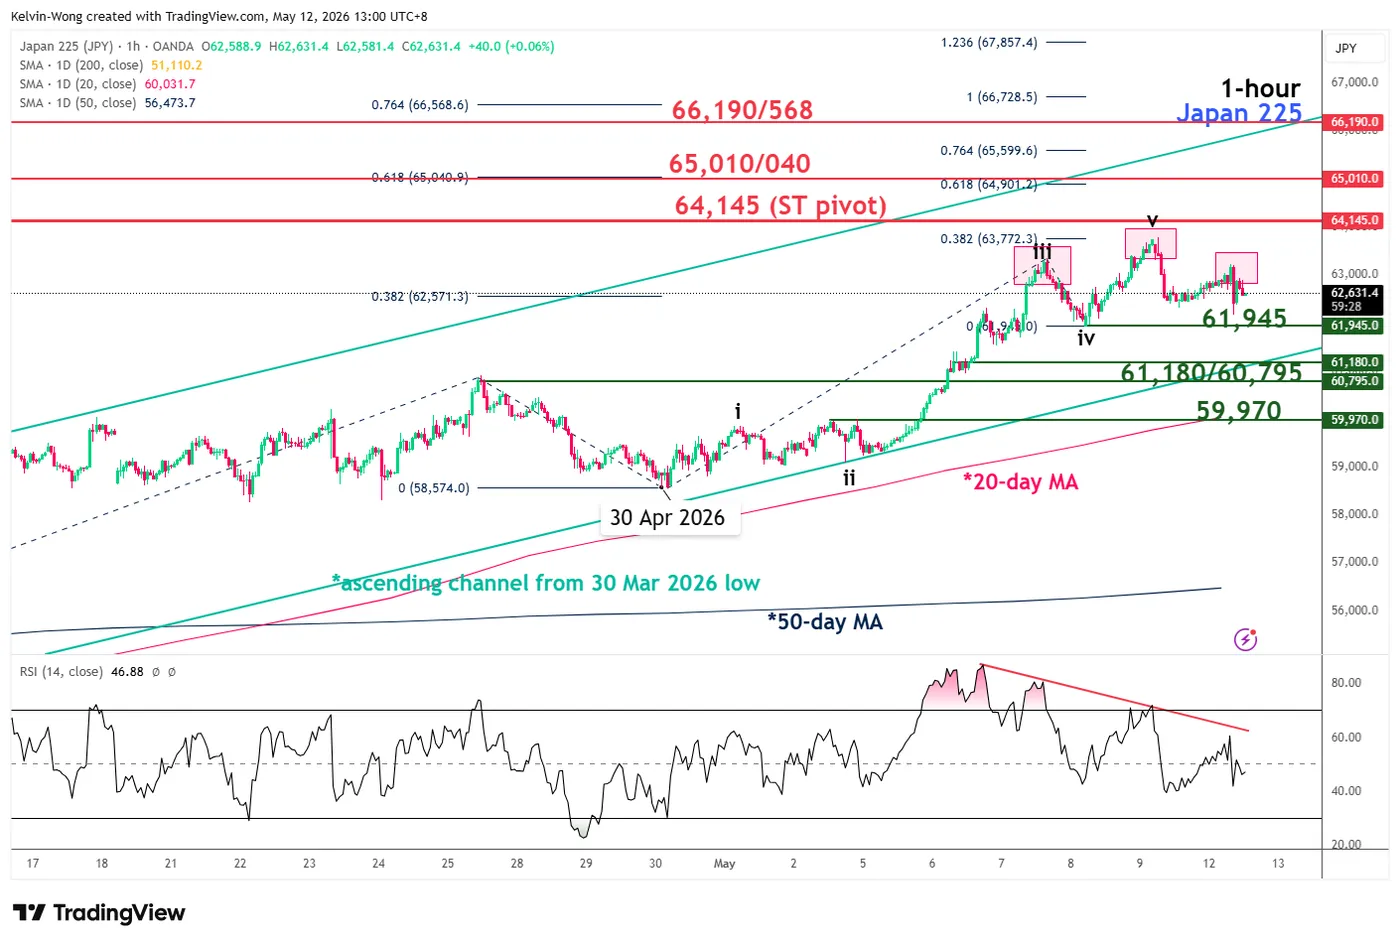
Fig. 1: Japan 225 CFD index minor trend as of 12 May 2026. Source: TradingView.
Trend bias: Minor bearish corrective decline within medium-term uptrend below 64,145 key short-term pivotal resistance.
Supports: 61,945, neckline of “Head & Shoulders”, 61,180/60,795, and 59,970, also the 20-day moving average.
Next resistances: 65,010/65,040 and 66,190/66,568, Fibonacci extension and upper boundary of the medium-term ascending channel from the 30 March 2026 low.
Key Elements to Support the Near-Term Bearish Bias on the Nikkei 225
- Since 7 May 2026, its price action has traced out a minor bearish reversal “Head & Shoulders” configuration, indicating a potential end of its minor uptrend phase from the 30 April 2026 low.
- Based on Elliott Wave Theory and Fibonacci analysis, the price actions have completed a five-wave minor bullish impulsive up move sequence, labelled as i, ii, iii, iv and v, with a potential terminal level at 63,772, based on 0.382 Fibonacci extension from the start of the minor bullish impulsive up move from the 30 April 2026 low. The next probable move is a minor corrective decline to retrace its prior five-wave minor bullish impulsive up move.
- The hourly RSI momentum indicator has shown a bullish exhaustion condition, with bearish divergence since 7 May 2026 at its overbought region, which supports the potential incoming minor corrective decline.
GBP/USD Slides Toward Trendline Support Below 1.3600
- GBPUSD weakens within consolidation.
- Loses ground on US-Iran tensions, UK political pressure, US data in focus.
- Momentum indicators point to a modestly fading positive bias.
GBPUSD is losing ground below the 1.3600 handle, eyeing support at the medium‑term ascending trendline. The pound is under pressure against the dollar amid domestic political uncertainty, lingering Middle East tensions, and ahead of key US CPI data.
Momentum indicators are easing within positive territory, with the MACD muted near its signal line and the RSI drifting toward neutral. This suggests consolidation within the 1.3525-1.3625 range may persist, with downside risks increasing if price breaks below the uptrend line and the 20‑day simple moving average (SMA) at the lower bound of the range.
Below that, further support is seen near 1.3465, followed by the 1.3385-1.3430 zone, which encapsulates the converging 50‑ and 200‑day SMAs and may help shield price action from deeper losses toward the 23.6% Fibonacci retracement of the January-March pullback near 1.3325. A decisive break below this level would expose the multi‑month lows.
On the upside, resistance near the 61.8% Fibonacci and psychological 1.3600 level, alongside the eleven-week high at 1.3625, remains firm. A sustained break above this area could reopen targets at 1.3715 and then the multi‑year high near 1.3985.
Summing up, GBPUSD remains under pressure as it attempts to stabilise around the previously broken uptrend line. Momentum though remains broadly constructive, suggesting that holding this support could still underpin upside attempts in the near term.
Sunrise Market Commentary
Markets
The UK prime minister Keir Starmer is hanging by a thread. A colossal defeat at the regional and local elections last week increasingly looks to be the straw that will break the camel’s back. It is the latest of the multiple hits Starmer took when being in office, ranging from the Mandelson case over policy missteps and dramatic U-turns and near-constant infighting. A speech yesterday by Starmer, in which he also insisted not to leave, failed to persuade many Labour members of his ability to change the party’s fortunes. A formal leadership challenge is triggered when 81 Labour lawmakers (20% of the total) rally behind a single candidate. But fearing for a chaotic process, many MPs prefer Starmer to either quit himself or set out plans for departing. More than 70 of the 403 MPs, among which several senior ministers, have already called on him to do so. According to the Financial Times citing people close, he was weighing things ahead of a crucial cabinet meeting later today. Starmer’s looming exit causes market concern over the UK’s fiscal future when a potential new PM takes over. Gilts underperformed greatly vs global peers yesterday with the 30-yr yield rallying more than 9 bps. Monday’s close at 5.67% is to be compared with the 5.74% multidecade high seen exactly one week ago. Yields rose earlier on the curve too to the tune of 8-8.5 bps, supported by rising oil prices after president Trump dismissed the Iranian counterproposal as “a piece of garbage”. He later called the ceasefire as being on massive life support. Brent finished at $104 and is nearing $105 per barrel this morning. European rates joined the broader move higher with net daily changes varying between 2.7 and 5.5 bps (swap) in a bear flattener. US yields added 5.2-7 bps in a similar curve shift. While most focus is going to its currency lately, Japanese bonds are gradually eroding to their weakest levels in many decades. The 30-yr yield for example rises to 3.8% this morning, extending a bounce higher that started with the Iran war. Closing at that level would only leave January 20 (3.87%) stand in between new record highs. The 10-yr yield (2.55%) is setting a 29-year high as we speak. The yen did show some of the biggest swings on the FX market yesterday with USD/JPY recovering to 157.2 and building on that move this morning (157.7). About half of the intervention impact is being wiped out. Most other currency pairs closed little changed, including sterling – for all of the uncertainty that’s plaguing it.
S April CPI is on tap today. Our in-house headline nowcast stands at a consensus-matching 3.7%, which would mean a quickening from March’s 3.3%. We expect core CPI at 2.6%, the same as in March. For food, after flat monthly growth in March, we cautiously assume 0.2% m/m, implying 2.9% y/y. Energy could rise another 5.4% m/m given further increases in oil and gasoline prices. That would correspond to 19.4% y/y (up from 12.6% in March). We’re particularly interested in the market reaction in an upside surprise. Combined with a labour market in a stable shape, there’s room for US yields rise and the dollar to appreciate. The 2-yr yield is closing in on the 4% barrier.
Supply today includes a $42bn 10-yr US auction and a new syndicated deal in Belgium. The Kingdom intends to issue the last of 2026’s three benchmark deals. This one will have a 5-year maturity and comes after the country raised €8bn and €6bn with the 10-yr and 30-yr deals earlier this year.
News & Views
The British Retail Consortium retail sales monitor shows uncertainty hitting sales in April. UK total retail sales decreased by 3% Y/Y (from +3.6% Y/Y) and by 3.4% Y/Y (from +3.1% Y/Y) on a like-for-like basis. The CEO at BRC said that April’s sales fall was largely driven by the Easter shift, with food hit hardest (food sales -2.5% Y/Y from +6.8% Y/Y). Non-food sales decreased by 3.3% Y/Y (from +0.9% Y/Y). Taking March and April together, and comparing them with the same two-month period in 2025 (to account for the timing of Easter), UK total retail sales increased by 1.5% Y/Y. Weak consumer confidence also played a role in April as fears about the Middle East conflict driving up living costs led shoppers to rein in. Big-ticket purchases fell, with the recent recovery in furniture losing steam, and uncertainty around summer holidays hitting discretionary spend.
South Korean presidential policy chief Kim Yong-beom triggered wild swings in local trading this morning. His suggestion to pay a dividend to South Korean citizens using taxes on AI profits sent the leading Kospi index initially more than 5% lower. He later clarified that he wanted to tap “excess tax revenue” instead of implementing a new windfall tax on corporate profits, but that offered only partial relief. The Kospi currently loses 2.75%. Just ahead of the comments, the index was within reach of the 8k mark for the first time ever.
GBP/JPY Daily Outlook
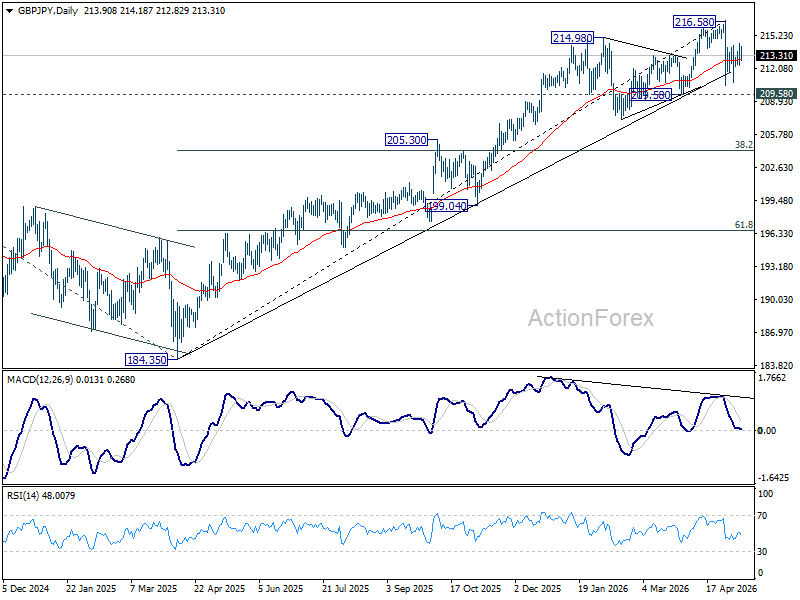
Daily Pivots: (S1) 212.51; (P) 213.46; (R1) 214.81; More...
Intraday bias in GBP/JPY is mildly on the upside with breach of 214.21 resistance. Pullback from 216.58 could have completed at 210.43. Further rise would be seen towards retesting 216.58. However, break of 212.35 will turn bias back to the downside for 210.43 again.
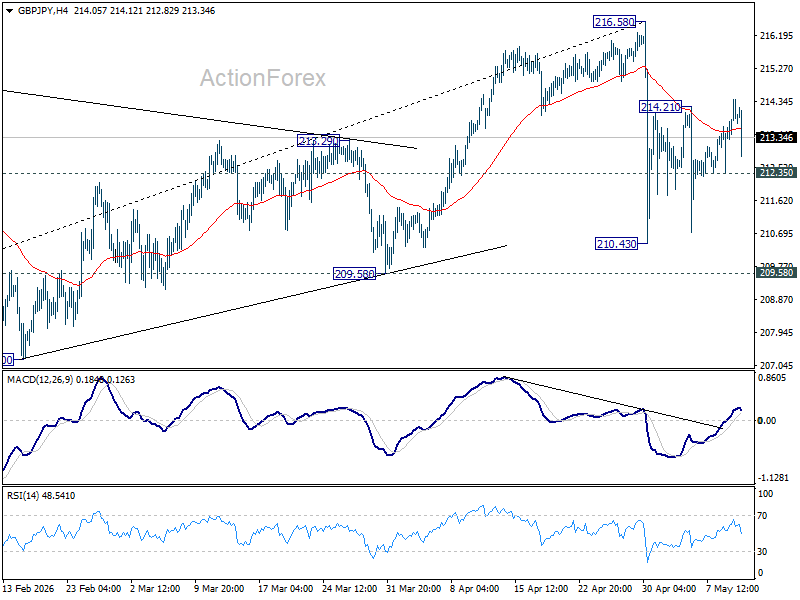
In the bigger picture, while the fall from 216.58 is steep, there is no clear sign of trend reversal yet. The long term up trend could still extend to 61.8% projection of 148.93 (2022 low) to 208.09 (2024 high) from 184.35 at 220.90 on resumption. However, sustained break of 55 W EMA (now at 205.75) will argue that it's already in medium term down trend for 184.35 support.