

Sample Category Title
Sunrise Market Commentary
Markets
May US PCE deflators, the Fed preferred inflation gauge, provided a reality check yesterday as the Warsh Fed last week explicitly committed to deliver on its price stability mandate given ongoing resilience in US growth and the labour market. The PCE report was very close to expectations. The headline May PCE deflator rose by 0.4% M/M resulting in the first 4%+ outcome since April 2023. Underlying inflation rose by 0.3% M/M and 3.4% Y/Y (up from 3.3%). Details showed goods inflation accelerating from 4.4% Y/Y to 4.8% Y/Y and services inflation from 3.5% to 3.8%. Services inflation excluding shelter came in at 3.9% Y/Y, all moving ever further away from the Fed's 2% target. At the same time, activity and spending data confirmed US economic resilience with strong May income and spending data (both +0.7% and better than expected), low weekly jobless claims (215k) and solid underlying durable goods orders. US Q1 GDP was also upwardly revised from 1.6% Q/Qa to 2.1%. After yesterday's US data releases, the KBC nowcast puts expected US Q2 growth at 2.74% (Q/Qa). This suggests that the US economy is performing above potential growth. Yesterday's data only reinforce the case for the Fed to prioritize inflation as 'guided' by Fed chair Warsh. However, some of the market reposition had already occurred end last week and early this week. The US curve (re)steepened slightly with the 2-y easing -2.3 bps while the 30-y added 2.1 bps. Equity markets showed somewhat of a diffuse picture despite blow-out Micron results published on Wednesday evening. A positive market response to this news was complicated by Apple announcing price hikes for several of its flagship products to cope with higher cost for memory ships and by rumours of a delay to OpenAI's IPO plans. The Nasdaq closed modestly lower (-0.46%) after a nervous open. Changes on the German curve also remained modest, with yields declining 1-2.5 bps across the curve. The pause in the (US) yields repositioning also spilled over to the US dollar. After breaking some key resistance levels earlier this week, the USD rally ran into resistance (DXY 101.43, EUR/USD 1.1370).
Risk sentiment turned again negative this morning in Asia with the Japanese Nikkei declining by 4.5% and the Kospi ceding 7% as uncertainty resurfaces. US yields in this risk-off context also tentatively ease a bit further as does the dollar. (EUR/USD 1.138, USD/JPY 161.6). Later today, risk sentiment probably will remain the dominant factor for global trading. Regarding the data ECB May inflation expectations and University of Michigan consumer confidence (also including inflation expectations data but final figure) are worth looking at even as we don't expect them to be 'gamechangers'.
News & Views
Prices in the Japanese capital were unchanged on a headline level in June, ticking up from 1.4% to 1.7% in the Y/Y-comparison. Both core measures increased by 0.1% M/M. Core CPI ex fresh food rose from 1.3% Y/Y to 1.6% Y/Y. Stripping out energy as well put the figure at 1.9% from 1.6%. The headline figure was distorted by measures to cap gasoline prices and by a temporary water-charge waiver. Today's Tokyo numbers are an early indicator for national inflation numbers published on July 24. They continue to bolster the case of a continuation of the BoJ's gradual policy normalization cycle. Japanese money markets currently discount a rate hike by the December meeting.
EU member states voted to extend the suspension of retaliatory tariffs on US goods tied to the Boeing-Airbus dispute. They cover about $4bn worth of American products including aircraft, tobacco and spirits. The move extends a truce in place since 2021 with the exact duration still being under discussion. The decision helps smoothen transatlantic trade relations with EU member states also approving the trade deal reached with the US last year ahead of the July 4 deadline imposed by US president Trump. Under the agreement, the EU pledges to scrap tariffs on a broad array of American industrial products while opening its market further to US farm goods and seafood.
Iran Strikes Ship Near Hormuz, Reaction Muted
In focus today
- In Sweden, a couple of interesting data points are coming out today. First off, PPI gives interesting insights into the buildup on inflationary pressures and is often cited as an important leading indicator by the Riksbank. Even more interesting is the NIER survey containing, amongst many other things, price plans that will be scrutinized in order to assess the pass-through of current supply disruptions to inflation. Furthermore, the broader ETI is also one of the best indicators of Swedish GDP growth and has recently been indicative of growth within the 2-2.5% interval.
- In Norway, the retail sales for June will be released today. Higher inflation and the prospect of higher mortgage rates have dampened retail growth, and we expect a modest increase of 0.3% in May.
- The ECB's Consumer Expectations Survey is released today covering May. Following a significant increase in March expectations stabilised in April with 1Y at 4.0% and 3Y at 2.9%. This is particularly interesting in relation to Schnabel's recent hawkish comment about bringing the inflation back to target.
Economic and market news
What happened overnight
US-Iran agreement, a cargo ship was reportedly attacked near Oman by Iran, prompting the U.N. maritime efforts to pause its Strait of Hormuz (SoH) escort operation and raising doubts over a preliminary deal to end the US-Iran war. Iran's Persian Gulf Strait Authority warned that ships outside its designated routes travel at their own risk, while shipping data showed crude flows through Hormuz have risen to their highest level since the war began. Despite an initial spike, Brent has slipped to below USD74/bbl and remains on track for steep weekly losses, as markets look past renewed Strait of Hormuz tensions and focus on the broader supply outlook.
What happened yesterday
In the US, the PCE inflation rose further in May, reinforcing expectations that the Federal Reserve could still deliver a rate hike later this year. Headline PCE inflation accelerated to 4.1% y/y in May, the first reading above 4.0% since April 2023, partly driven by higher energy prices amid the disruption in the SoH. Core PCE increased 3.4% y/y and 0.3% m/m, underscoring still-elevated underlying price pressures, especially in services. Nevertheless, the market has scaled back a bit on US rate expectations after PCE inflation was lower than expected in May.
In commodities, according to Reuters, Iraq is considering leaving OPEC if it does not secure a higher quota, following the UAE's exit on 1 May, which has strengthened Iraq's bargaining position. If traffic through the SoH normalises, increased output from the UAE and possibly Iraq could trigger a positive oil supply shock and even a price war that would effectively end OPEC, although Bloomberg tracking shows Hormuz traffic remains well below pre-war levels despite a recent pickup.
Equities:
Equity markets moved higher yesterday, but once again the dominant theme was not the index level itself but the significant sector and regional rotation underneath.
While European and Asian equities advanced, US equities moved lower, with trading once again dominated by intraday volatility centred on technology and the Iran/oil narrative.
As oil prices reversed higher during the US session, markets effectively unwound Wednesday's rotation, with capital moving out of consumer sectors.
Micron's exceptionally strong earnings released Wednesday evening also failed to provide lasting support for technology, as investor discussions increasingly revolve around the sustainability of earnings growth and, in particular, today's unusually elevated profit margins across parts of the semiconductor and memory complex.
It remains important to separate these rotation drivers from the underlying macro environment. The current volatility is being driven by geopolitics and ongoing questions surrounding parts of the technology sector, while the macro backdrop remains exceptionally strong.
That continues to argue for subdued overall market volatility and an upward direction for equities over time.
This morning Asian markets are trading sharply lower, led by the more technology intensive markets, while both US and European futures are also lower with technology once again accounting for most of the weakness.
FI and FX: Moves were more muted in rate space during yesterday's session. EUR swap rates tracked lower with the 2Y swap yield declining from 2.75% to just below 2.73% while the 10Y yield decreased marginally to below 2.92%. In the US, US yields dropped, in particularly in the front mirroring the moves in Europe. EUR/USD took a breather from its recent rally lower and ended the session back above 1.1350. EUR/NOK continued its rise, breaking above 11.20 as oil prices continue to trade heavy.
Elliott Wave Analysis: Gold (XAUUSD) Bearish Cycle Opens Room to $3400
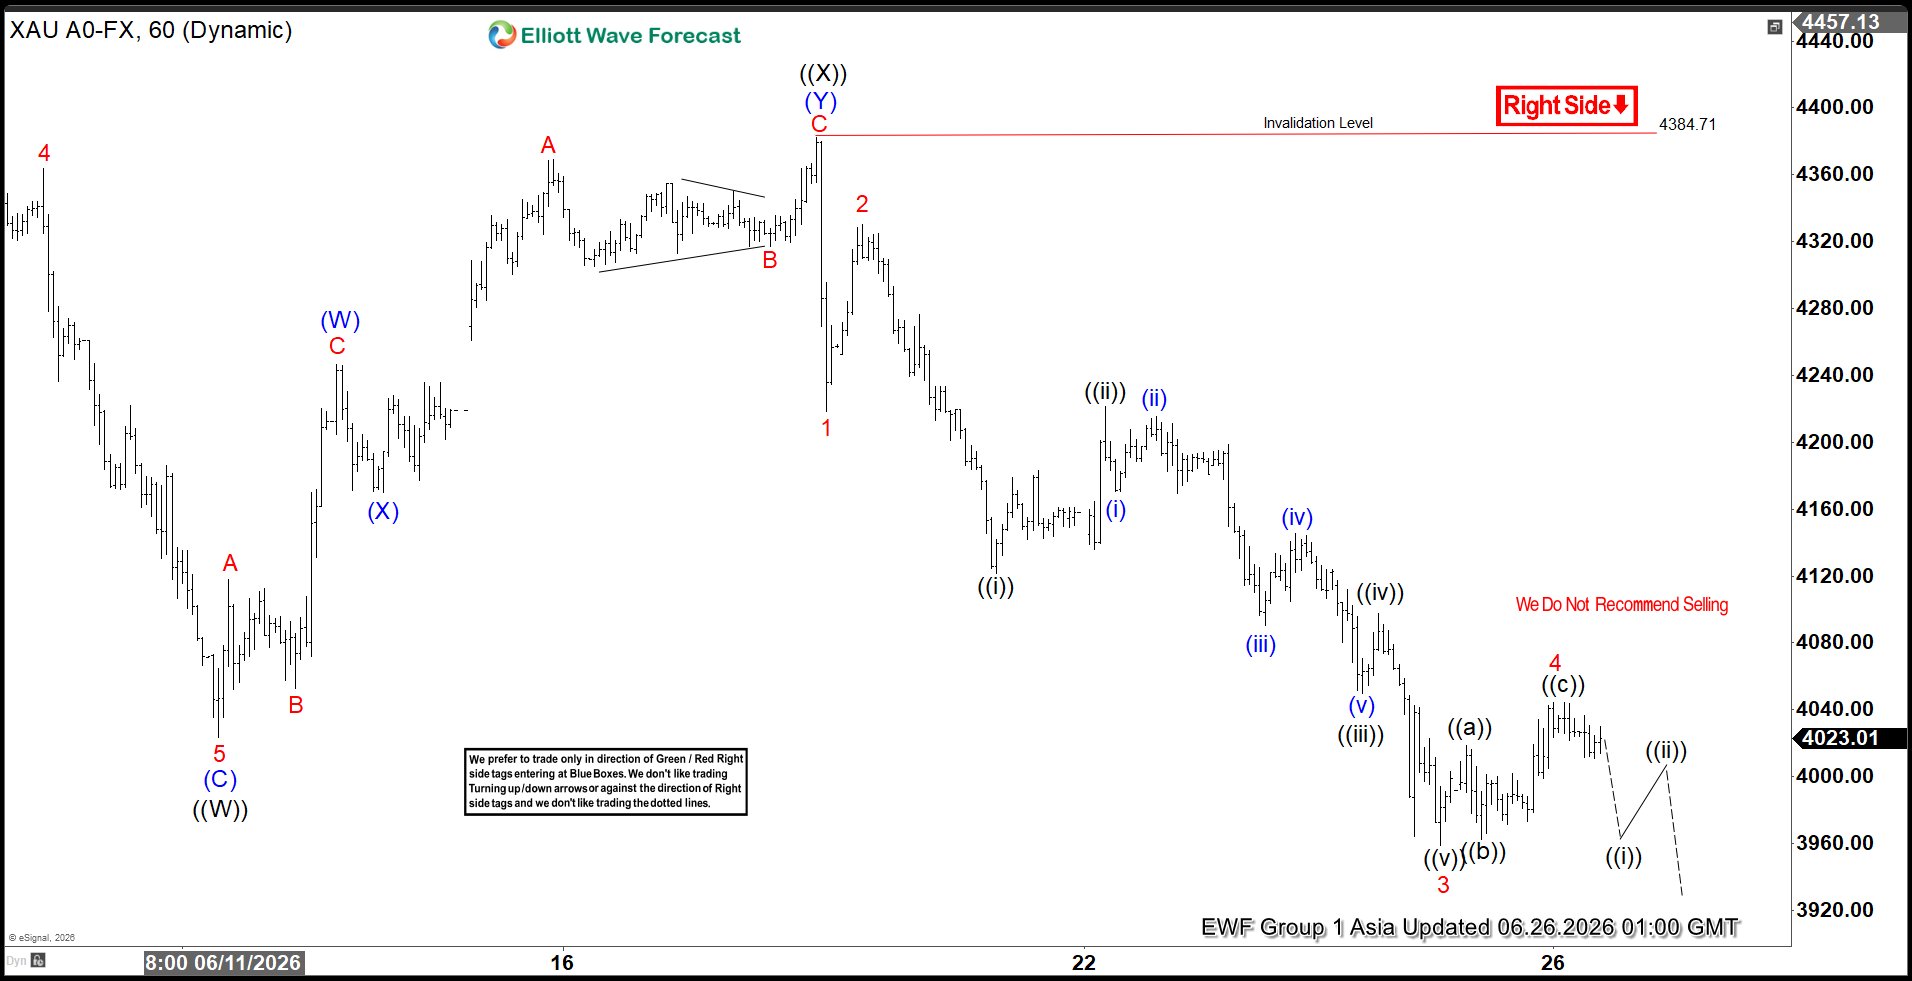
Gold (XAUUSD) reached its record high at $5598.75 on January 29, 2026, before entering a sustained corrective phase. The decline has lasted five months and is unfolding as a double three structure. This formation projects an extreme downside target in the $3040–$3400 range, assuming no truncation occurs. The short‑term sequence from the June 18 high is progressing as a five‑wave impulse, reinforcing the bearish bias.
Wave 1 ended at $4218.42, followed by a corrective rally in wave 2 that terminated at $4330.01. The metal then resumed lower in wave 3, reaching $3958.81. A modest rally in wave 4 is proposed complete at $4044.29. The expectation is for gold to continue lower in wave 5, which should also complete the higher degree wave (A). Once this leg concludes, a corrective rally in wave (B) is anticipated to retrace the cycle from the June 18 high before the market resumes its downward trajectory.
Near term, the structural pivot at $4384.70 remains decisive. As long as this level holds, rallies are expected to fail in three, seven, or eleven swing sequences. The broader framework highlights that the path of least resistance remains lower, aligning with projected targets in the $3040–$3400 zone.
Gold (XAUUSD) 60-Minute Elliott Wave Chart
XAUUSD Elliott Wave Video:
https://www.youtube.com/watch?v=zVrqisDHRnY
Bitcoin Has No Winning Scenario. Is $40K the Next Stop?
Bitcoin's brief rebound following Micron's blockbuster earnings proved remarkably short-lived. While the chipmaker surged more than 15% after issuing massive revenue guidance, the improvement in market sentiment evaporated almost as quickly as it arrived. Bitcoin is once again trading under heavy pressure as it struggles to defend the psychologically important 60,000 level. More importantly, if that support ultimately gives way, the next major downside target could emerge much closer to 40,000 than many investors currently expect.
The rapid fading of the so-called "Micron bump" illustrates that the problem extends well beyond day-to-day swings in risk sentiment. Although Micron itself rallied sharply, the broader technology sector continued to show signs of exhaustion. NASDAQ finished -0.46% lower overnight despite the earnings surprise, while Asian markets resumed their selloff with Nikkei dropping around -4.7% and KOSPI plunging more than -8% at the time of writing. The AI trade that has dominated markets throughout the year is increasingly selective, with investors becoming far less willing to indiscriminately chase high-beta assets.
AI Has Become Crypto's Biggest Competitor
That presents a unique challenge for Bitcoin because its traditional role within the risk spectrum has fundamentally changed. The cryptocurrency has now lost more than half its value from the October 2025 record high above 126,000. Rather than reflecting a temporary correction, the decline resembles a structural shift driven by institutional portfolio rotation and shrinking speculative liquidity.
In previous market cycles, Bitcoin was often one of the primary destinations whenever investors embraced aggressive risk-taking. That relationship appears to be breaking down. Today's speculative capital is increasingly flowing toward artificial intelligence instead. Landmark listings such as SpaceX and growing anticipation surrounding future IPOs from OpenAI and Anthropic have created an entirely new destination for high-growth capital. Institutional investors increasingly prefer businesses capable of generating strong earnings, expanding cash flows and dominant competitive positions over non-yielding digital assets. Simply put, AI has replaced crypto as the market's preferred speculative vehicle.
When Markets Turn Defensive, Bitcoin Doesn't Benefit Either
Unfortunately for Bitcoin, the opposite market environment offers little relief either. When inflation surprises to the upside—as highlighted by this week's 4.1% annual PCE inflation reading—and equities come under pressure, Bitcoin has failed to behave like digital gold. Instead, it has traded like a highly leveraged technology stock. The rapid expansion of US spot Bitcoin ETFs has integrated cryptocurrencies much more deeply into institutional portfolio management. During periods of macro stress, systematic investors often reduce exposure to their most volatile holdings first, while capital fleeing risk assets typically seeks refuge in cash, short-duration US Treasuries and traditional safe havens rather than cryptocurrencies. Bitcoin therefore finds itself losing both when risk appetite improves and when it deteriorates—a market with no obvious winning scenario.
The broader liquidity backdrop only compounds the challenge. Bitcoin has historically thrived when abundant global liquidity encouraged speculative investment. Today, the opposite forces are at work. The Federal Reserve is maintaining restrictive monetary policy to combat persistent inflation, shrinking the overall pool of speculative capital available to financial markets. At the same time, the AI revolution is absorbing an outsized share of whatever risk capital remains. With less liquidity overall and AI attracting an increasing proportion of investor flows, Bitcoin is struggling to generate the sustained buying needed to reverse its longer-term decline.
Technical Breakdown Brings $40K Into Focus
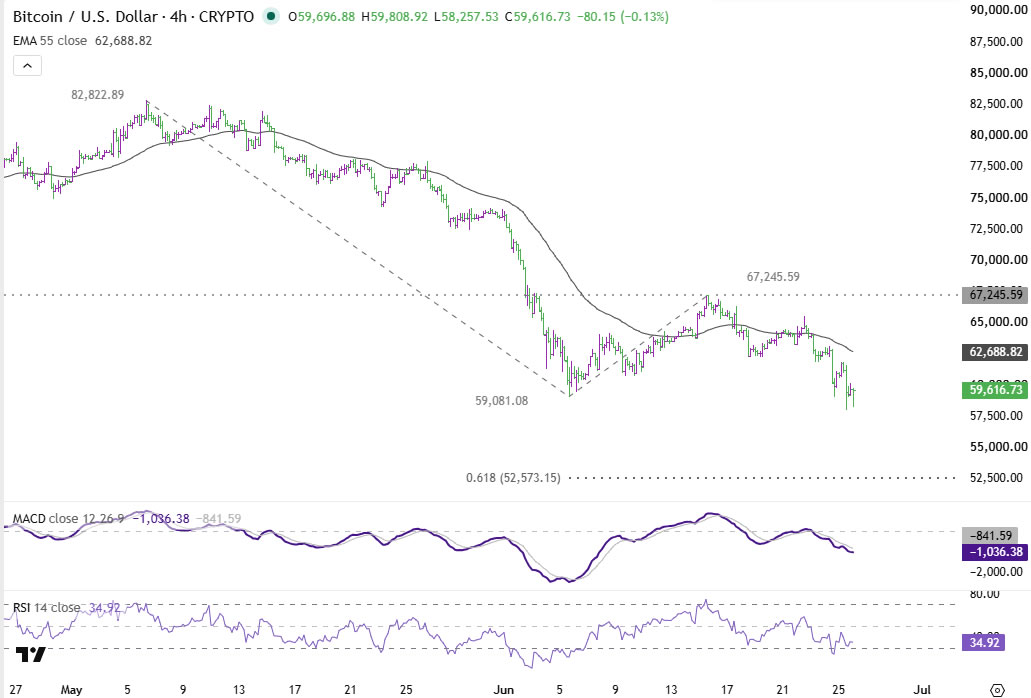
Technically, the outlook has deteriorated further. This week's break below 59,081 confirmed resumption of the medium-term down trend from the 126,230 record high. As long as 67,245 caps any recovery, downside pressure is expected to persist toward 61.8% projection of 82,822 to 59,081 from 67,245 at 52,573.
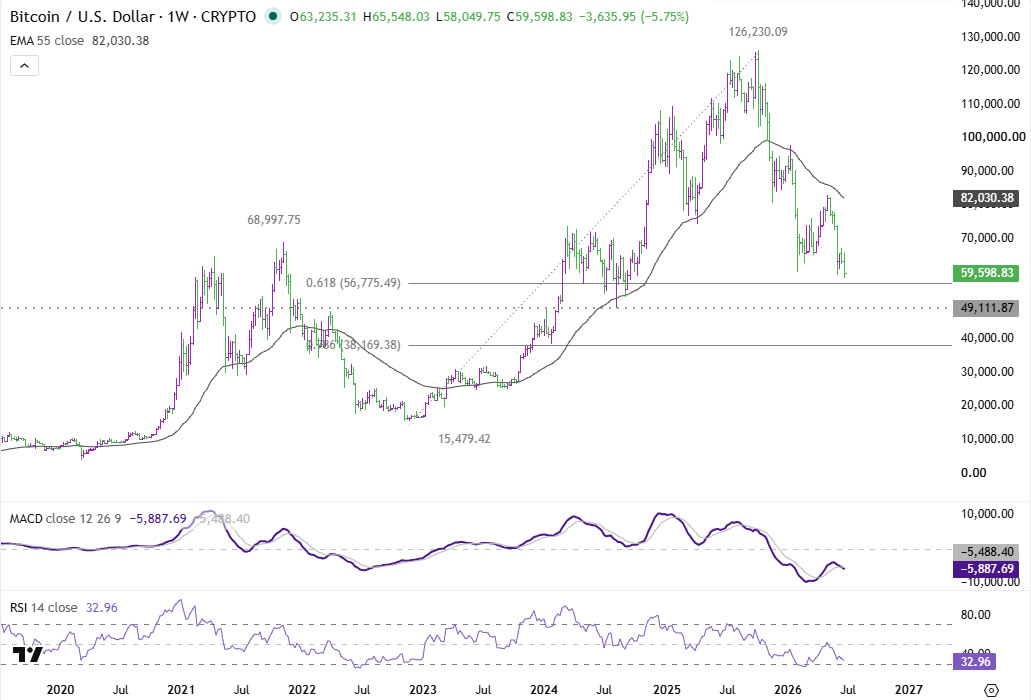
More importantly, the decisive break below the long-term at 56,775, 61.8% retracement of 15,479 (2022 low) to 126,230, significantly increases the risk of a move toward the major structural support around 49,111. Should that level also fail, there is considerable room for the decline to extend toward the 40,000 region, with the 78.6% retracement at 38,169 emerging as the next major long-term support capable of producing a more durable bottom.
USD/JPY Keeps Bulls in the Driver’s Seat with Fresh Gains Ahead
Key Highlights
- USD/JPY extended gains and traded above 161.50.
- A key bullish trend line is forming with support at 161.20 on the 4-hour chart.
- Bitcoin declined sharply to a new multi-week low below $60,000.
- EUR/USD could continue to move down if it stays below 1.1500.
USD/JPY Technical Analysis
The US Dollar remained supported above 159.20 against the Japanese Yen. USD/JPY extended gains and traded above 160.50 to enter a positive zone.
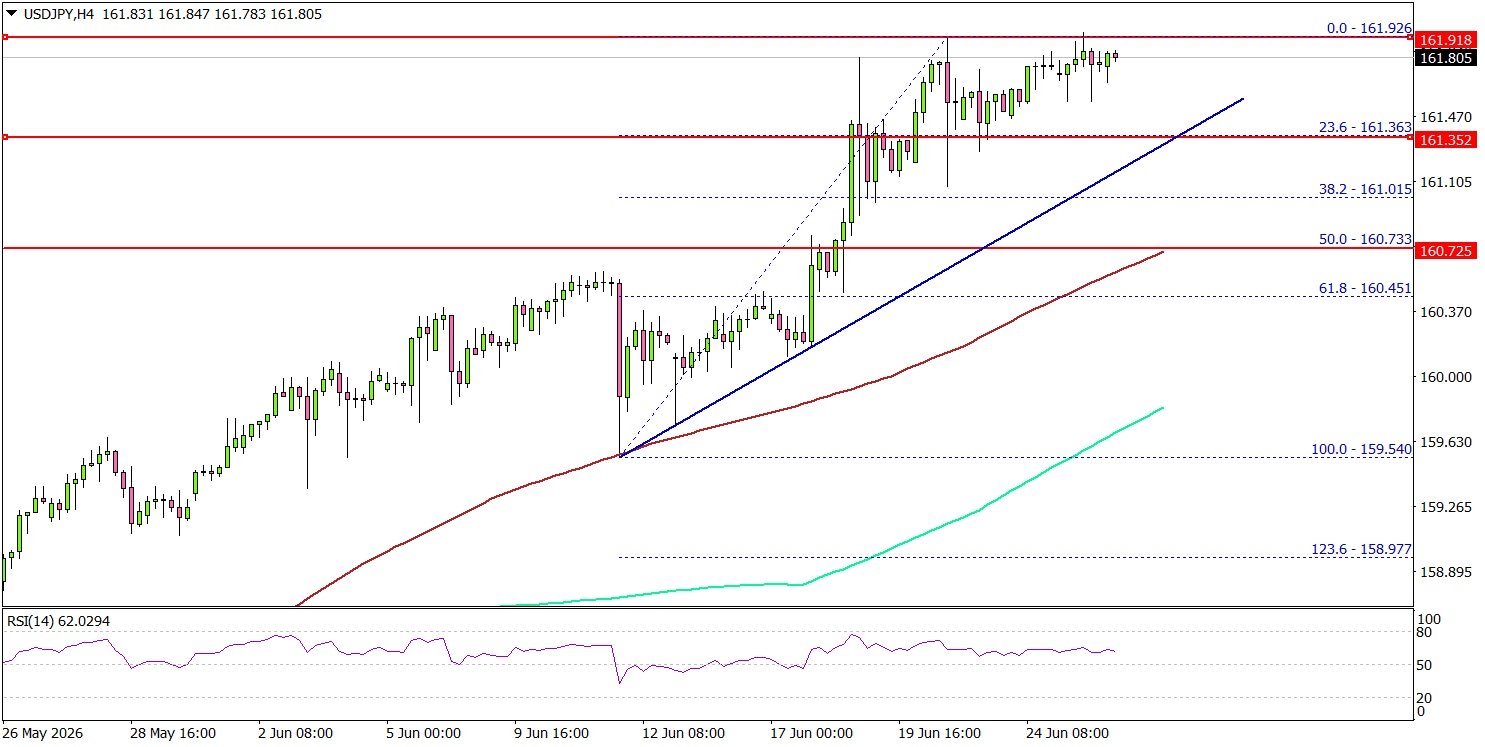
Looking at the 4-hour chart, the pair settled well above 161.20, the 100 simple moving average (red, 4-hour), and the 200 simple moving average (green, 4-hour). The bulls even pushed it toward 162.00.
A high was formed at 161.92, and the pair is now consolidating gains above the 23.6% Fib retracement level of the upward move from the 159.54 swing low to the 161.92 high. There is also a key bullish trend line forming with support at 161.20.
If there is another bullish wave, USD/JPY could face resistance at 162.00. The next major resistance might be 162.50. A close above 162.50 could open the doors for a larger increase. In the stated case, the bulls could aim for a move to 164.00.
On the other hand, if there is a downside correction, the pair could find bids near 161.50. The first major support could be near the trend line at 161.20.
A downside break and close below the trend line might send the pair toward the 50% Fib retracement level of the upward move from the 159.54 swing low to the 161.92 high at 160.75. Any more losses could open the doors for a test of 160.00.
Looking at Bitcoin, the bears remained in action, pushed the price below $60,000, and might remain in control in the near term.
Upcoming Key Economic Events:
- Fed's Williams speech.
- Fed's Kashkari speech.
- Michigan Consumer Sentiment Index for June 2026 – Forecast 50.0, versus 48.9 previous.
Tokyo Core CPI Rises to 1.6%, Underlying Inflation Continues to Firm
Tokyo inflation accelerated across all major measures in June, pointing to gradually strengthening underlying price pressures ahead of next month's Bank of Japan policy meeting. Core CPI, which excludes fresh food, rose from 1.3% yoy to 1.6% yoy, matching market expectations but remaining below the BoJ's 2% target for a fifth consecutive month. Headline inflation also picked up from 1.4% yoy to 1.7% yoy, while the core-core measure, which strips out both fresh food and energy, accelerated from 1.6% yoy to 1.9% yoy.
The rise in the core-core measure suggests inflation is becoming increasingly broad-based rather than being driven solely by energy costs. Price pressures are spreading into non-energy categories, particularly food and services. Food inflation presented a mixed picture, with rice prices falling -6% as last year's supply-driven surge continued to unwind. At the same time, prices for pork, tuna and potato chips all posted double-digit increases, indicating that cost pressures remain evident across many consumer staples.
Services inflation also continued to strengthen, rising 1.1% yoy and led in part by higher lodging costs. As services prices are generally viewed as a better gauge of domestic demand and wage-driven inflation, the latest figures are likely to be closely watched by BoJ policymakers. While core CPI remains below the central bank's target, the continued pickup in underlying inflation supports the view that price pressures are gradually becoming more entrenched, reinforcing expectations that the BoJ will continue its policy normalization path.
| Indicator y/y | June | May | Expectation |
|---|---|---|---|
| Tokyo Headline CPI | 1.7% | 1.4% | — |
| Tokyo Core CPI (ex Fresh Food) | 1.6% | 1.3% | 1.6% |
| Tokyo Core-Core CPI (ex Fresh Food & Energy) | 1.9% | 1.6% | — |
Fed’s Goolsbee Keeps Focus on Inflation, Echoes Warsh on Rate Guidance
Chicago Federal Reserve President Austan Goolsbee said inflation remains the Federal Reserve's primary concern, warning that underlying price pressures continue to move in the wrong direction despite some recent improvement. Speaking in a CNBC interview on Thursday, Goolsbee said, "If we look at core inflation, it's still well too high and it's trending the wrong way, and we've got to see improvement on that." He added that while there have been "a few bright spots," policymakers still have more work to do before inflation can be considered under control.
Goolsbee pointed in particular to services inflation, where he acknowledged some encouraging developments but stressed that progress remains insufficient. "You have seen now a little bit of improvement on this services inflation, and I've been identifying that as something that we would want to see," he said. Even so, he concluded that "as between the two sides of the Fed's mandate—the inflation side and the job market side—clearly the problem's on the inflation side." He also noted that although oil prices could fall rapidly after their recent surge, services inflation remains elevated and moderating wage growth offers "no guarantee inflation will ease."
Despite his hawkish assessment of inflation, Goolsbee declined to offer guidance on the next policy move. He refused to speculate on whether the Fed should raise interest rates or keep them unchanged, saying he agreed with Chair Kevin Warsh's approach of avoiding unnecessary market speculation over the future rate path. His remarks reinforce the Fed's broader message that policymakers remain firmly focused on restoring price stability while leaving future decisions dependent on incoming economic data.
Fed’s Williams Sees Inflation Returning to 2% Only in 2028
Federal Reserve Bank of New York President John Williams reinforced the case for a prolonged period of restrictive monetary policy, warning that inflation remains too high and is now likely to take longer than previously expected to return to target. Speaking on Thursday, Williams said, "Inflation is still too high," while stressing that "it is imperative that we restore inflation to 2% on a sustained basis." He now expects inflation to return to the Fed's target only in 2028, a year later than his previous projection.
Despite the delayed inflation outlook, Williams stopped short of advocating additional near-term tightening. Instead, he argued that "monetary policy is well positioned to lower price pressures," suggesting the current policy stance remains sufficiently restrictive. He expects inflation to moderate over the coming quarters as tariff-related price increases fade, housing inflation cools, and geopolitical pressures linked to the Middle East continue to ease.
Williams also maintained a constructive view of the broader economy, saying growth should remain positive despite elevated uncertainty. A resilient labor market, together with gradually easing inflation, should allow the current policy stance to continue working through the economy. His remarks reinforce the Fed's higher-for-longer message, indicating policymakers remain committed to restoring price stability even if the journey back to 2% takes considerably longer than previously anticipated.
Cliff Notes: Patience is a Virtue
Key insights from the week that was.
Australian consumer prices fell 0.7% in May, bringing the annual rate of headline inflation down from 4.2%yr to 4.0%yr. The main cause of the decline was an 11.9% fall in auto fuel prices; but, relative to our own forecast, it was holiday travel and accommodation that was the primary contributor.
Stripping out these factors, trimmed mean inflation lifted from 3.4%yr to 3.6%yr. Housing inflation was, once again, key with rents surprising to the upside and new dwelling costs recording their strongest monthly increase since late-2022. The latter contrasts with growing evidence of cooling demand in the housing market, pointing to margin pressure for homebuilders. Cost pass-through was also evident in the detail, though weak household spending may stop businesses from recouping costs through mid-year and beyond. The abrupt reversal in energy supply and prices through June (see below) may also see businesses write off margin compression as a transient concern.
Employment subsequently bounced back from holiday-related weakness in April as expected, jobs up +40.3k and the unemployment rate ticking down to 4.4%. That said, revisions to April offset May’s gain, stalling growth in Q2-to-date after a robust Q1. Looking past the month-to-month volatility, the unemployment rate trend is starting to edge up, in line with our expectation for a sustained softening.
Offshore, the past week saw the Memorandum of Understanding between the US and Iran take effect and a consequent rapid opening up of the Strait of Hormuz, freeing circa 20 million barrels of oil from the Strait in recent days. For the most part, the price of oil has trended down, reaching USD72 mid-week, a level last seen before the conflict began in February. It has not been all smooth sailing, however, an attack on a commercial ship off the coast of Oman overnight sparking concern and an increase in the oil price back above USD75. Several points still require detailed negotiation, including Iran’s nuclear program and the management of the Strait beyond the first 60 days. Discussion on a framework to resolve differences on these matters began at the weekend in Switzerland, and are likely to continue for weeks, if not months. Risks for energy supply and price will therefore linger for the foreseeable future.
On the data front, US personal income surprised to the upside in May, rising 0.7% after being unchanged in April. Compensation growth was more modest at 0.4%, consistent with the average since the beginning of the year. Personal spending growth also accelerated to 0.7%, although much of the gain was driven by inflation, with real spending up just 0.3% after a flat April print. PCE inflation was a touch softer than expected in May at 0.4%, while core inflation was in line at 0.3%. Q2 is therefore looking like another soft period for the US consumer. Notable too is that revisions have been against the consumer, the third estimate of Q1 GDP this week seeing quarterly consumption growth revised down to just 0.5% annualised. An upgrade to business investment and a material reduction in import growth in the quarter more than offset for GDP; but being more than 70% of the economy, the weakness in consumption will have a significant bearing on the aggregate pulse hence.
In our view, this data and events in energy markets warrant the FOMC remaining on hold for the remainder of the year as inflation risks slowly abate. However, the market is likely to continue to price the risk of further tightening, particularly while the White House remains out of the monetary policy debate and AI optimisim persists.
US PCE Inflation Remains Sticky in May as Consumer Spending Accelerates; EURusd Reacts
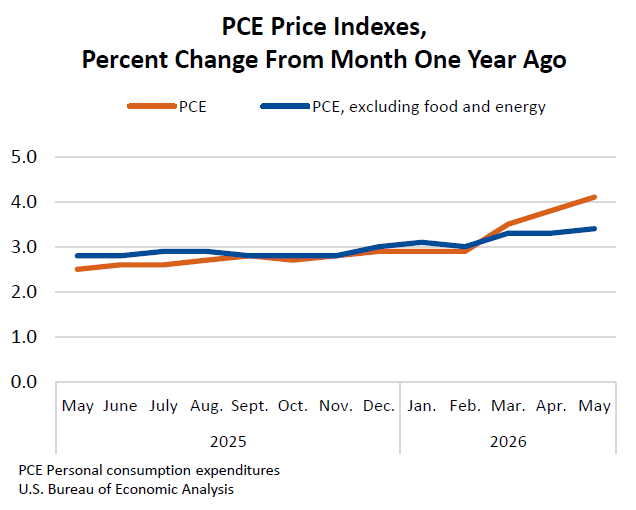
The Bureau of Economic Analysis (BEA) released the Personal Consumption Expenditures (PCE) price index data on June 25, 2026. The headline PCE price index rose 0.4% on a month-over-month basis and 4.1% year-over-year, matching the Bloomberg economic calendar consensus forecasts. Meanwhile, the core PCE price index—which excludes volatile food and energy components and serves as the Federal Reserve’s preferred inflation gauge—increased by 0.3% from the previous month and 3.4% from a year ago, also aligning perfectly with market expectations. The data highlights persistent inflationary pressures, keeping the Federal Reserve under pressure to maintain a restrictive monetary policy stance.
Headline vs. core PCE inflation
The Federal Reserve closely monitors core PCE inflation because it strips out the transitory volatility of food and energy prices, providing a clearer view of long-term underlying inflation trends. Additionally, the PCE index accounts for substitution bias—where consumers switch to cheaper alternatives as prices rise—making it a more dynamic measure than the Consumer Price Index (CPI).
Personal consumption expenditure - PCE - Source: Bureau of Economic Analysis -
Past performance is not indicative of future results.
| Metric | MoM change | YoY change | Trend |
|---|---|---|---|
| PCE price index | 0.4% | 4.1% | Upward from 3.8% prior |
| Core PCE price index | 0.3% | 3.4% | Upward from 3.3% prior |
Consumer spending and prices
- Robust consumer demand: Personal spending rose by 0.7% in May, outpacing the 0.6% forecast, while real personal spending ticked up 0.3%. This indicates that consumer demand remains resilient despite elevated borrowing costs.
- Income growth: Personal income accelerated sharply by 0.7%, well ahead of the 0.4% consensus estimate, providing households with the financial buffer to sustain spending.
- Services vs. goods: Services inflation continues to be the primary driver of price stickiness, sustained by steady wage growth and a tight labor market, as evidenced by initial jobless claims dropping to 215k.
Cross-comparison with CPI and PPI data
The sticky PCE print aligns with the earlier Consumer Price Index (CPI) report, which also showed a flattening of the disinflationary trend, particularly in shelter and core services.
Compared to the Producer Price Index (PPI) data from earlier in the month, which tracks wholesale costs, input pressures remain uneven. While some manufacturing supply chains have stabilized, the pass-through of resilient service-sector input costs continues to filter into consumer-facing metrics, limiting how quickly final prices can moderate.
Macroeconomic and Federal Reserve implications
With headline inflation edging up to 4.1% and core PCE sticking at 3.4%, progress toward the Federal Reserve’s 2% average inflation target appears to have stalled. Combined with an upward revision to first-quarter GDP to 2.1% and resilient durable goods orders, the economic backdrop suggests that the FOMC may prolong its “higher for longer” interest rate stance. The probability of near-term rate cuts may diminish, as the central bank requires more conclusive evidence of cooling demand before easing policy.
Gain insights from OANDA's market experts and learn how to apply technical analysis tools in a real-time market. Register to attend live webinars hosted by Moheb Hanna, CMT, CFTe.
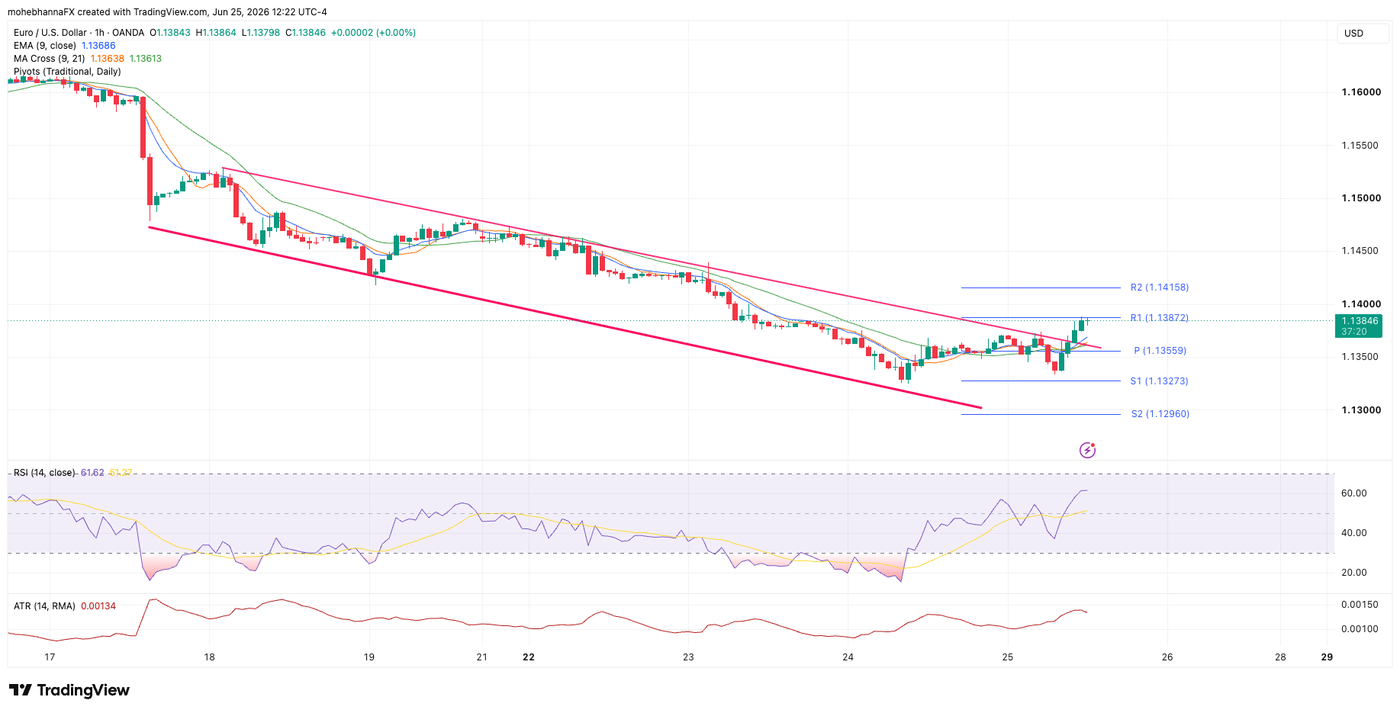
EUR/USD 1-Hour chart technical analysis
Price action and trend analysis
- Descending Channel Breakout: For the past several days, price action has been tightly contained within a clear descending channel (demarcated by the two solid pink trendlines).
- Recent Breakout: The most notable recent development is that the price has aggressively broken out above the upper descending trendline.
- Moving Averages: The price is currently trading above both the EMA (9) and the MA Cross (9, 21), which are starting to curl upward, confirming short-term bullish momentum following the breakout.
Pivot points & key levels
The chart displays Daily Traditional Pivot Points, providing immediate horizontal structural levels:
- R2 (Resistance 2): 1.14158
- R1 (Resistance 1): 1.13872 — The price is currently testing this level.
- P (Daily Pivot): 1.13559 — Acting as immediate dynamic support.
- S1 (Support 1): 1.13273
- S2 (Support 2): 1.12960
Indicators (RSI & ATR)
- RSI (14): Currently sitting at 59.72 and climbing above its yellow moving average line. It has firmly exited the oversold territory seen on the 24th and has room to run before hitting the overbought threshold (70.00), signaling strong bullish momentum.
- ATR (14): Sitting at 0.00139 (approx. 14 pips). Volatility is ticking up slightly from its recent floor, which aligns with the breakout move.