Sample Category Title

Three Forces Driving the Dollar Upwards

  • Safe-haven demand, trade flows and shifting FOMC expectations are bolstering the DXY.
  • The yen could benefit from capital repatriation.

The dollar index is approaching the highs of its 11-month range, whilst Donald Trump reports on successful negotiations with Iran. The US President has stated that Iran has met most of his 15 demands. There are rumours of a ground operation with various objectives, ranging from the capture of Kharg Island with its oil infrastructure to the seizure of 1,000 pounds of uranium belonging to Tehran.

The White House’s intentions are increasingly only heightening investor jitters, forcing them to flee to the US dollar as a safe haven. At the same time, rising oil prices are boosting demand for the greenback, as the currency benefits from higher oil prices. A third supportive factor is the shift in the Fed’s stance from imminent rate cuts to a readiness to raise rates to combat inflation.

In such conditions, macroeconomic data and monetary policy are destined to take a back seat. Bloomberg experts expect US employment to rise by 60,000 in March following a decline of 92,000 in February. Unemployment, in their view, will remain at 4.4%. However, an increasing number of FOMC officials view inflationary risks as a more pressing threat than a cooling labour market. As a result, the futures market is pricing in a 92% probability that rates will not fall in 2026, compared with just 4% before the conflict in the Middle East.

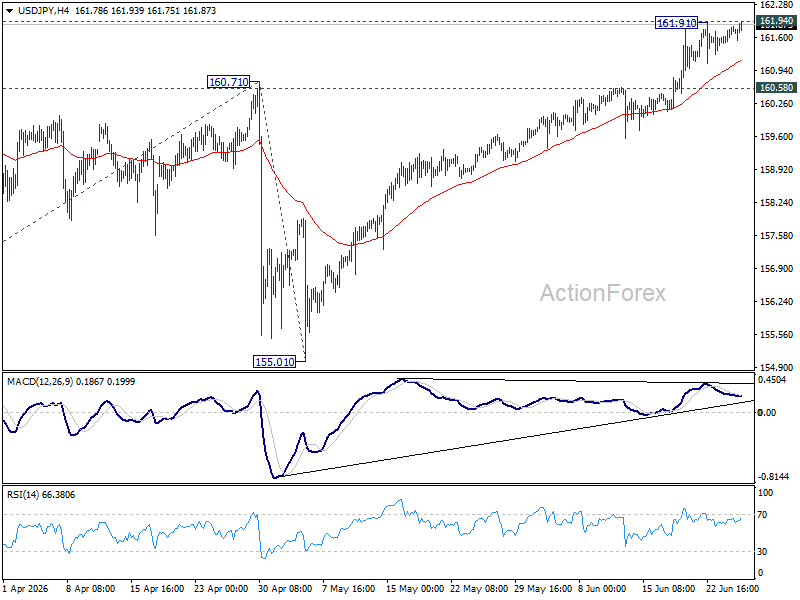
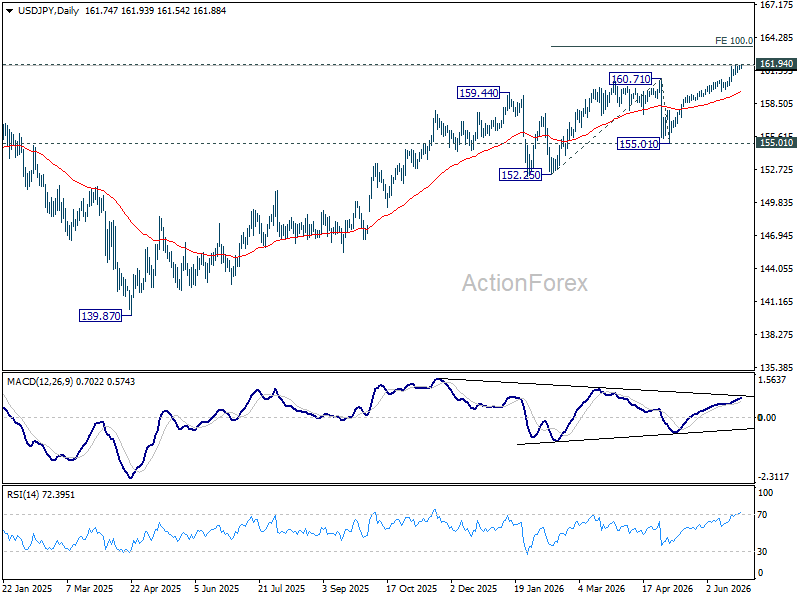
Meanwhile, rumours of Japan’s activity in the oil market and the intensification of verbal interventions have contributed to the retreat of USDJPY, which has pulled back from the psychologically important 160 level.

Eurizon SLJ Capital believes that as the conflict escalates, the US dollar will strengthen against most currencies, but not against the yen. The yen could benefit from capital repatriation amid a widespread decline in stock indices.

Despite attempts to rise, gold remains under pressure. The precious metal has transformed from a safe-haven asset into a source of liquidity. Investors are selling it to meet margin requirements on shares and bonds, whilst central banks are selling to support their economies and stabilise national currencies.

EUR/USD: Middle East Conflict Still Determines Sentiment

EUR/USD edged higher on Monday after earlier declines, reaching 1.1516. The US dollar continues to draw support from safe-haven demand amid the ongoing Middle East conflict, which has now entered its fifth week with no signs of resolution.

Tensions escalated following Donald Trump’s remarks regarding the possible confiscation of Iranian oil and control of the export hub on Kharg Island. At the same time, the US is increasing its military presence in the region and preparing for potentially prolonged operations. Iran-aligned forces, including the Houthis in Yemen, have also joined the conflict.

Rising oil prices in this environment are amplifying inflation risks and reinforcing expectations of tighter Federal Reserve policy. The market is increasingly pricing in the possibility of a rate hike this year, marking a notable shift from earlier expectations of rate cuts.

Investor focus now turns to US macroeconomic data. This week will see the release of labour market indicators, including JOLTS and ADP figures, as well as the key March employment report due on Friday.

Technical Analysis

On the H4 chart, EUR/USD is forming a consolidation range around 1.1528. A downside breakout is expected, with a continuation wave to 1.1404 as a near-term target, followed by a subsequent rebound to 1.1528. Technically, this scenario is confirmed by the MACD indicator – its signal line is below zero and pointing firmly downwards, reflecting sustained bearish momentum and the potential for the downtrend to persist.

On the H1 chart, the market is forming the structure of the next downward wave towards 1.1440. After reaching this level, a rebound to 1.1535 is expected, potentially extending the move to 1.1647. Technically, this scenario is confirmed by the Stochastic oscillator – its signal line is below 50 and pointing firmly downwards towards 20.

Conclusion

EUR/USD remains firmly driven by geopolitical forces, with the Middle East conflict entering its fifth week and showing no signs of de-escalation. The US dollar’s safe-haven appeal continues to dominate, while escalating tensions and rising oil prices have shifted market expectations from rate cuts to the possibility of a Fed hike later this year. Technical indicators point to further near-term downside, although this week’s US labour market data could introduce volatility. Until there is a tangible shift in the geopolitical landscape, the euro is likely to remain under pressure.

GBP/JPY Daily Outlook

Daily Pivots: (S1) 212.15; (P) 212.65; (R1) 213.08; More...

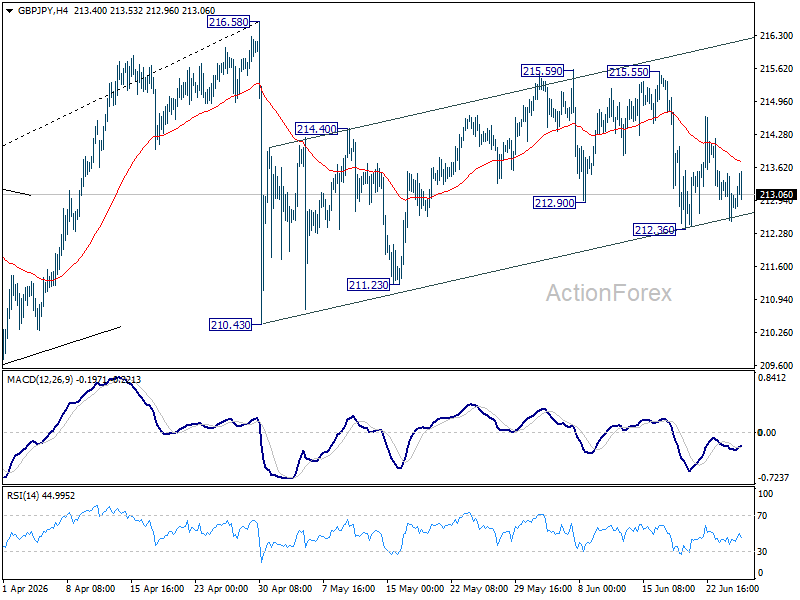
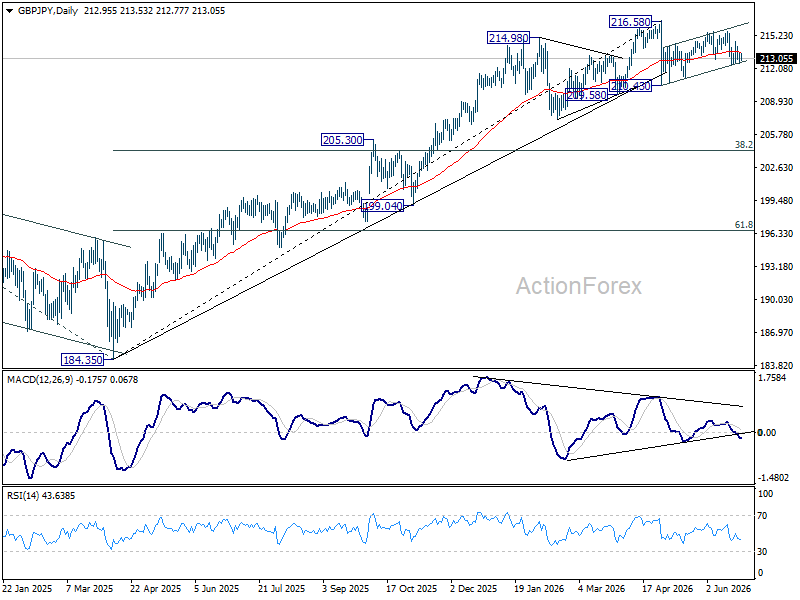
GBP/JPY falls notably today but stays above 210.77 support. Intraday bias remains neutral first. on the upside, above 213.28/9 resistance will resume the rise from 207.20 to retest 214.98 high. However, firm break of 210.77 will argue that the pattern from 214.98 has entered its third leg already. Deeper decline should then be seen to 209.15 and then 207.20.

In the bigger picture, up trend from 123.94 (2020 low) is still in progress. Firm break of 214.98 will target 61.8% projection of 148.93 (2022 low) to 208.09 (2024 high) from 184.35 at 220.90. This will remain the favored case as long as 55 W EMA (now at 203.13) holds, even in case of another deep pullback.

EUR/JPY Daily Outlook

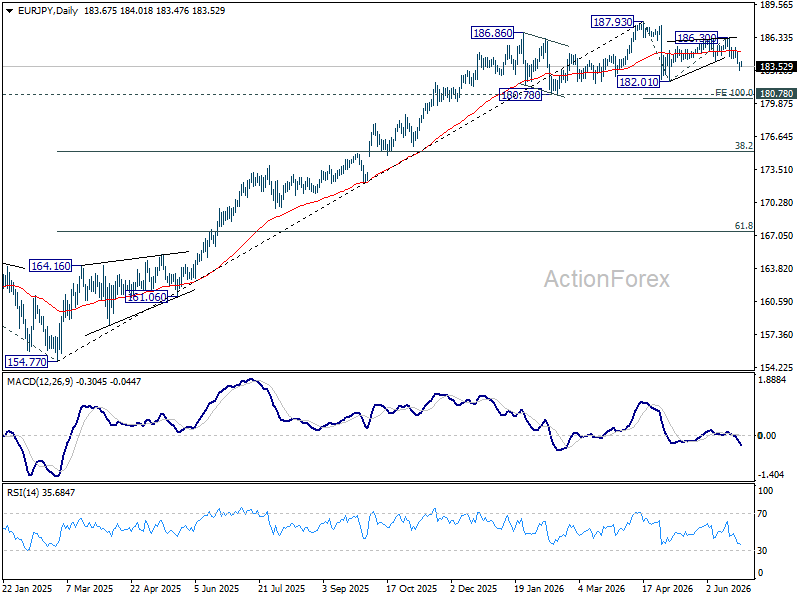
Daily Pivots: (S1) 184.00; (P) 184.34; (R1) 184.81; More...

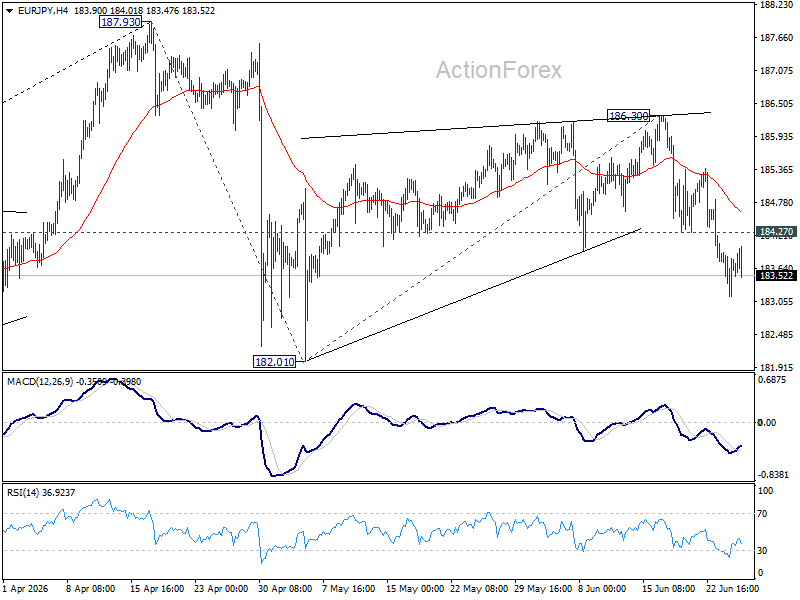
EUR/JPY falls notably today but stays above 183.17 minor support. Intraday bias remains neutral first. On the upside, break of 184.75 will resume the rise from 180.78 to retest 186.86 high. On the downside, however, below 183.17 minor support will turn bias back to the downside for 182.02 and below.

In the bigger picture, a medium term top could be in place at 186.86 and some more consolidations would be seen. Nevertheless, as long as 55 W EMA (now at 175.93) holds, the larger up trend from 114.42 (2020 low) remains intact. Firm break of 186.86 will pave the way to 78.6% projection of 124.37 (2022 low) to 175.41 (2025 high) from 154.77 at 194.88 next.

EUR/GBP Daily Outlook

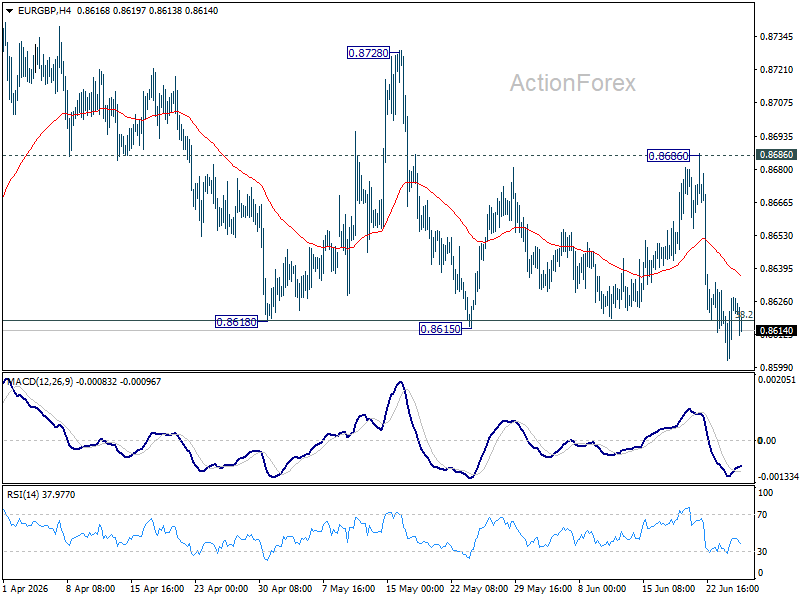
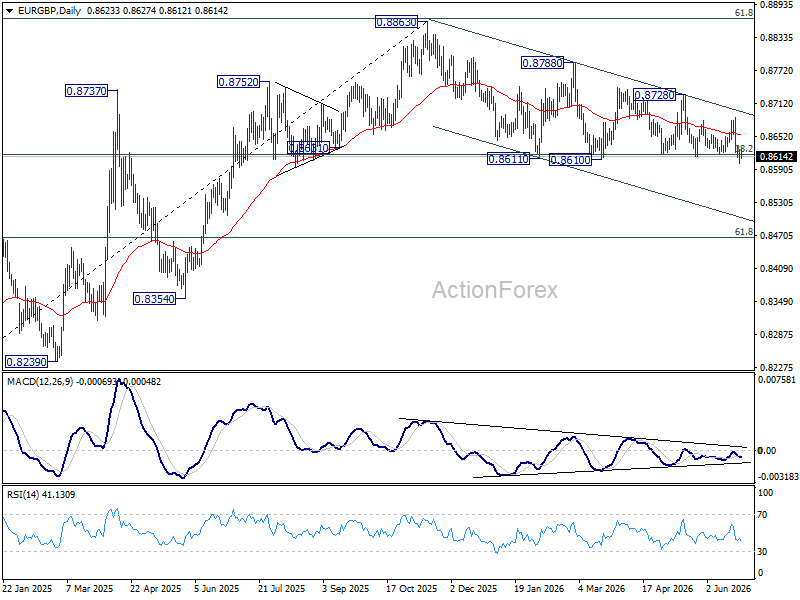
Daily Pivots: (S1) 0.8637; (P) 0.8650; (R1) 0.8664; More…

Intraday bias in EUR/GBP is mildly on the upside as rebound from 0.8610 resumes. Sustained trading above 55 D EMA (now at 0.8680) will confirm short term bottoming, and bring stronger rally back to 0.8788 resistance. However, rejection by 55 D EMA will set up another fall through 0.8611 to 100% projection of 0.8863 to 0.8611 from 0.8788 at 0.8536.

In the bigger picture, current development revived the case that whole rise from 0.8221 (2024 low) has completed at 0.8863, after rejection by 61.8% retracement of 0.9267 (2022 high) to 0.8221 at 0.8867. Sustained trading below 38.2% retracement of 0.8821 to 0.8863 at 0.8618 will confirm this case, and bring deeper fall to 61.8% retracement at 0.8466 at least. For now, medium term outlook is neutral at best as long as 0.8863 resistance holds.

EUR/AUD Daily Outlook

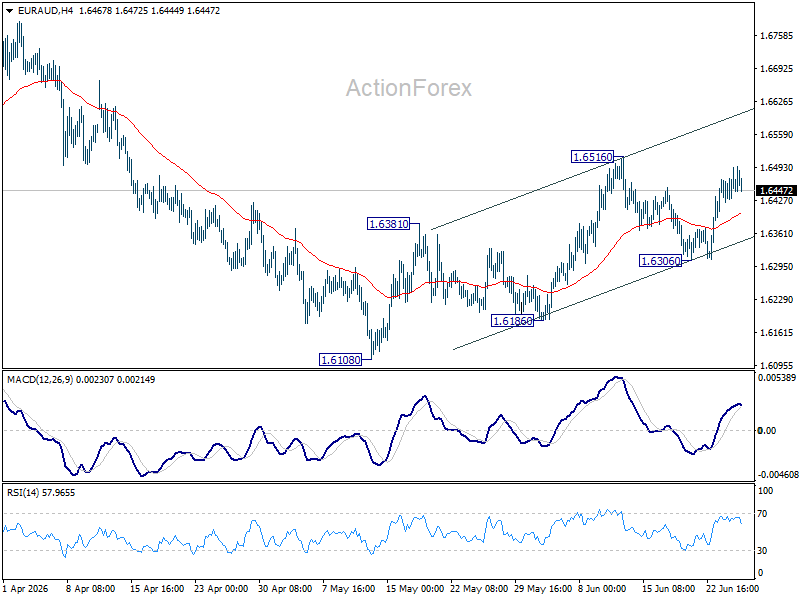
Daily Pivots: (S1) 1.6651; (P) 1.6706; (R1) 1.6796; More...

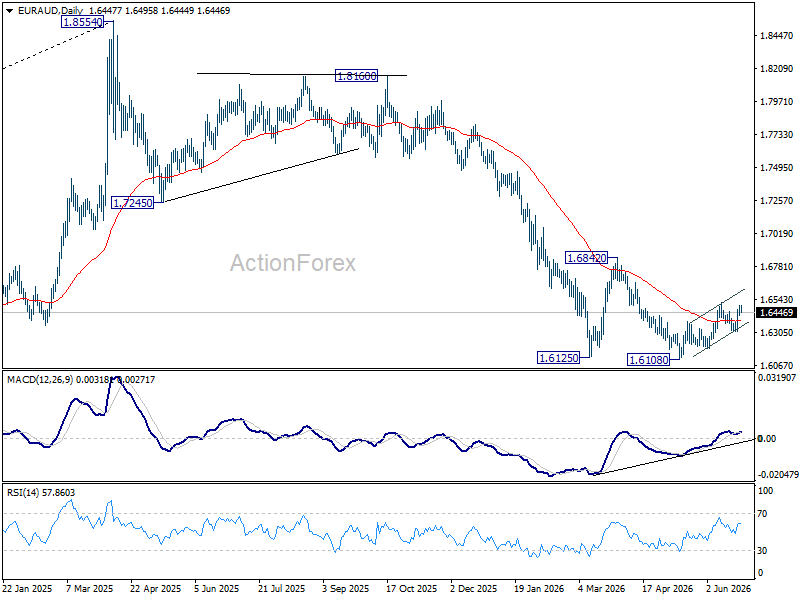
Intraday bias in EUR/AUD stays on the upside at this point. Rebound from 1.6125 short term bottom is still in progress. Sustained break of 55 D EMA (now at 0.6756) will pave the way to 38.2% retracement of 1.8554 to 1.6125 at 1.7053. On the downside, below 1.6607 minor support will turn intraday bias neutral first.
In the bigger picture, fall from 1.8554 medium term top is seen as reversing the whole up trend from 1.4281 (2022 low). Deeper decline should be seen to 61.8% retracement of 1.4281 to 1.8554 at 1.5913, which is slightly below 1.5963 structural support. Decisive break there will pave the way back to 1.4281. For now, risk will stay on the downside as long as 55 W EMA (now at 1.7226) holds, even in case of strong rebound.

Swiss KOF Barometer Drops Sharply to 96.1, Signals Broad-Based Economic Weakness

Switzerland’s KOF Economic Barometer fell sharply from 103.8 to 96.1 in March, missing expectations of 100.6 and pointing to a notable deterioration in growth momentum.

The decline reflects a broad-based slowdown, with both production and demand-side indicators weakening, suggesting that the economy is losing traction more quickly than anticipated.

The downturn is particularly evident in manufacturing and foreign demand, where indicator bundles showed a strong setback. Sub-components tracking exports, order backlogs, and the general business situation all came under pressure.

Within the producing sector, nearly all manufacturing sub-indicators deteriorated, with machinery, electrical equipment, metals, and paper industries showing pronounced weakness.

Full Swiss KOF release here.

Revised RBA Rates View: Two Extra Hikes, 4.85% Peak, Later Reversal

We now expect RBA to hike in June and August as well as May, given the longer Middle East conflict and early signs of strong second-round pass-through from fuel to other prices.

We have revised our view of the outlook for RBA policy, adding two further hikes to the near-term profile and pushing out the eventual reversal. We now expect 25bp rate hikes at the 16 June and 11 August decisions, in addition to the 25bp hike we already expected at the May meeting. The peak for the cash rate is now expected to be 4.85%.

This shift reflects the longer disruption to and slower recovery in fuel supply assumed in the revised baseline forecasts we first published on Friday afternoon, with the Strait of Hormuz essentially closed for eight weeks and traffic recovering only slowly after that. It also reflects the surprisingly rapid pass-through of higher fuel and other oil-derived product prices into other prices in Australia. We believe the RBA will respond to this pricing behaviour by tightening monetary policy by more than would have been needed absent that pass-through.

The halving of fuel excise, announced by national cabinet today, reduces the near-term outlook for headline CPI inflation, but a peak of 5.4%yr in June quarter remains likely. The announcement also does not affect prices of other oil-related products, including aviation fuel and various plastics, or any price increases from damage to gas and other production facilities in non-combatant Gulf states. Much of the second-round pass-through of prices is therefore likely to remain in place, and we continue to expect trimmed mean inflation to peak around 4%yr later this year.

The higher cash rate profile will weigh on Australia’s economic outlook. Growth will be slower, especially consumption, and the labour market will be softer. We expect unemployment to peak around 5%, somewhat higher than the 4.7% peak we flagged last week. Headline inflation will dip below 2½% by mid 2027 and will remain in the lower half of the 2–3% target range through to 2028. Trimmed mean inflation will take a little longer to decline, but will be back in the target range in 2028.

A companion note, also to be released this afternoon, fleshes out the rest of the forecasts. The revisions incorporate the assumed longer closure of the Strait of Hormuz and other supply disruptions in the Middle East flagged last week. In addition, we have updated for the new profile for the cash rate, the changes to fuel excise and some other recent events.

Despite the weaker economic outlook and potential undershoot of the inflation target implied by these revised forecasts, we think the RBA will be slow to reverse this policy tightening and risks getting behind the curve in coming years. We push out the date for rate cuts and pencil in four rate cuts, one per quarter in February, May, August and November 2028. We have low conviction about the exact timing.

The RBA will have already been spooked by the way inflation kicked up late last year after it took back some of its earlier rate hikes (though the usual lags of policy imply that the cuts were not the cause of that increase in inflation). We therefore suspect that the unwind of the current policy tightening will involve something of a “one bitten, twice shy” mentality. Second-round pass-through to other prices and costs will only increase the RBA’s reluctance to unwind the current policy tightening.

We also believe the RBA’s evolving intellectual framework will militate against an early reversal of these hikes. A supply shock such as the one the world is now facing should ordinarily be looked through to the extent possible, so long as longer-term inflation expectations remain anchored. Because it believes Australia is starting from a position of little spare capacity, though, the RBA sees the supply shocks as a potential reason to have both a restrictive stance of policy and to revise up its view of what constitutes restrictive policy.

The RBA has insisted that it retains its earlier strategy of holding onto as much of the post-pandemic employment gains as possible, subject to meeting the inflation target. While inflation was actually in the 2–3% target range for part of last year, underlying inflation did not get all the way back to the 2½% target midpoint before lifting again. This is clearly being interpreted in some quarters as inflation having been above target continuously. The Monetary Policy Board will therefore want to demonstrate its commitment to returning inflation back to target expeditiously and its willingness to do what it sees as necessary to achieve this.

As noted last week, there are risks on both sides of our revised baseline view. Iran is already letting some ships through the Strait, and it is possible that fuel supply recovers faster than we are currently assuming. It is also possible that a consensus forms domestically to resist second-round inflation, especially where the flow-on of higher costs to downstream prices could be construed as excessive. On the more inflationary side, it is possible that the war drags on longer, or domestic pass-through is stronger than we currently expect.

Australian Dollar Reckons With Global Energy Disruption Risks

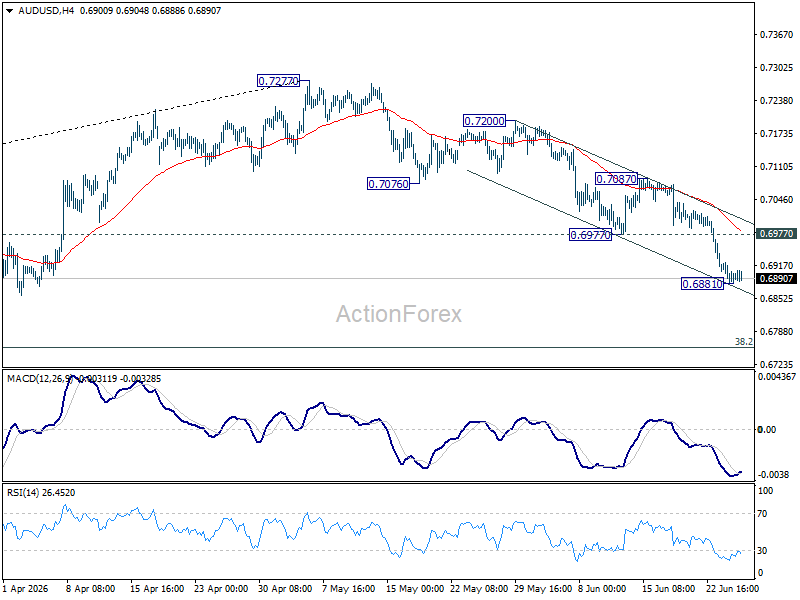
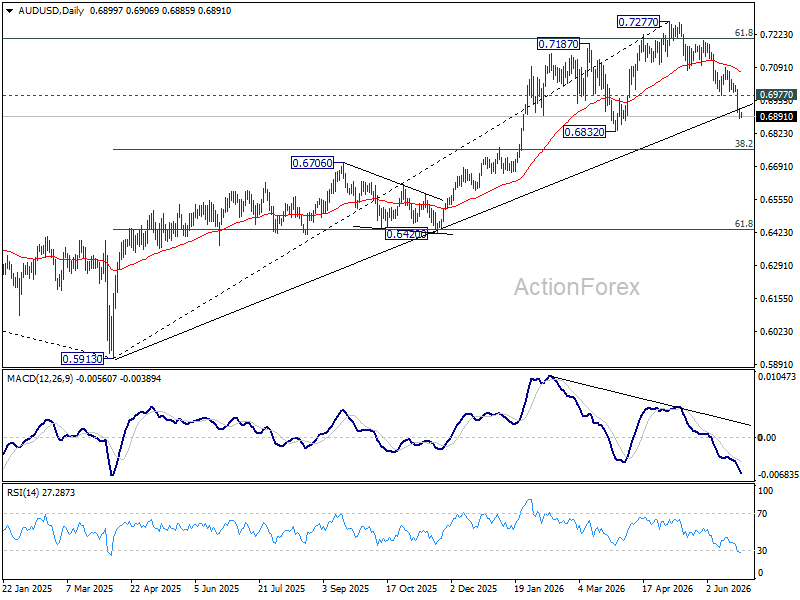
The Australian dollar finally breached the key 0.6890/6900 support area late last week, and while downside momentum hasn't accelerated meaningfully through this level, it is trading heavy. Four weeks of conflict are forcing a harder reckoning for global markets. US-Iran de-escalation looks increasingly distant, and markets are increasingly pricing in duration, not resolution. The Easter shortened week ahead calendars include the minutes from the RBA’s March meeting and US March payrolls. These releases likely have no more than a fleeting impact while war headlines dominate. The March final global PMIs and the March US ISM surveys are out too, and we should see some more glimpses of the energy supply disruption in these surveys.

The Australian dollar reckons with global energy disruption risks

The Australian dollar finally breached the key 0.6890/6900 support area late last week, and while downside momentum hasn't accelerated meaningfully through this level, it is trading heavy. Four weeks of conflict are forcing a harder reckoning for global markets. US-Iran de-escalation looks increasingly distant, and markets are increasingly pricing in duration, not resolution. The Easter shortened week ahead calendars include the minutes from the RBA’s March meeting and US March payrolls. These releases likely have no more than a fleeting impact while war headlines dominate. The March final global PMIs and the March US ISM surveys are out too, and we should see some more glimpses of the energy supply disruption in these surveys.

The Australian dollar finally breached the key 0.6890–0.6900 support area late last week. While downside momentum has not yet accelerated meaningfully through this level, the currency is trading heavy, broadly in line with risk assets.

The Australian dollar initially absorbed the opening weeks of the US–Iran conflict in stride. An energy‑led terms‑of‑trade boost and a hawkish RBA backdrop even saw AUD/USD print a new 3½+ year high of 0.7187 on 11 March.

But four weeks into the conflict, global markets are being forced into a harder reckoning. De‑escalation now looks increasingly distant, and markets are shifting from pricing a short‑lived shock and eventual resolution, to pricing duration and extended disruption.

For the Australian dollar, the “front‑loaded” benefits from higher energy prices are beginning to fade, while the “back‑loaded” global growth risks are starting to dominate. That shift was evident in trading last week, with AUD/USD sliding from around 0.7000 at the start of the week to near 0.6850 early this week.

The weekend news flow was hardly reassuring. The Washington post is reporting that the US is preparing for weeks long ground operations in Iran, while Iran-backed Houthi forces have entered the conflict. While the US continues to amass forces in the region, it is clear that the Administration is also looking for off-ramps. President Trump extended the negotiating window twice last week. An initial 48-hour ultimatum was extended to five days Monday last week and again to eight days on Friday.

But each extension landed increasingly flat with markets. The Australian dollar bounced from lows just above 0.6900 Monday last week to around 0.7050 on the five-day extension, but only managed to rise from around 0.6875 to 0.6920 on Friday’s eight-day extension. Through it all, Iran's posture has been consistent: dismissive, on its own terms and with no sign of convergence. Markets are clearly getting it - pricing duration, not resolution. A ground offensive would trigger a further risk-asset drawdown and tighter financial conditions.

While all this frames Australian dollar risks as a global growth story, there’s also Australia’s domestic fuels vulnerability to reckon with. Australia is broadly a net energy exporter, reflecting our deep endowments of coal and LNG, but we are heavy net importers of refined fuels. In 2025, more than 80% of Australia’s refined fuel consumption was imported, primarily from Asia, and the bulk of the upstream raw crude sources back to the Mideast. There are additional questions about Australia's domestic buffers - 38 days of petrol, 32 days of diesel & 29 days of jet fuel. According to the Institute of Energy Economics and Financial Analysis Australia has the smallest stockpiles of all International Energy Agency (IEA) members.

To be sure, the Australian dollar still has a 2.7% year to date gain versus the US dollar to its name - bested in the G10 only by the Norwegian Krone. But it is beginning to cede ground on a range of crosses.

AUD/EUR hit a 16-month high of 0.6199 on 11 March, but momentum has since clearly turned. The AUD/EUR cross pair has now fallen for 9 consecutive trading sessions, and opens the week at 0.5965. AUD/JPY tells a similar story - from 36 year highs (!), just shy of 114.00 on 11 March, this pair has fallen back below 110.00. AUD/NZD gave back the 1.20-handle last week too, and trades at 1.1954 to start the week.

It's all geopolitical & energy supply disruption risk for all markets right now

Brent crude has lurched and failed to clear $120/bbl twice since the US-Iran war started and starts the week on its third attempt. Energy supply disruption risks are of course keeping prices elevated with Brent Crude rising 3.3% on today's open, following the Houthis joining the war. Further, as of Monday morning, WTI and Brent prices are up 53% and 59% MTD respectively.

Precious metals however, have not fared as well. Inflationary concerns around the energy supply shock have driven global rate expectations higher in recent weeks, in turn weighing on gold and silver prices with gold reaching a low of $4099/oz last Monday - a long way away from YTD highs of $5595/oz. Further, given gold's impressive run higher in January, it seems investors have been realising gold gains to offset losses across other assets.

What was a choppy grind lower for equities in the early part of March, is giving way to more consistent downside momentum. The S&P500 is down almost 8% since the onset of the war, meanwhile the KOSPI index is down 12.9% MTD in line with broad market risk aversion.

Global bond yields have pushed higher across the board too. US 10-year bond yields have climbed +40bp over March up to 4.43% - with tariff induced good's inflation already keeping inflation above the Fed's target prior to the US-Iran war, this conflict has only exacerbated inflationary expectations with market's no longer pricing in any Fed cuts for 2026.

More early glimpses of the US-Iran war in this week's data?

Many markets will be closed this Friday and next Monday for the upcoming Easter long weekend. The global calendars are by headlined by March US nonfarm payrolls, February JOLTS data and retail sales. Final March global PMIs are also due, along with the RBA's March MPC meeting minutes.

Resilient US labour market data will likely be downplayed, given the aggressive pullback in Fed rate cut expectations of late, while a weaker jobs print likely has a more meaningful impact.

Final March global PMIs will contain more respondants since the US-Iran war began so we should expect to see more glimpses of the war's impact on pricing intentions and activity outlooks.

Local rates markets will focus on the RBA's March Meeting Minutes. Any additional colour on the 5-4 split decision will be instructive. With nearly 3 hikes already priced-in by December 2026 it would take a lot to shift pricing even further in a hawkish direction, especially after Chris Kent’s speech last week was itself seen as relatively hawkish and potentially superceding the Minutes.

All that being said, any and all data this week will likely play second fiddle to geopolitics and war headlines.

Monday

  • Fedspeak; Chair Powell & Williams

Tuesday

  • Japan Mar Tokyo CPI
  • RBA March MPB meeting minutes
  • Australia Feb Private Sector Credit
  • China Official Mar Manf. & Non-manf. PMI
  • Eurozone Mar CPI (Prelim.)
  • US Mar Conf. Board Consumer Confidence, Feb JOLTS Job Openings
  • Fedspeak; Goolsbee, Barr & Bowman

Wednesday

  • Australia Feb Building Approvals
  • China Rating dog PMI
  • Australia, Japan, Eurozone, UK, US Mar S&P Global Manf. PMI (Final)
  • US Mar ISM Manf. PMI, ADP Employment, Feb Retail Sales
  • Fedspeak; Musalem & Barr

Thursday

  • Australia Feb Trade Bal.
  • Fedspeak; Logan

Friday

  • Good Friday Public Holiday
  • China Mar Manf. & Non-manf. Ratingdog PMIs
  • US Mar Unemployment, Non-farm Payrolls, S&P Global Services PMI (Final)

Gold Holds Steady Within Fresh Range Near 4,500

  • Gold pares gains below uptrend line on softer Dollar.
  • Dip‑buyers emerge, but upside remains limited.
  • Momentum signals maintain a neutral‑to‑bearish stance.

Gold is holding steady near 4,500 on Monday, attempting to build on last session’s 2.5% rebound as a softer dollar offsets fading rate‑cut expectations. Still, the precious metal struggles to attract strong dip‑buying interest amid a bearish technical backdrop after falling more than 15% this month.

Price action remains range‑bound in a bearish consolidation phase below the medium‑term ascending trendline and the 100‑day SMA. Momentum indicators reinforce this hesitation – the MACD remains in negative territory, showing persistent downward pressure, while the RSI is flatlining just above oversold levels, suggesting bearish momentum is easing but not reversing. Last week’s rebound from the 200‑day SMA near 4,000 therefore remains on fragile footing.

Initial resistance sits at 4,600, the 38.2% Fibonacci retracement of the March 2-23 pullback, aligning with the 100‑day SMA. A break above could open the way to the 50% Fibonacci level at 4,758, followed by the 20‑day SMA, currently in a bearish crossover with the 50-day SMA, near 4,850.

Support emerges near 4,375, where recent lows have held, followed by deeper support around 4,300 if sellers regain control. Below that, the 200‑day SMA in the 4,000-4,150 zone remains critical.

Summing up, Gold has snapped a three‑week losing streak, but the modest recovery from multi‑month lows remains volatile. A sustained move back above the uptrend line is needed to shift the precious metal onto more stable ground.