Sample Category Title
Germany’s Ifo Business Climate Rises as Firms Hope for Geopolitical Relief
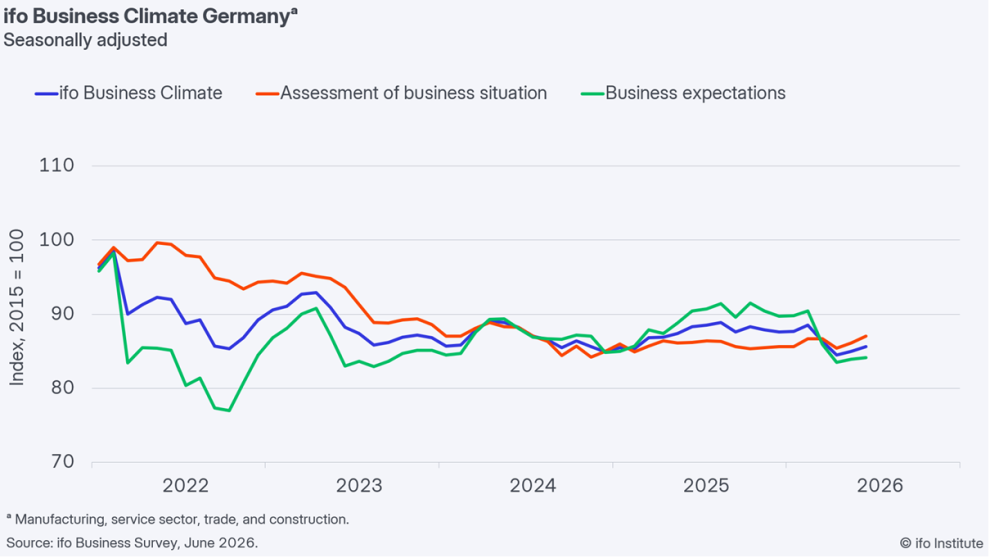
German business sentiment improved modestly in June, with the Ifo Business Climate Index rising from 84.9 to 85.6, matching expectations and extending its gradual recovery. The improvement was driven primarily by stronger assessments of current conditions, with the Current Assessment Index rising from 86.1 to 87.0, beating expectations. However, the Expectations Index edged up only slightly from 83.8 to 84.1, falling short of forecasts and suggesting that confidence about the future remains cautious.
According to Ifo, companies are becoming less concerned about uncertainty and are increasingly hoping for an easing of geopolitical tensions. Manufacturing provided some encouraging signs, with expectations improving noticeably. However, firms reported that new orders continued to decline and assessments of current conditions softened slightly. In services, business sentiment improved as companies became more satisfied with current activity levels, though expectations remained largely unchanged and skepticism persisted across much of the sector.
The recovery picture remained mixed across the broader economy. Trade companies reported improvements in both current conditions and expectations, but Ifo noted that the path back to a stronger recovery remains long. Construction sentiment also improved as firms became less pessimistic about the future, although many businesses continued to complain about weak order books.
Overall, the survey suggests that Germany's economy is stabilizing as geopolitical concerns ease, but demand remains too weak to support a stronger or more broad-based recovery.
| Indicator | May | June | Expectation |
|---|---|---|---|
| Ifo Business Climate | 84.9 | 85.6 | 85.6 |
| Current Assessment | 86.1 | 87.0 | 86.0 |
| Expectations | 83.8 | 84.1 | 85.0 |
Ueda Reinforces Hawkish BoJ Message, Says More Rate Hikes Likely
Bank of Japan Governor Kazuo Ueda reinforced the central bank's tightening bias on Wednesday, signaling that further rate hikes remain likely as inflation risks continue to build. In remarks delivered by Deputy Governor Ryozo Himino while Ueda recovers from a recent hospitalization, the governor said that "with underlying inflation moving toward 2% and financial conditions remaining accommodative, we expect to continue increasing the interest rate and adjusting the degree of monetary accommodation in response to economic activity, prices and financial conditions."
The comments closely echoed the message delivered at last week's policy meeting, where the BoJ raised its benchmark interest rate to 1.00%, the highest level since 1995. Ueda also reiterated concerns that inflation could overshoot the Bank's target, particularly after the recent surge in energy prices linked to the conflict in the Middle East. While oil prices have retreated following progress toward peace, policymakers continue to see risks that higher costs could spread more broadly through the economy.
Ueda emphasized that the timing and pace of future adjustments would depend on incoming data and external developments, including the aftermath of the Iran conflict. Nevertheless, the overall message remained firmly hawkish. His remarks come just hours after the BoJ's Summary of Opinions revealed broad support for additional tightening, with several policymakers discussing the need to move rates closer to a neutral level over time. Together, the comments reinforce market expectations that last week's hike was not the end of the normalization cycle.
EURCHF Wave Analysis
EURCHF: ⬇️ Sell
– EURCHF reversed from resistance zone
– Likely to fall to support level 0.9150
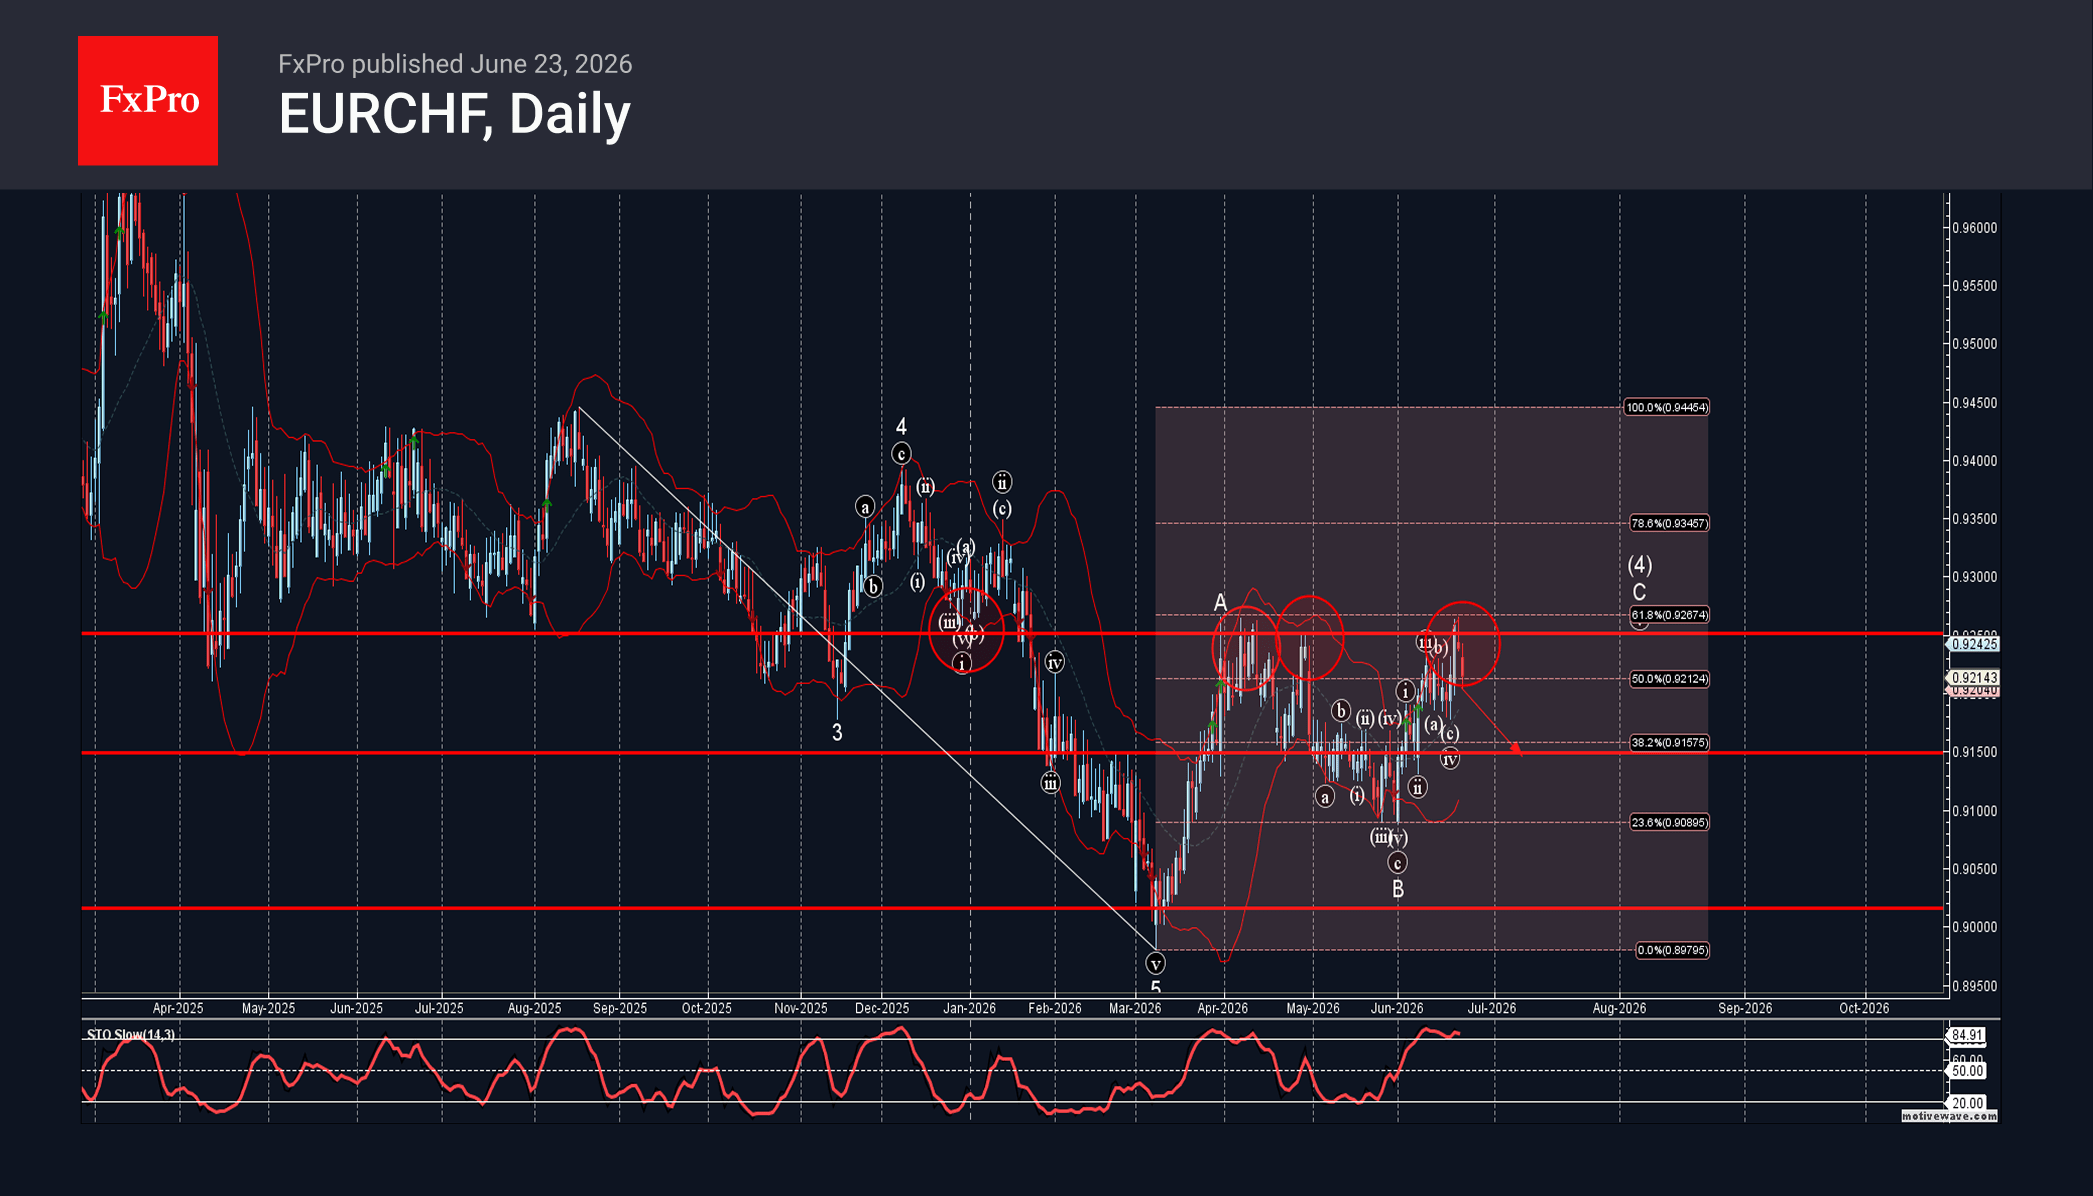
EURCHF currency pair recently reversed down from the resistance zone between the key resistance level 0.92500 (which has been reversing the price from the start of April, as can be seen below), upper daily Bollinger Band and the 61.8% Fibonacci correction of the downward impulse from August.
The downward reversal from this resistance zone accelerated stopped the earlier C-wave of the ABC correction (4) from the start of March.
Given the strong daily downtrend and the bearish euro sentiment seen today, EURCHF currency pair can be expected to fall further to the next support level 0.9150.
Sunrise Market Commentary
Markets
Close to consensus and partially irrelevant; yesterday's European flash PMIs had little impact on markets. An improvement in the services sector lifted the composite indicator to a still below-neutral 49.5. But most of the responses were collected prior to the signing of the US-Iran agreement June 17, setting the stage for upward revisions to the final PMI's due early July. The price gauges meanwhile have come off their recent multi-year highs. While comforting news for the ECB, its chief economist was cautious. Appearing before the European Parliament yesterday, Lane warned that inflation risks being above the 2% target in the medium-term for quite some time, possibly into the first half of 2027. In a speech last week, he projected 3%+ readings for the remainder of the year. He defended the June rate hike by saying that "even in the milder scenario considered by Eurosystem staff in preparation in June, inflation is set to remain above target for long enough to warrant a measured response." His slide pack shows energy prices (oil and gas combined) now hovering between the ECB's milder and base scenario. Euro area money markets hold expectations for another hike to 2.5% later this year with views unaltered by the PMIs. German bunds slightly outperformed US Treasuries. Yields fell 2.1-3.6 bps but finished off the lows. US yields lost 0.3-2.8 bps. Core bonds were mainly supported by dented risk sentiment. Stocks slid further on both sides of the Atlantic. Tech in particular still has a target on its back with investors harvesting strong YtD gains going into the close of the first half of the year. Industrials and small caps seem better protected. Currency markets finally look unchained. After months of stoic trading we're seeing technical breaks occurring in many dollar pairs. The USD turned into the market's darling ever since Warsh at the June Fed policy meeting took a big step in restoring the institution's credibility (ie. political independence). Risk premia that previously weighed the greenback down are now going in reverse. Add a solid economy & labour market, and you have EUR/USD losing the critical 1.1392 support area as of yesterday. The pair is currently trading around 1.1370 with next support zones appearing in the 1.12 and then 1.11 area. DXY pierced through 101.138 resistance to fill bids at the highest level since May 2025. USD/JPY's ascent halted near multidecade highs just south of 162. Investors are wary for possible interventions. Sterling is edging ever closer to EUR/GBP 0.86 support in what is turning into a GBP bullish closing triangle. Burnham as next PM is reducing political uncertainty in the short run even though he has yet to unfold his plans. Losing EUR/GBP 0.86 means a return to 0.8468 (61.8% retracement on the 2024-2025 rally) from a technical point of view. With the eco calendar empty today we expect the technicals to dominate trading. The risk backdrop remains an important market driver as well. Further repositioning and rotation could occur as we head into the quarterly close.
News & Views
Australian headline inflation fell more than expected in May (-0.7% M/M) with the Y/Y-reading unexpectedly slowing from 4.2% to 4%. On a monthly basis, automotive fuel prices fell by 11.9%, after falling 7% in April. These falls include the impact of the halving of the fuel excise and lower world oil prices. As such volatile items often blur the inflation picture, the Reserve Bank of Australia tends to look at the trimmed mean CPI measure which excludes items with largest price swings in both directions. This core gauge accelerated to 0.4% M/M in May and rose from 3.4% Y/Y to 3.6% Y/Y (highest since monthly series started in April of last year). The RBA has a 2-3% inflation target. The largest contributor to annual inflation was housing, which rose by 6.5%. This was followed by a 3.3% rise in food and non-alcoholic beverages and a 3.3% rise in transport. The Aussie dollar didn't respond to the higher core CPI. AUD/USD yesterday lost the 0.70-barrier on genuine dollar strength. From a technical point of view, support stands at 0.6833 (March low).
Minutes of the June Bank of Japan meeting affirmed the central bank's tightening stance: "As for the future conduct of monetary policy, given that underlying CPI inflation has been approaching 2% and financial conditions have been accommodative, it is appropriate for the bank to continue to raise the policy interest rate". Japanese money markets currently discount a move from 1% to 1.25% by the December meeting. Japanese services price inflation, also published this morning, remained unchanged at an upwardly revised 3.3% Y/Y in May. The Japanese yen continues to hover just below the 2024 top of USD/JPY 161.95 as USD strength is currently balanced by verbal intervention threats by Japanese officials. Risks of a break higher are rising which would lift the pair to strongest levels since 1986.
Dax 40: Consolidation Amid Technology Sell-Off
A wave of selling in the technology sector that emerged earlier this week has weighed on European equities. The trigger was investor concern over the profitability of large-scale debt-funded investments by major US tech companies in AI infrastructure. The Nasdaq and S&P 500 fell to their lowest levels in more than a week, with semiconductor manufacturers bearing the brunt of the decline.
In Germany, Infineon Technologies (-5.86%), Siemens Energy (-3.93%) and Vonovia (-3.21%) were among the worst performers, while SAP and Airbus ended the session in positive territory, gaining around 2% each. Geopolitical factors also remain in the background: a memorandum signed in June between the United States and Iran has yet to remove uncertainty, with implementation of the agreement still subject to ongoing negotiations.
Technical picture
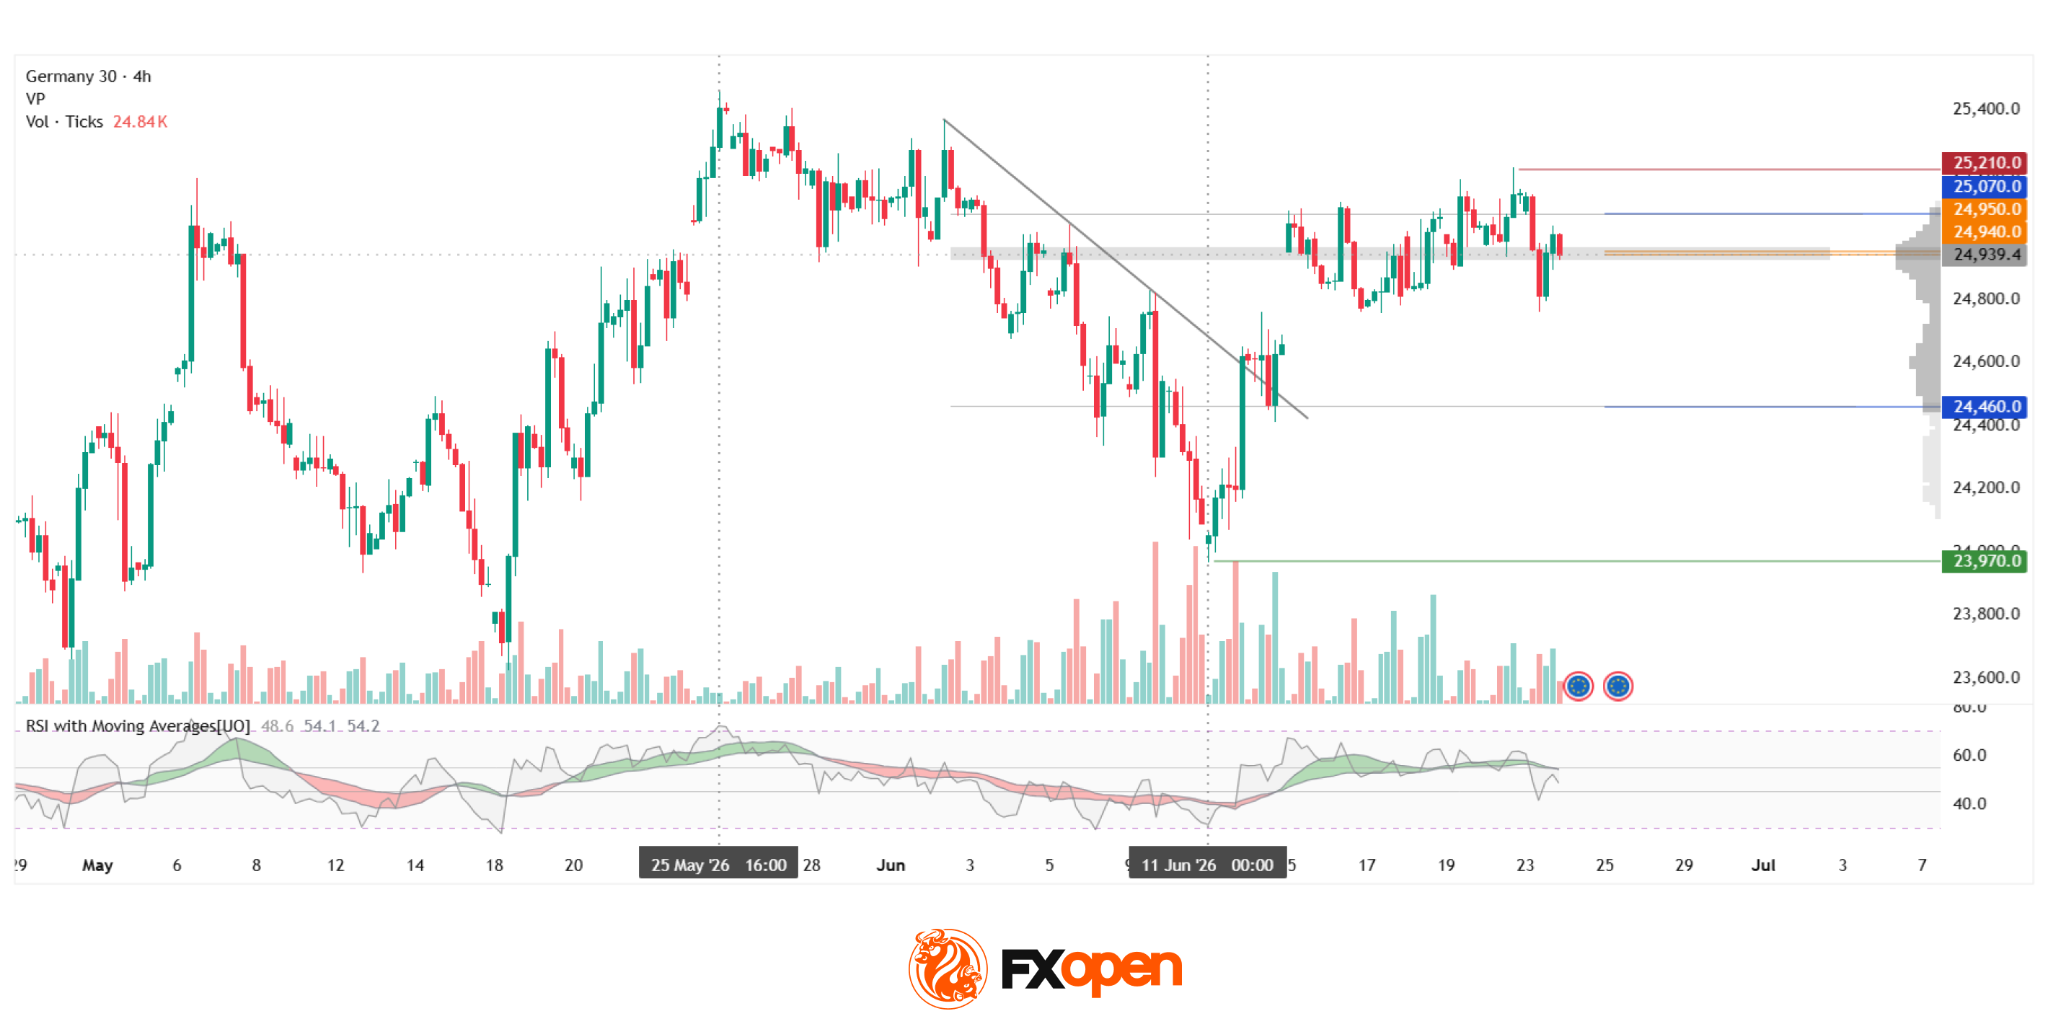
On the H4 chart of the DAX 40 index (GDAXIm on FXOpen), after peaking around 25,450 at the end of May, price declined towards the 23,970 area, forming a downward trend structure. Following an attempted breakout of the downtrend and a gap on 15 June, the index moved into a sideways range, forming a POC zone at 24,940–24,950 and an upper boundary of the current profile at 25,070, with price now trading between these levels.
The nearest resistance is located around 25,210, which could cap the market if the upper boundary of the profile is breached. Support is seen in the 23,970 area, which could be reached if the lower boundary at 24,460 is broken. Volume remains moderate, confirming the consolidation phase. The RSI and moving averages are at 48, 54 and 54 respectively; the oscillator is below its moving averages, while the averages are converging towards neutral levels, indicating a lack of clear momentum within the current range.
Summary
Pressure on the DAX 40 is driven by a global reassessment of AI infrastructure valuations, which has triggered a sell-off in the semiconductor sector worldwide, including German equities. Price has returned to a balance area after the rebound, while the RSI remaining below its moving averages signals a lack of directional momentum on either side.
Trade global index CFDs with zero commission and tight spreads (additional fees may apply). Open your FXOpen account now or learn more about trading index CFDs with FXOpen.
This article represents the opinion of the Companies operating under the FXOpen brand only. It is not to be construed as an offer, solicitation, or recommendation with respect to products and services provided by the Companies operating under the FXOpen brand, nor is it to be considered financial advice.
Euro Hits Fresh Yearly Lows Amid Dovish ECB Signals
The euro remains under pressure following weak macroeconomic data from the euro area and fresh signals that the European Central Bank is prepared to maintain a more accommodative monetary policy stance. Data released yesterday pointed to a deterioration in business activity across the eurozone’s largest economies. Weak readings from Germany and France heightened concerns about the pace of the region’s economic recovery.
Additional pressure came from comments by ECB President Christine Lagarde, which markets interpreted as more dovish than recent remarks from Federal Reserve officials. As a result, investors continue to scale back expectations for further policy tightening by the ECB.
Market participants will also focus today on Germany’s Ifo Business Climate Index. Forecasts suggest the headline index may rise to 85.6 from 84.9 previously, while the Expectations Index is expected to increase to 85.0 from 83.8. Although an improvement in business sentiment could provide temporary support for the euro, investors are likely to assess the data against the broader backdrop of slowing economic activity across the euro area. Even if the figures improve, markets may view them as insufficient to alter the prevailing picture of economic cooling.
EUR/USD
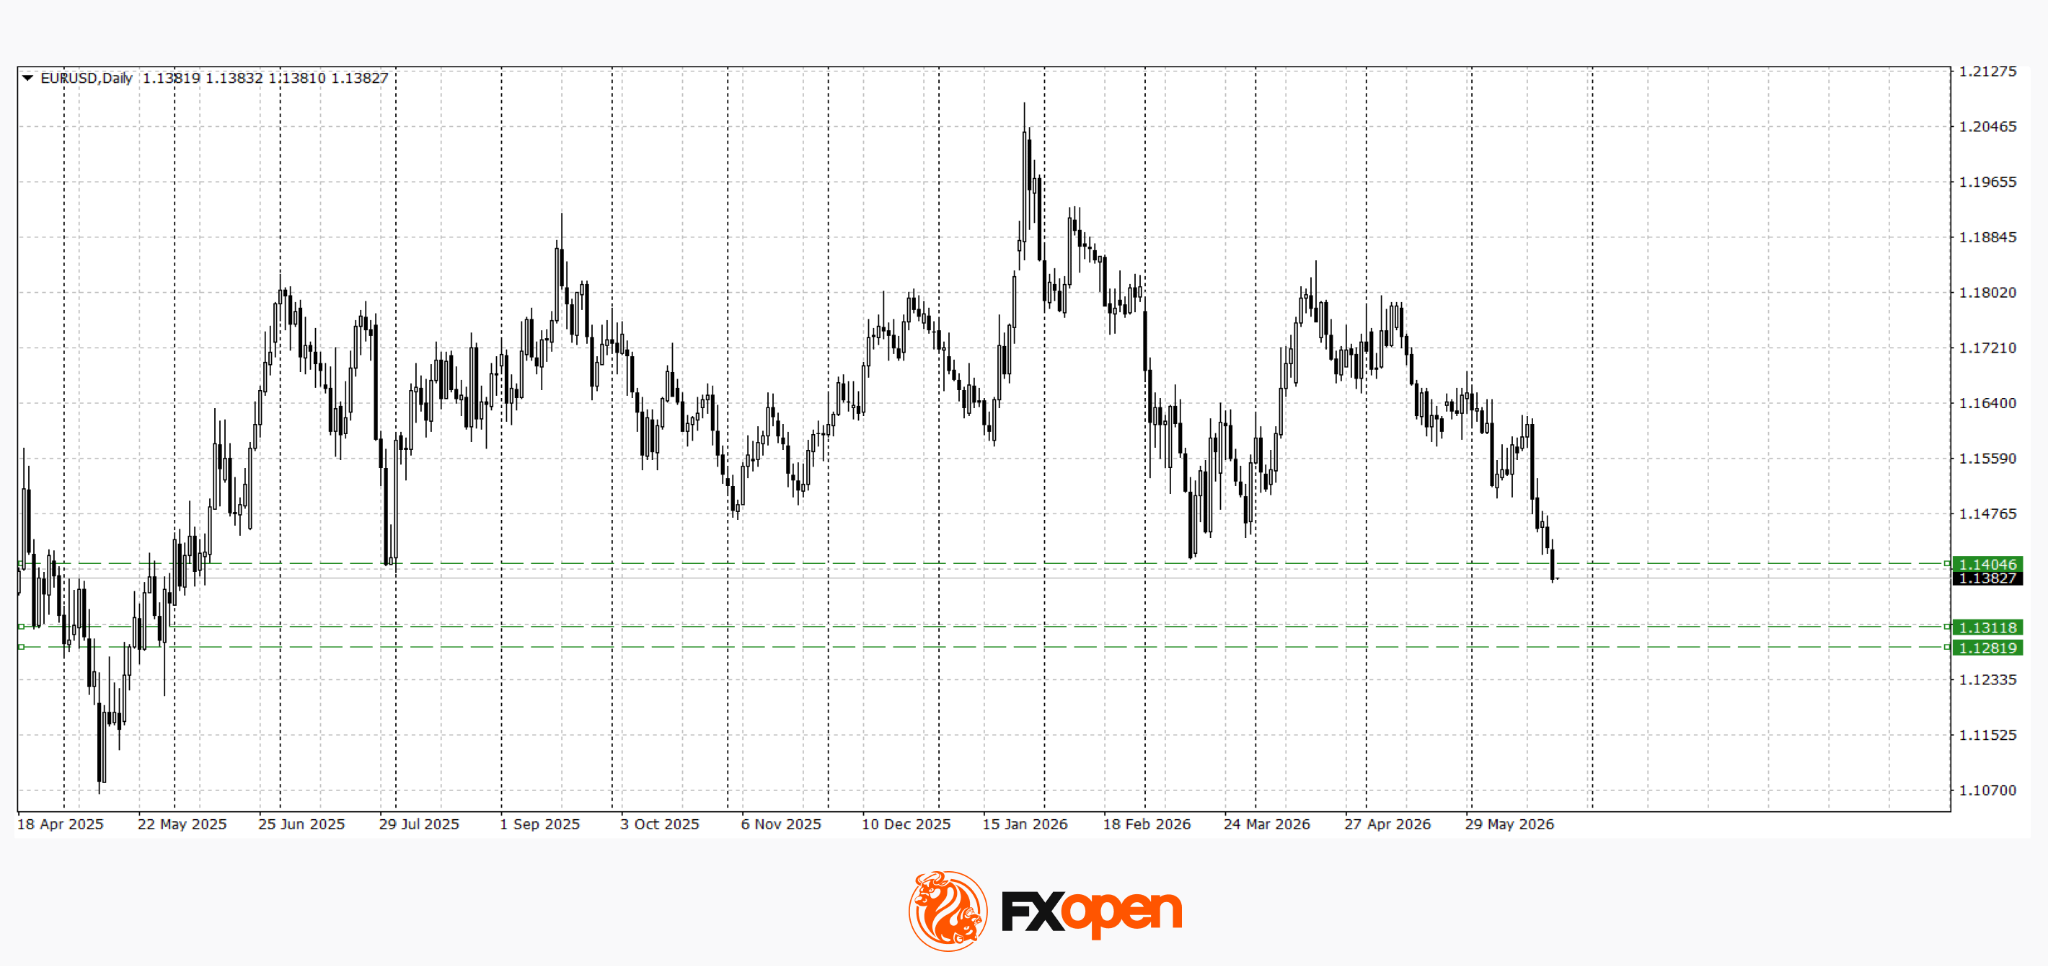
Yesterday, sellers managed to break key support at 1.1400, pushing the pair to a fresh low for the year. A sustained move below 1.1400 could pave the way for a further decline towards the next support zone at 1.1310–1.1280. A move back above 1.1400–1.1420 would be the first indication that bearish pressure is easing.
Key events for EUR/USD:
- Today at 11:00 (GMT+3): Germany Ifo Business Climate Index;
- Today at 12:00 (GMT+3): speech by Bundesbank President Joachim Nagel;
- Today at 17:00 (GMT+3): US New Home Sales.
EUR/CAD
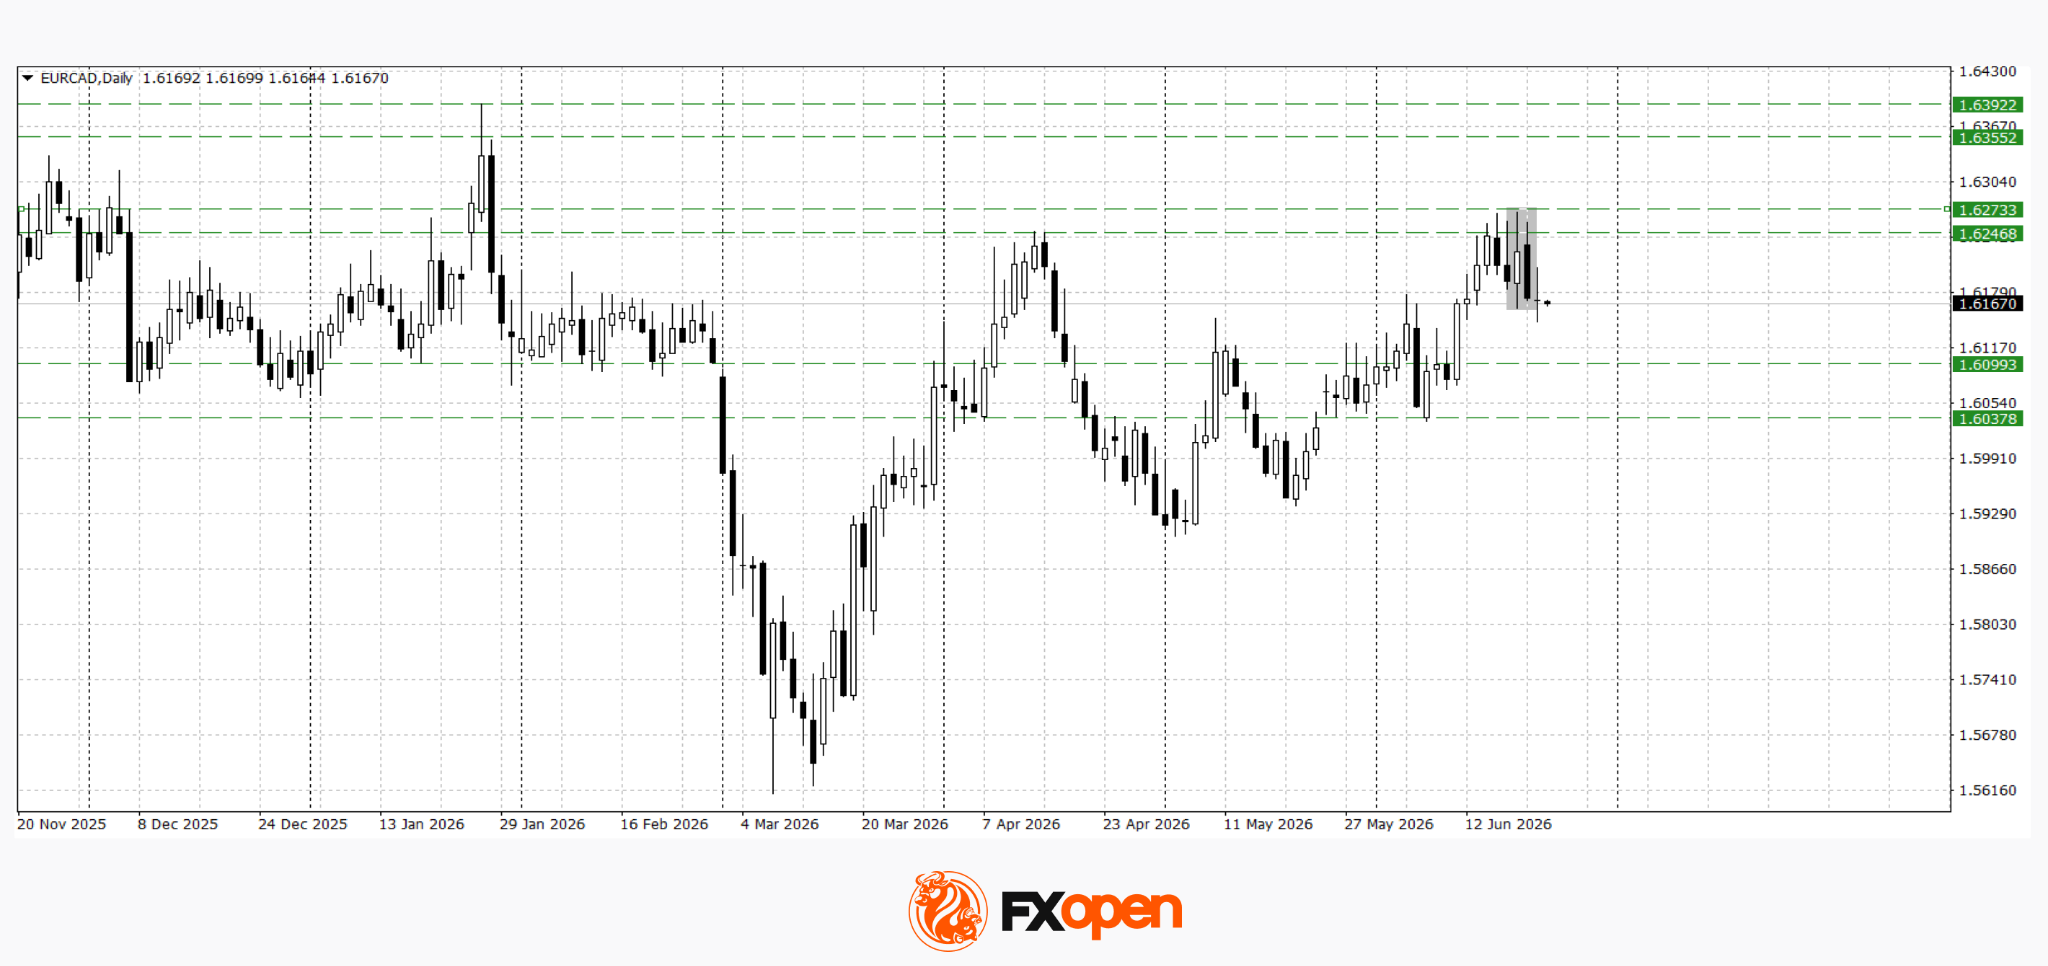
EUR/CAD has retreated from this year’s highs near 1.6200. Technical analysis suggests the pair may decline towards the 1.6100–1.6030 area, as a bearish engulfing pattern has formed on the daily timeframe. Conversely, a break above resistance at 1.6270 could trigger a resumption of the uptrend towards 1.6350–1.6400.
Key events for EUR/CAD:
- Today at 14:15 (GMT+3): speech by Bank of Canada Senior Deputy Governor Carolyn Rogers;
- Today at 15:30 (GMT+3): Canadian Manufacturing Sales;
- Today at 17:30 (GMT+3): US Crude Oil Inventories.
Overall, pressure on the euro persists amid weak eurozone data and diverging monetary policy expectations between the ECB and the Federal Reserve. If the German data fail to improve investor sentiment, both EUR/USD and EUR/CAD may extend their declines. At the same time, stronger European data or a weaker US dollar could trigger a corrective recovery in the single currency.
Trade over 50 forex markets 24 hours a day with FXOpen. Take advantage of low commissions, deep liquidity, and spreads from 0.0 pips (additional fees may apply). Open your FXOpen account now or learn more about trading forex with FXOpen.
This article represents the opinion of the Companies operating under the FXOpen brand only. It is not to be construed as an offer, solicitation, or recommendation with respect to products and services provided by the Companies operating under the FXOpen brand, nor is it to be considered financial advice.
Riksbank Minutes Expected to Reveal Division
In focus today
In Sweden, today's main focus will be on the Riksbank minutes. Last week, the Riksbank left the policy rate unchanged at 1.75% and raised the rate path. In May, the board was split, and our best assessment is that it remains divided. Therefore, the minutes will be particularly interesting to see how each member views the outlook for policy given the new information.
In Germany, the Ifo indicator for June is released. Yesterday's PMI report surprised significantly on the downside for the services sector. It will be interesting to see if the Ifo indicator shows the same picture of the German economy, which would be worrying.
In Norway, the latest figures from the Norwegian Labour Force Survey are released. Last month the unemployment rate came in at 4.8%. In general, weaker labour market conditions in Norway could result in a lower policy rate than indicated by the Norges Bank MPR rate path.
Economic and market news
What happened overnight
In the US, the Senate has passed a war powers resolution by 50-48 seeking to limit President Trump's authority to resume military action against Iran without Congressional approval. Although its legal force is disputed, the vote signals growing bipartisan scepticism over the administration's Iran policy.
What happened yesterday
Euro area PMIs in June surprised on the upside with the composite PMI rising to 49.5 (cons.: 49.2, prior: 48.5). Manufacturing was slightly weaker at 51.3 (cons.: 51.6, prior: 51.6) while services surprised on the topside at 48.9 (cons.: 48.6, prior: 47.7). The decline in manufacturing was due to delivery times falling while both new orders, employment and output rose, which makes the manufacturing print slightly stronger than what face value suggests. The positive surprise in services comes after Germany surprised significantly to the downside which suggests that Southern Europe have seen decent increases.
In the UK, PMIs were weaker than expected with the service sector contracting at the fastest rate in more than 3 years, dragging the composite index slightly lower to 49.4 (cons.: 50.0, May: 49.7). Price indexes edged lower, but continue at elevated levels, keeping the Bank of England alert despite the lost economic momentum through Q2.
In the US, June PMIs surprised on the upside. Manufacturing rose to 55.7 from 55.1 in May (cons.: 54.6), the strongest reading since 2022, while services increased to 51.3 from 50.7 (cons.: 51.1). Price pressures eased yet are still elevated. Market reaction was limited, with investor focus remaining on tech stocks.
In Denmark, overall business confidence has eased, and the indicator has fallen to 101.0 from 104.1 in May, the lowest level in more than two years but still just above the historical average of 100. Businesses still expect to increase employment in the coming months, although the pace appears to be slowing.
The National Bank of Hungary decided to cut rates by 25bp to 6.00%, following signals of easing at its last meeting.
Equities: Equity markets sold off sharply yesterday, driven by one sector in particular. Global tech was down more than 4%. Yet even with the broader equity market down almost 2%, four sectors still ended higher, with consumer staples and healthcare both up more than 1%.
That says a lot about the current setup. The underlying growth and earnings picture remains solid, and investors are rotating across equities rather than engaging in a broad based sell off. That said, when a sector of this size can fall 4% in a single session without major sector specific news, we also know where we are in the cycle.
We keep coming back to the fundamental picture. Earnings momentum is still moving in the right direction, and valuation is not a challenge.
What is extreme is positioning and the momentum we have seen since late March. That means we should expect setbacks when markets have moved this fast, and we should expect more of them.
It does not change our view that the broader direction typically remains positive as long as the fundamental backdrop stays this strong.
This morning, Asia is more mixed. Most markets are higher, led by South Korea, while Japan is dragging lower.
US futures are broadly higher, while European futures are slightly lower.
FI and FX: The USD appreciated against the rest of G10 yesterday, which sent EUR/USD below 1.14, USD/SEK above 9.70 and USD/NOK above 9.80. Meanwhile, equities fell, VIX rose and oil prices have also dropped back to more normal levels, with Brent crude falling below USD77/bbl yesterday. Global yields edged lower across tenors.
Tech Selloff Deepens as US Dollar Strength Pressures Global Markets
Key takeaways
- The correction in AI and semiconductor stocks has broadened beyond isolated names into a wider valuation reset. Investors are increasingly questioning whether the pace of AI-related capital expenditure can continue to justify current earnings multiples, triggering profit-taking across technology and hardware leaders.
- The US dollar has emerged as the dominant macro driver. The breakout of the Dollar Index above the key 101.00 level, supported by elevated Treasury yields and a higher-for-longer Fed narrative, is exerting pressure on risk assets, commodities, and Asia-Pacific currencies.
- The unwinding of the Middle East war premium continues to accelerate. Iranian export waivers and normalised shipping flows through the Strait of Hormuz have driven oil prices to multi-month lows, creating a favourable backdrop for energy-importing economies but weighing heavily on energy producers.
- Chart of the day: AUD/USD medium-term downtrend remains intact; intraday minor corrective rebound may be exhausted below the 0.6960 key short-term resistance.
Chart of the day - Potential minor bounce in AUD/USD before new bearish leg
Fig. 1: AUD/USD minor trend as of 24 Jun 2026 (Source: TradingView). The information presented is historical information, and past performance is not indicative of future performance.
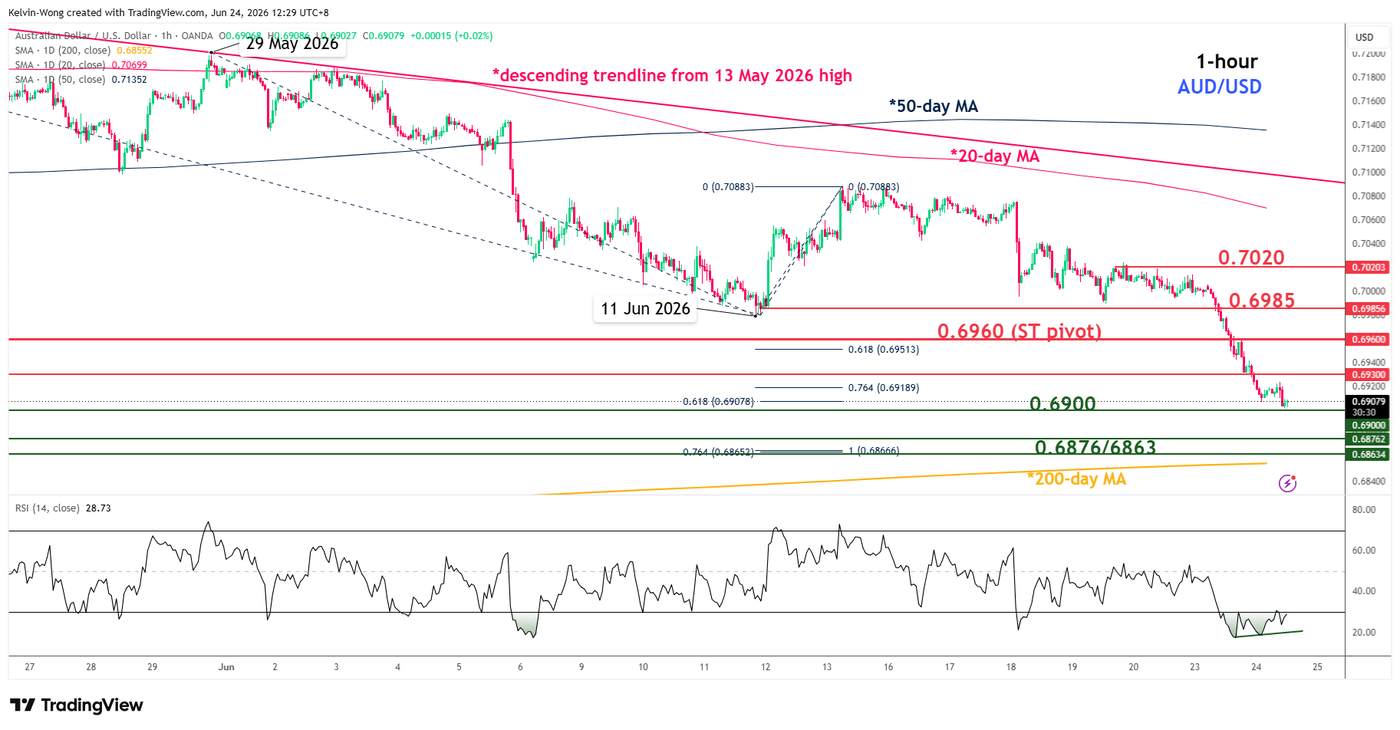
The AUD/USD has continued its medium-term downward spiral since the 13 May 2026 high of 0.7272 and extended its losses on Tuesday, 23 June by 1.2% to settle at a 2-month low of 0.6916 on the backdrop of rising risk aversion (see Fig. 1).
Tuesday’s steep intraday drop has led the hourly RSI momentum indicator to flash a bullish divergence in its oversold region, suggesting an imminent minor corrective/dead cat bounce.
Watch the 0.6960 key short-term pivotal resistance on the AUD/USD for the potential minor corrective rebound to get exhausted close to below it, with the next immediate supports coming in at 0.6900 and 0.6876/6863 (also close to the 200-day moving average).
On the other hand, a clearance and an hourly close above 0.6960 invalidates the bearish tone for an extension of the minor corrective rebound towards the next intermediate resistances at 0.6985 and 0.7020.
Top macro headlines
- Global tech selloff rattles Wall Street as valuation pressures broaden: The tech-heavy Nasdaq 100 plummeted 3.3 %, and the S&P 500 slipped 0.37% as investors aggressively locked in profits across semiconductor and hardware heavyweights, also dragged down by weakness in semiconductor-centric South Korea’s KOSPI (-10%). The widespread selloff reflected mounting institutional anxiety regarding the sustainability of elevated capital expenditure trends relative to intermediate-term AI monetisation timelines, forcing a broad risk-off rotation into defensive value stocks.
- Continuation of US Dollar Index positive follow-through after last week’s major range bullish breakout, cleared above 101.00: The greenback caught a ferocious safe-haven bid across global cash sessions, fracturing long-term technical and structural consolidation bands to hover near 101.40. The breakout was fueled by widening global interest-rate differentials, persistent core inflation revisions out of Europe, and broader defensive positioning amid systemic volatility in equities.
- Brent Crude sinks under $80 as operationalisation of Iranian waivers unwinds war premium: Front-month Brent crude oil futures extended losses by 1.5% to settle at $76.73/bbl on Tuesday, 23 June. The downward pressure accelerated as the US Treasury’s 60-day temporary export waivers for Iranian petroleum officially began shifting physical maritime flows, significantly alleviating immediate shipping anxieties in the Strait of Hormuz and triggering systematic trend-follower bearish liquidations.
Key macro themes
- The broadening valuation discipline across high-beta growth sectors: The simultaneous correction in megacap chip equities and public-market newcomer SpaceX (SPCX) signals an organic shift in institutional risk appetite. Rather than blindly funding continuous, open-ended capital expenditure pools, global asset allocators are beginning to demand clearer visibility on structural intermediate net income generation. With the cost of equity capital structurally elevated due to sticky short-end yields, growth multiples are encountering an organic compression phase, transitioning the macro environment away from pure thematic momentum toward strict balance-sheet discipline.
- The disruption of sovereign supply waves in short-duration fixed income: The upward repricing of the US 2-year Treasury yield demonstrates the compounding friction of sovereign debt expansion on the depth of institutional liquidity. As the US Treasury forces rolling multi-billion-dollar auctions onto primary dealers, market participants are extracting a structurally higher baseline term premium. This dynamic prevents long-duration yields from falling significantly, effectively introducing a persistent floor under global corporate borrowing costs and blunting the impact of any potential central bank policy easing cycles.
- Geopolitical risk escalation and commodity hedge liquidations: The swift operationalisation of the US-Iran 60-day implementation roadmap underscores the inherent fragility of geopolitical war premiums within the energy complex. Systematic macro funds and options desks that had built extensive long crude hedges are rapidly liquidating exposures as physical maritime telemetry confirms normalised merchant shipping flows through the critical Strait of Hormuz bottleneck. This injection of Persian Gulf oil supply is accelerating near-term energy cost deflation, offering localised breathing room to heavy energy-importing regions.
Global markets impact (last 24 hours)
Equities: The Nasdaq 100 plummeted 3.3% to close under pressure, while the S&P 500 slid 1.4% to finish at 7,365, closing below the 20-day moving average. The Dow Jones Industrial Average bucked the broader risk-off trend, closed almost unchanged on Tuesday, 23 June, supported by defensive health care stocks.
Fixed Income: Selling pressure dominated short-duration curves globally. The 2-year US Treasury yield remained firm at 4.2%, while the 10-year US Treasury yield traded above its 20-day moving average (4.49%) for the second consecutive session, settling at 4.50%.
FX: The US Dollar Index (DXY) staged an aggressive technical breakout past long-term range barriers amid risk aversion in global equities. The risk-sensitive Australian dollar dropped by 1.2%, hitting a 2-month low of 0.6916 against the greenback.
The British pound also wobbled, trading down 0.4% to settle at 1.3203 on Tuesday, looking to retest a 3-month low of 1.3160 amid waiting for clarity on the UK’s new Prime Minister’s policies. The Japanese yen continued to hover near the 161.95 multi-decade intervention threshold.
Commodities: Energy markets suffered extensive liquidation, with front-month Brent and WTI crude futures extending losses by 1.5% and 1.4% to settle at $76.73/bbl and $73.05/bbl on Tuesday, 23 June, while holding above their respective 200-day moving averages.
Spot gold continued its downward spiral, settling at $4,110/oz, just a whisker away from the 11 June 2026 low of $4,024/oz as surging sovereign bond yields and a dominant US dollar eroded its non-yielding appeal.
Asia Pacific impact
- South Korean and Taiwanese tech stocks bear the brunt of global liquidation: The global semiconductor rout sparked immediate downside tracking across APAC semiconductor stocks. South Korea’s KOSPI index suffered a dramatic 10% sell-off on Tuesday, 23 June, as foreign institutional capital flowed out of structural hardware leaders such as Samsung Electronics and SK Hynix. Intraday softness continued to prevail in today’s Asian session; Japan’s Nikkei 2225 (-1.6%), South Korea’s KOSPI (+0.5%), Taiwan’s TAIEX (-2.4%), Hong Kong’s Hang Seng Index (unchanged), China’s CSI 300 (+0.1%), Australia’s ASX 200 (+0.1%), and Singapore STI (+0.2%).
- Japanese yen tests policy-intervention boundary near 161.95: Wide real interest rate differentials continued to punish the Yen, locking USD/JPY below the critical 161.95 threshold. Despite increasingly stringent verbal warnings from Finance Minister Katayama regarding spot-market smoothing operations, macro funds are actively testing the central bank’s true pain threshold. Currently, the USD/JPY 161.55 intraday after Tuesday’s tight range movement of only 48 pips.
- Regional energy importers may capture input-cost windfalls: The collapse of Brent crude below $80/bbl is translating into an immediate structural current-account cushion for energy-dependent Asian economies such as China and India. The normalisation of Persian Gulf supply lowers immediate manufacturing input costs and insulates domestic trade balances from the rising US dollar.
Top 5 events to watch today
- RBA Deputy Governor Hauser Speech - 2.30 pm SGT Impact: AUD/USD, AUD crosses
- BoJ Deputy Governor Himino Speech - 2.40 pm SGT Impact: USD/JPY, JPY crosses
- Germany Ifo Business Climate (Jun) - 4:00 pm SGT (consensus: 85.6, May: 84.9) Impact: EUR/USD, EUR crosses, DAX
- EIA Weekly Crude Oil Stockpile Change - 10:30 pm SGT Impact: WTI crude oil futures
- Micron Technology FYQ3 Earnings (after US close) Impact: S&P 500, Nasdaq 100 E-mini futures
Dollar Index Breaks Key Fibonacci Barrier, Sets Stage for July’s Bigger Battle
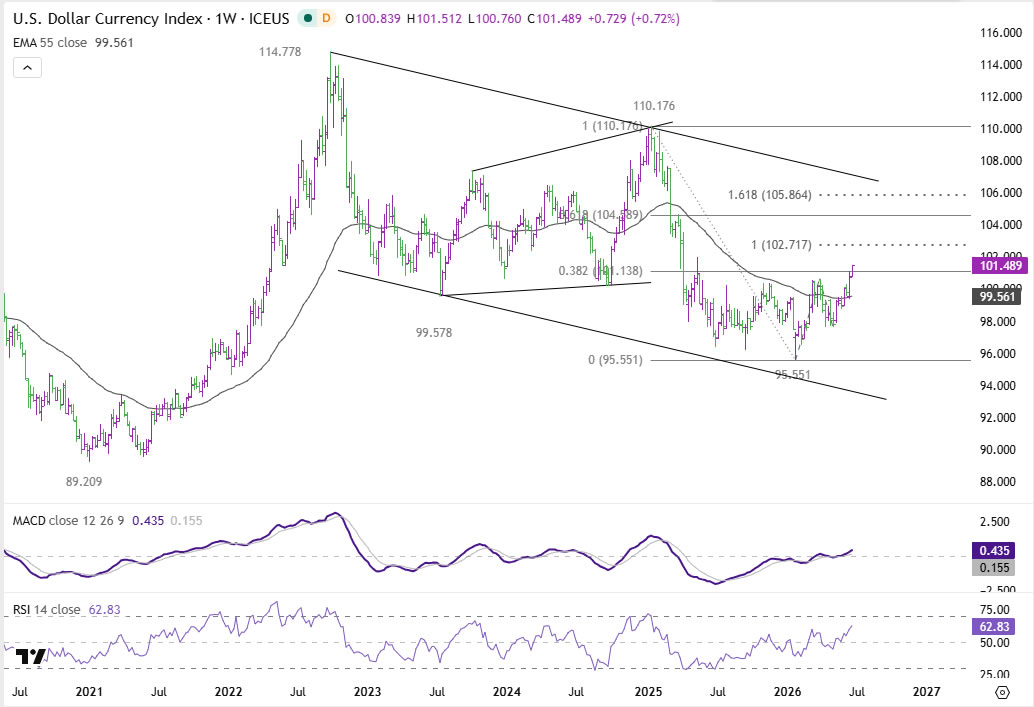
Dollar's rally gathered further momentum this week as a combination of technology-sector liquidation, quarter-end positioning, and growing expectations of additional Federal Reserve tightening pushed Dollar Index through a critical long-term technical barrier. The move marks one of the most important developments for the currency market in 2026, as the break above the 38.2% retracement of the 110.17 to 95.55 decline at 101.38 suggests the broader downtrend from last year's high may already have run its course.
The latest leg higher has been driven by more than Fed expectations alone. Risk aversion intensified this week with a sharp selloff in global technology stocks triggered a broad flight into liquidity. While South Korea's KOSPI managed to rebound briefly today following its near-10% collapse earlier in the week, buying interest faded quickly. Japan's Nikkei and Taiwan's equity market also struggled to sustain gains as investors continued reducing exposure to AI-linked semiconductor names. Taiwan Semiconductor Manufacturing Co. became a particular focal point, falling more than -3% and weighing heavily on regional sentiment.
Importantly, the weakness in equities appears driven by market structure rather than deteriorating economic fundamentals. With June 30 approaching, institutional investors have little incentive to add fresh risk. Fund managers who have already secured strong first-half performance numbers are more focused on preserving gains than deploying capital into volatile technology shares. As a result, rebound seen over recent sessions have lacked conviction, with short-covering replacing genuine long-term buying.
That dynamic helps explain why risk sentiment may struggle to stage a meaningful recovery before early July. The calendar itself has become a headwind for equities and a tailwind for Dollar. Until a new quarter begins and fresh capital allocation decisions are made, selling pressure from portfolio rebalancing and window-dressing activity could continue to dominate market behavior. Under these conditions, Dollar demand is likely to remain well supported in the near term.
Attention will then shift quickly to next week's June non-farm payroll report. Markets are already debating whether the Fed will deliver one additional hike or two before year-end. A stronger-than-expected employment report could further reinforce the view that inflation pressures, particularly in the service sector, will remain persistent enough to justify additional tightening. Such an outcome would provide another powerful catalyst for Dollar strength.
Technically, the break above 38.2% retracement of 110.17 to (2025 high) to 95.55 at 101.38 carries important implications. The move suggests that the entire decline from 110.17 may have completed at 95.55. Further rise is expected as long as 100.31 resistance turned support holds.
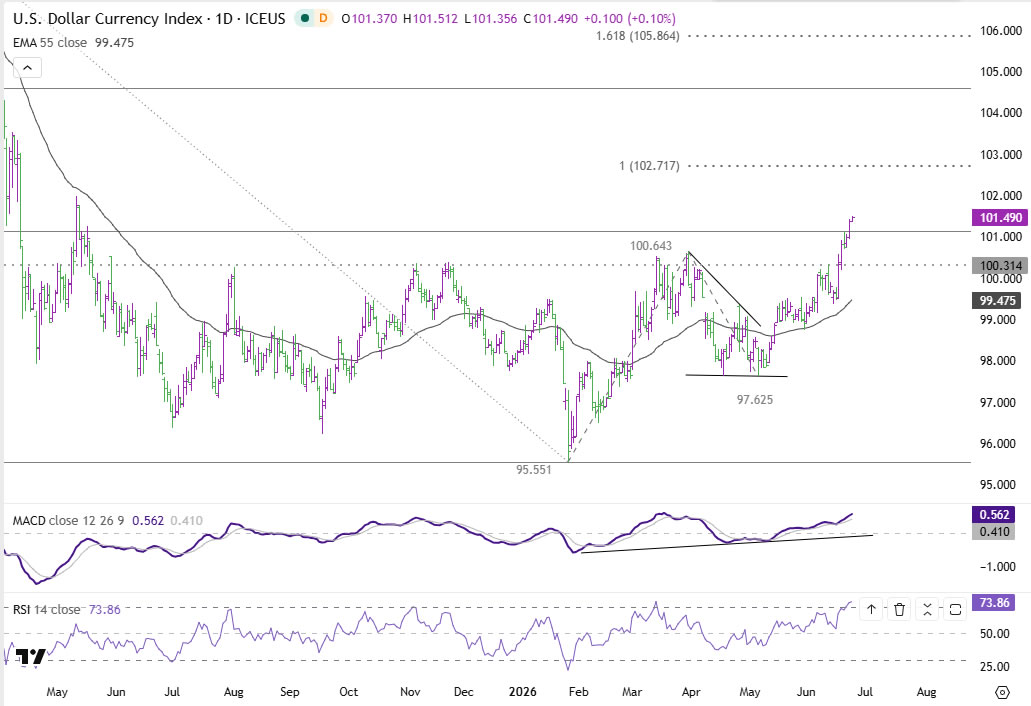
Next target is 100% projection of 95.55 to 100.64 from 97.62 at 102.71. That level may become the defining battleground of early July. Decisive break above 102.71 would strengthen the case that the rally from 95.55 is an impulsive medium-term bull move capable of extending through the second half of the year. Rejection there, however, would leave open the possibility that the entire rally is merely a corrective rebound within a broader bearish structure.
For now, Dollar bulls hold the advantage, but the most important test may still lie ahead.
Australia: First Impressions – May CPI
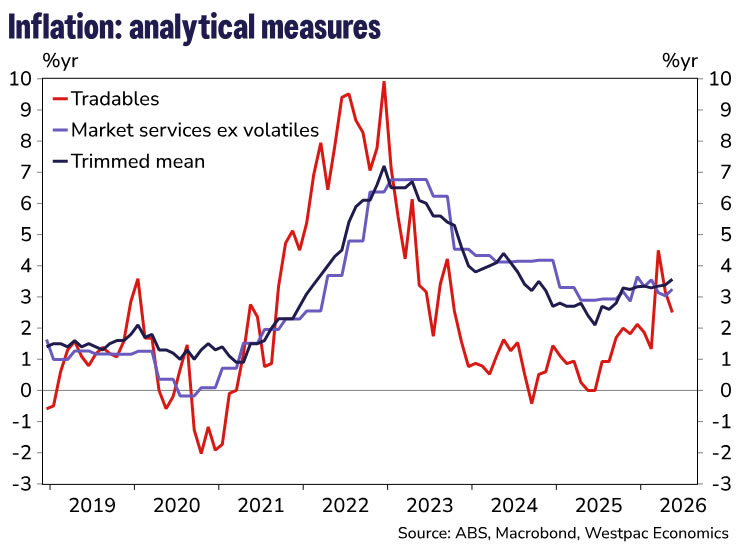
The May CPI fell –0.7%mth to be up 4.0%yr. Trimmed mean rose 0.4%mth/3.6%yr.
The May CPI fell –0.7%mth to be up 4.0%yr. This was below our estimate of 4.4%yr and market expectations of 4.3%yr. May is typically a seasonally softer month for the CPI. In seasonally adjusted terms, the CPI dipped –0.1%mth, compared with our estimate of +0.2%mth. The key drivers behind the softer May outcome were transport, clothing & footwear and recreation & culture. These accounted for nearly all of the miss in our monthly result. Balancing this was a firmer result in the housing component, with a broad-based pick-up across electricity, rents and new dwelling costs.
Despite the weakness in the headline, underlying pressures are picking up and suggest second-round effects from the Middle East conflict are broadening. Trimmed mean inflation printed at 0.4%mth and 3.6%yr, this was in line with our expectations but higher than the market's 3.5%yr. The six-month annualised pace lifted from 3.2% to 3.5%.
In terms of the key surprises to our forecast:
Downside surprises
- Recreation & culture was the key miss, owing to bigger-than expected falls in domestic (–12.1%mth vs –5.5%mth) and international travel (–0.8%mth vs 3.8%mth).
- Clothing & footwear fell by more than expected (–2.9%mth vs –1.8%mth).
- Some of the other areas of weakness were in household textiles (usually weak in May), vegetables and medical appliances.
Upside surprises
- Housing rose 0.5%mth vs 0.3%mth expected. New dwelling costs was the main surprise here, lifting 0.9%mth/5.6%yr, this was the strongest monthly increase since December 2022. We had flagged upside risks here given evidence from price notifications data. Rents rose 0.4%mth against expectations of 0.3%mth.
- Automotive fuel fell by less than expected (–11.9%mth vs –14.5%mth).
The May data provide a stronger signal that second-order effects from the Middle East supply shock are becoming more visible across consumer prices. Oil prices have come off their highs and policy is still dampening parts of fuel inflation, for now, but higher fuel, transport and commodity costs are continuing to feed through to a broader range of categories. This is consistent with firms passing on at least part of the increase in input costs, including energy, freight, plastics and chemicals.
The key question is whether these price increases reverse as cost pressures ease, or whether they persist. Postal costs fell in May, as the fuel surcharge was reduced, showing some pass-through can unwind. But the risk is that pass-through in other areas is stickier, particularly across services. The increase in hairdressing prices, for example, could reflect firms adjusting prices not just for higher fuel and transport costs, but for a broader expectation of higher operating costs. That makes the May outcome less about whether pass-through is occurring, and more about how broad and persistent it becomes.
Today's trimmed mean outcome came in line with expectations and is on track to rise 1.0% in Q2, taking annual trimmed mean inflation to 3.8%yr. As such, we retain our view that further cash rate increases are coming, with the next hike likely at the August meeting.
The May data reinforce the RBA's concern that inflation remains too high and that a period of slower growth will be needed to return inflation to target. Even with oil prices off their highs, and other commodity prices easing to a lesser extent, we expect some further pass-through from still elevated fuel and commodity costs over coming months, particularly as policy supports unwind. Wage costs could add further pressure in the second half, especially across market services.
Housing inflation will also remain a key pressure point. It accounts for around 20% of the CPI basket and is typically a source of persistence in trimmed mean inflation. That keeps upside risks front of mind for the RBA and leaves further tightening firmly on the table.