

Sample Category Title
Australia: First Impressions – May CPI
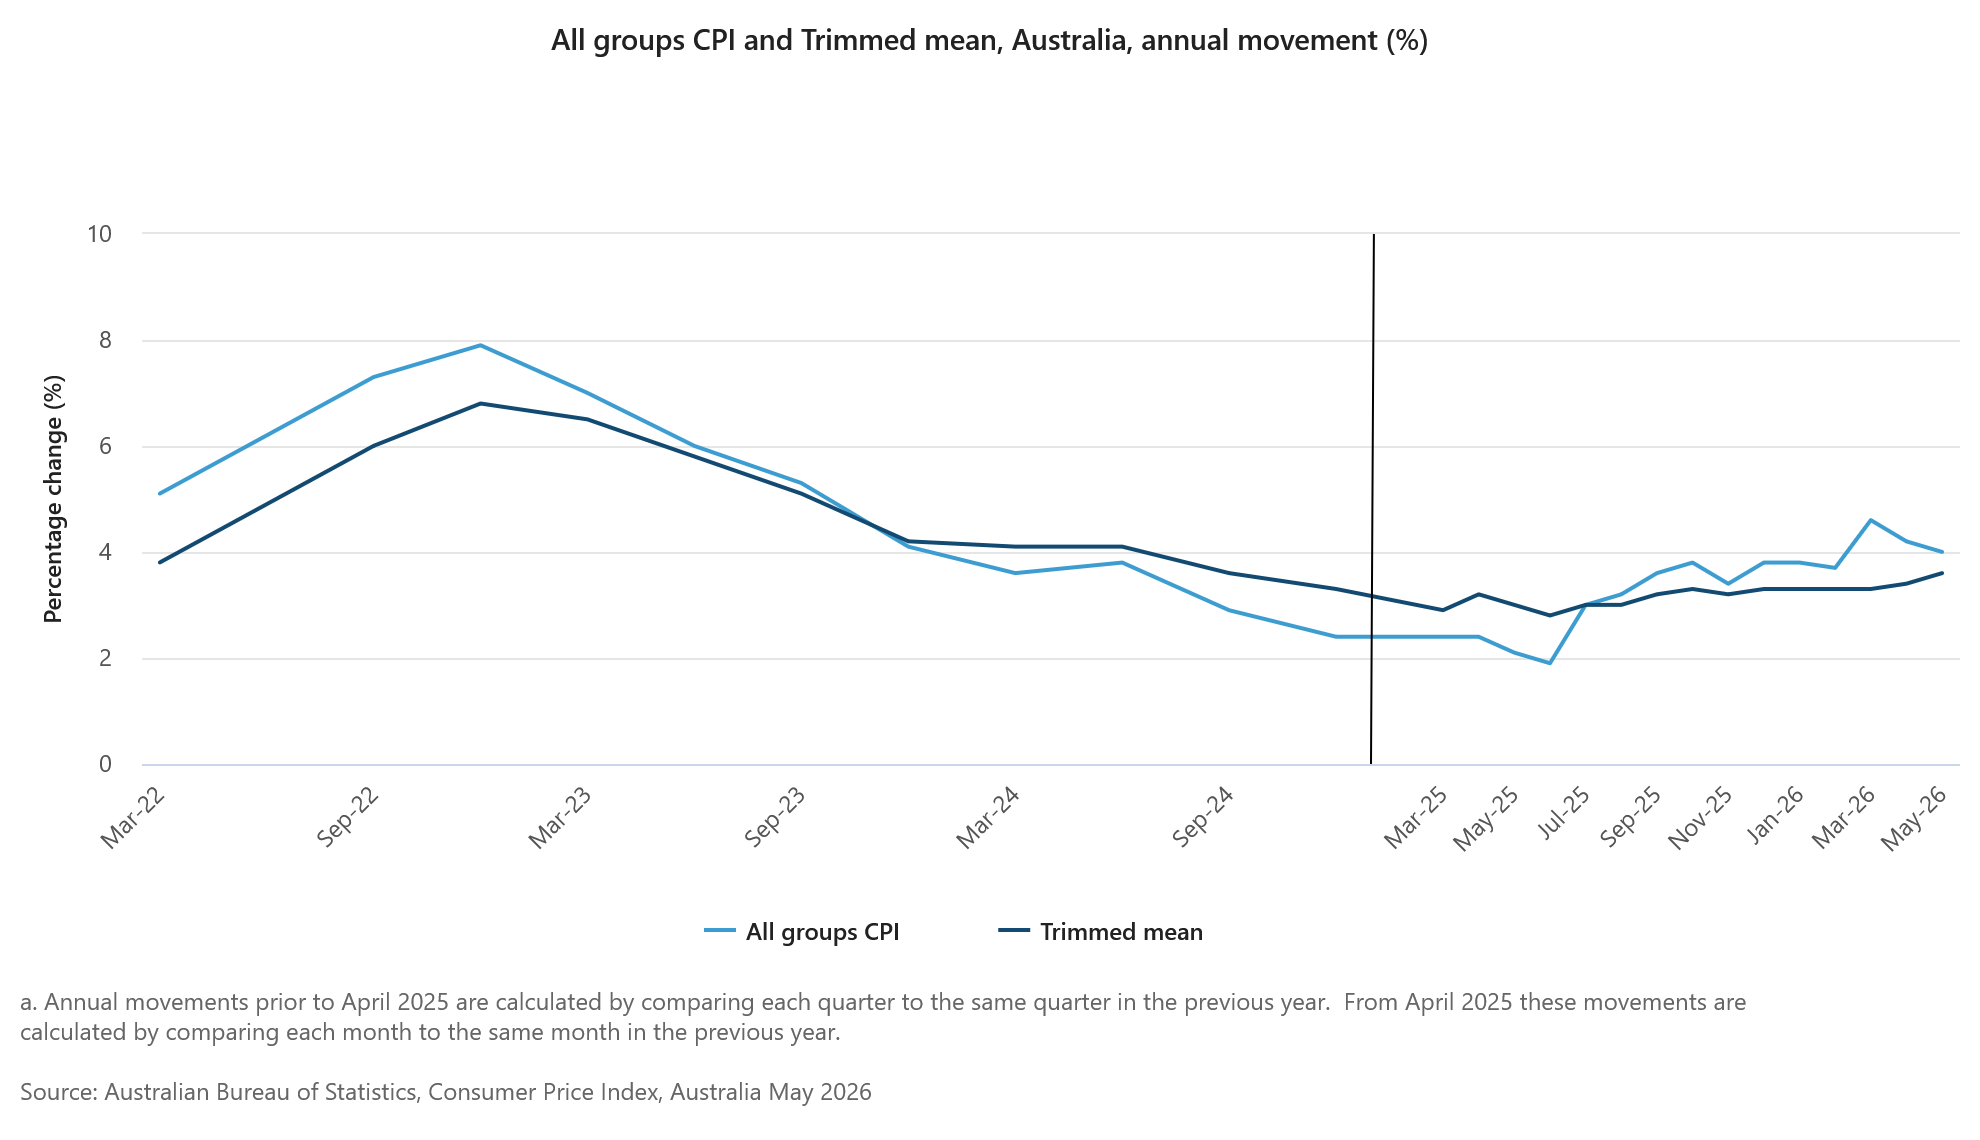
The May CPI fell –0.7%mth to be up 4.0%yr. Trimmed mean rose 0.4%mth/3.6%yr.
The May CPI fell –0.7%mth to be up 4.0%yr. This was below our estimate of 4.4%yr and market expectations of 4.3%yr. May is typically a seasonally softer month for the CPI. In seasonally adjusted terms, the CPI dipped –0.1%mth, compared with our estimate of +0.2%mth. The key drivers behind the softer May outcome were transport, clothing & footwear and recreation & culture. These accounted for nearly all of the miss in our monthly result. Balancing this was a firmer result in the housing component, with a broad-based pick-up across electricity, rents and new dwelling costs.
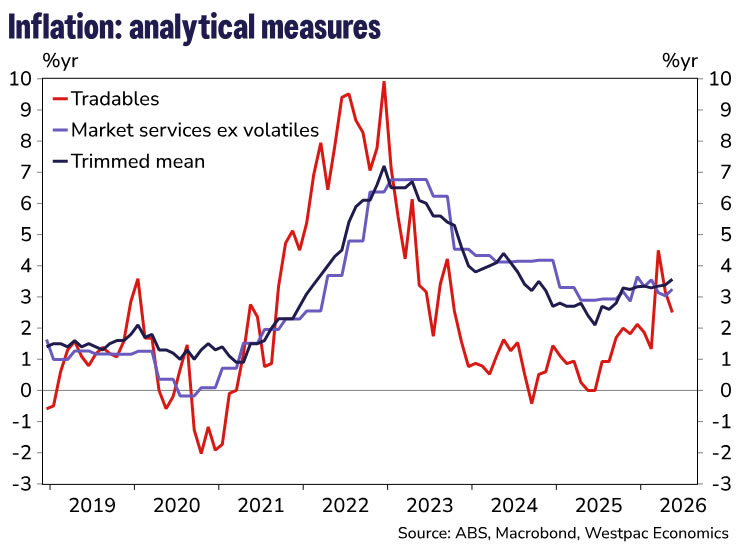
Despite the weakness in the headline, underlying pressures are picking up and suggest second-round effects from the Middle East conflict are broadening. Trimmed mean inflation printed at 0.4%mth and 3.6%yr, this was in line with our expectations but higher than the market's 3.5%yr. The six-month annualised pace lifted from 3.2% to 3.5%.
In terms of the key surprises to our forecast:
Downside surprises
- Recreation & culture was the key miss, owing to bigger-than expected falls in domestic (–12.1%mth vs –5.5%mth) and international travel (–0.8%mth vs 3.8%mth).
- Clothing & footwear fell by more than expected (–2.9%mth vs –1.8%mth).
- Some of the other areas of weakness were in household textiles (usually weak in May), vegetables and medical appliances.
Upside surprises
- Housing rose 0.5%mth vs 0.3%mth expected. New dwelling costs was the main surprise here, lifting 0.9%mth/5.6%yr, this was the strongest monthly increase since December 2022. We had flagged upside risks here given evidence from price notifications data. Rents rose 0.4%mth against expectations of 0.3%mth.
- Automotive fuel fell by less than expected (–11.9%mth vs –14.5%mth).
The May data provide a stronger signal that second-order effects from the Middle East supply shock are becoming more visible across consumer prices. Oil prices have come off their highs and policy is still dampening parts of fuel inflation, for now, but higher fuel, transport and commodity costs are continuing to feed through to a broader range of categories. This is consistent with firms passing on at least part of the increase in input costs, including energy, freight, plastics and chemicals.
The key question is whether these price increases reverse as cost pressures ease, or whether they persist. Postal costs fell in May, as the fuel surcharge was reduced, showing some pass-through can unwind. But the risk is that pass-through in other areas is stickier, particularly across services. The increase in hairdressing prices, for example, could reflect firms adjusting prices not just for higher fuel and transport costs, but for a broader expectation of higher operating costs. That makes the May outcome less about whether pass-through is occurring, and more about how broad and persistent it becomes.
Today's trimmed mean outcome came in line with expectations and is on track to rise 1.0% in Q2, taking annual trimmed mean inflation to 3.8%yr. As such, we retain our view that further cash rate increases are coming, with the next hike likely at the August meeting.
The May data reinforce the RBA's concern that inflation remains too high and that a period of slower growth will be needed to return inflation to target. Even with oil prices off their highs, and other commodity prices easing to a lesser extent, we expect some further pass-through from still elevated fuel and commodity costs over coming months, particularly as policy supports unwind. Wage costs could add further pressure in the second half, especially across market services.
Housing inflation will also remain a key pressure point. It accounts for around 20% of the CPI basket and is typically a source of persistence in trimmed mean inflation. That keeps upside risks front of mind for the RBA and leaves further tightening firmly on the table.
USD/CAD Continues to Climb as Bulls Eye More Gains
Key Highlights
- USD/CAD extended its rally and climbed above 1.4120.
- A major bullish trend line is forming with support at 1.4080 on the 4-hour chart.
- Gold prices could continue to move down if there is a close below $4,050.
- Bitcoin started a fresh decline after it failed to recover above $65,500.
USD/CAD Technical Analysis
The US Dollar started a steady increase above 1.3880 against the Canadian Dollar. USD/CAD surpassed key hurdles such as 1.4000 and 1.4120.
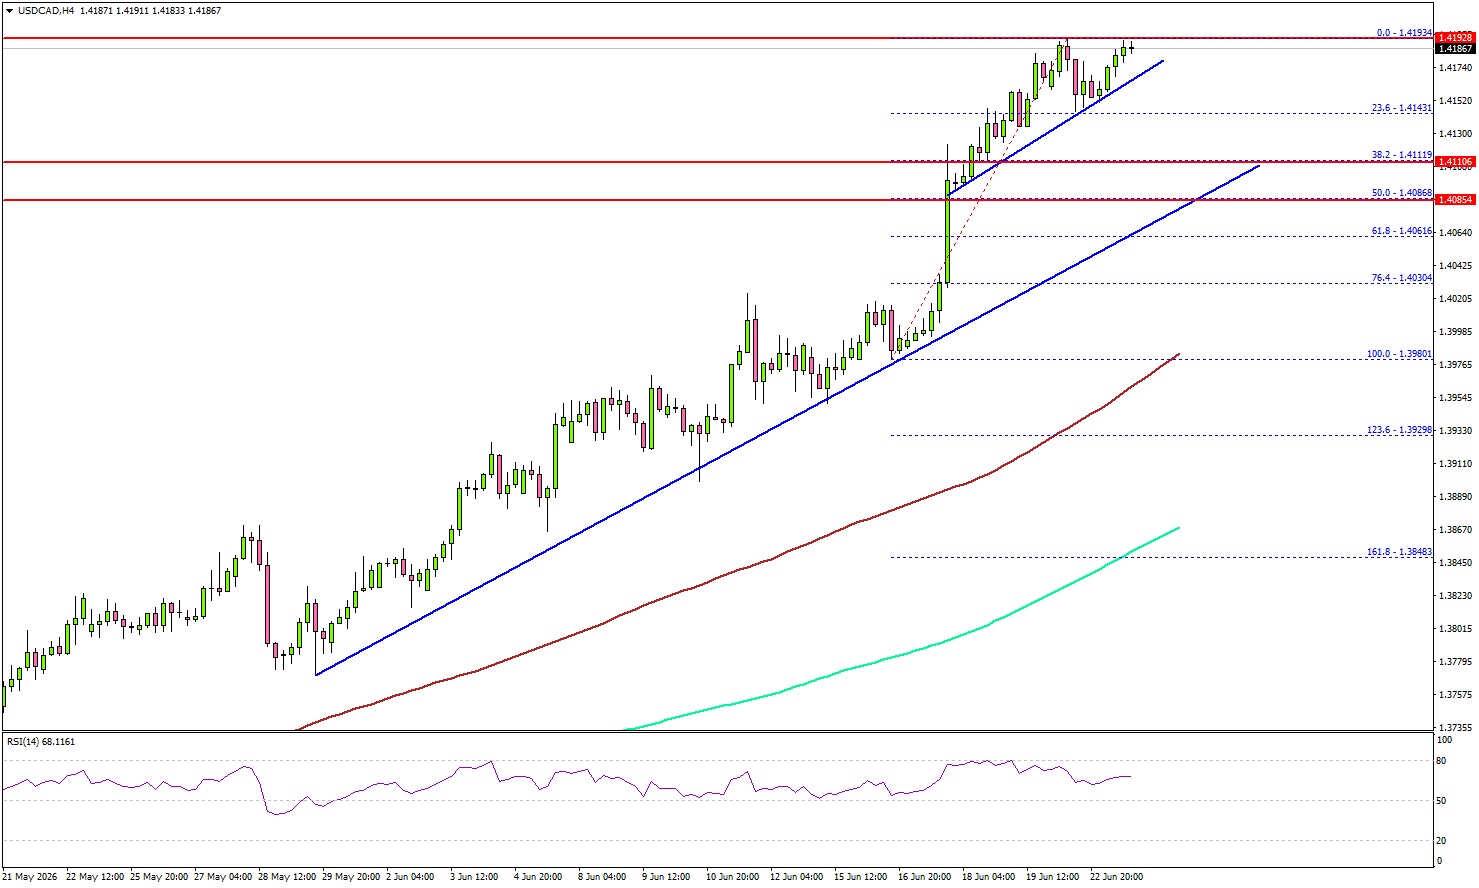
Looking at the 4-hour chart, the pair settled well above 1.4050, the 100 simple moving average (red, 4-hour), and the 200 simple moving average (green, 4-hour). The bulls even pushed the pair toward 1.4200.
The current price action suggests that the pair could continue to rise if it settles above 1.4200. The next major resistance could be 1.4265. A close above 1.4265 could open the doors for a larger increase. In the stated case, USD/CAD might aim for a test of 1.4500.
If there is a downside correction, the pair might find support near a connecting bullish trend line at 1.4170. The first major support could be near 1.4120.
The main support could be 1.4080. There is also a major bullish trend line forming with support at 1.4080. A downside break and close below the trend line might spark bearish moves. In the mentioned case, the bears could aim for a test of the 100 simple moving average (red, 4-hour) at 1.3980.
Looking at Bitcoin, the price failed to recover above $65,500, reacted to the downside, and might continue to move down.
Upcoming Key Economic Events:
- EIA Crude Oil Stocks Change.
- US New Home Sales for May 2026 (MoM) – Forecast -4.9% versus -6.2% previous.
BoJ Hawks Eye Path Toward 2% Neutral Rate, Summary Shows
The Bank of Japan's Summary of Opinions from its June meeting revealed a notably hawkish tone beneath last week's widely expected rate hike to 1.00%. Several members argued that inflation risks remain skewed to the upside, with one warning that "underlying CPI inflation will deviate upward to a level above the price stability target of 2 percent" if monetary accommodation is not adjusted appropriately. Another member noted that while the Middle East conflict has eased, logistics disruptions and lingering supply-side pressures continue to pose risks of broader price increases, supporting the case for the June hike.
More importantly, the discussion appears to be shifting beyond whether rates should rise toward how far they ultimately need to go. Multiple members argued that it is "appropriate for the Bank to continue to raise the policy interest rate" if economic activity and prices evolve in line with projections. One of the strongest views stated that Japan's policy rate remains below the estimated neutral range and that "the neutral interest rate appears to be at around 2 percent." Another member argued that the Bank should bring rates closer to neutral sooner in order "to avoid rapid and significant policy interest rate hikes" later. Such remarks suggest some policymakers already see substantial room for further normalization beyond the current 1.00% policy rate.
The main dissenting argument focused on risks to growth rather than inflation. One member warned that raising rates could suppress business investment and potentially trigger simultaneous declines in inflation, production and employment, concluding that the Bank should have left rates unchanged. While the Summary does not identify speakers, that view is widely believed to belong to newcomer Toichiro Asada, who voted against the June hike and became the first board appointee under Prime Minister Sanae Takaichi.
Even so, the broader message from the Summary was clear: the debate inside the BoJ is increasingly centered on the pace of future tightening rather than the need for it, reinforcing expectations that additional rate hikes remain likely in the coming quarters.
Australia CPI Misses Expectations at 4%, Yet Core Inflation Sends Hawkish Signal
Australia's May inflation report delivered something for both doves and hawks. On the surface, the numbers looked encouraging. Headline CPI fell -0.7% mom and annual inflation slowed from 4.2% yoy to 4.0% yoy, both coming in below market expectations. Much of that improvement came from the collapse in fuel prices, with automotive fuel costs plunging -11.9% during the month after a -7.0% fall in April. Lower global oil prices and the government's fuel excise reduction combined to deliver a powerful disinflationary boost.
The deeper story, however, was much less reassuring. The RBA's preferred trimmed mean measure rose 0.4% mom, exceeding expectations. Annual trimmed mean inflation accelerated from 3.4% yoy to 3.6% yoy, and reached the highest level since late 2024. In other words, the decline in headline inflation was largely driven by energy-related factors rather than a broad-based easing in domestic price pressures. That distinction matters because policymakers are focused on whether underlying inflation is becoming embedded in the economy.
The split between goods and services inflation highlights the challenge. Goods inflation eased from 4.7% yoy to 4.2% yoy as lower fuel prices filtered through the economy. Services inflation moved in the opposite direction, accelerating from 3.5% yoy to 3.7% yoy. Housing was the biggest contributor to overall inflation, rising 6.5% yoy, while food and transport costs also remained elevated.
The report is unlikely to provide a decisive answer on whether the RBA is finished tightening. Instead, it reinforces the central debate facing policymakers: headline inflation is moving lower, but the underlying inflation problem has yet to show convincing signs of fading.
| Indicator | April | May | Market Expectation |
|---|---|---|---|
| CPI (m/m) | 0.4% | -0.7% | -0.4% |
| CPI (y/y) | 4.2% | 4.0% | 4.3% |
| Trimmed Mean CPI (m/m) | 0.3% | 0.4% | 0.3% |
| Trimmed Mean CPI (y/y) | 3.4% | 3.6% | 3.6% |
| Goods Inflation (y/y) | 4.7% | 4.2% | — |
| Services Inflation (y/y) | 3.5% | 3.7% | — |
| Automotive Fuel Prices (m/m) | -7.0% | -11.9% | — |
EURUSD Falls to One-Year Low
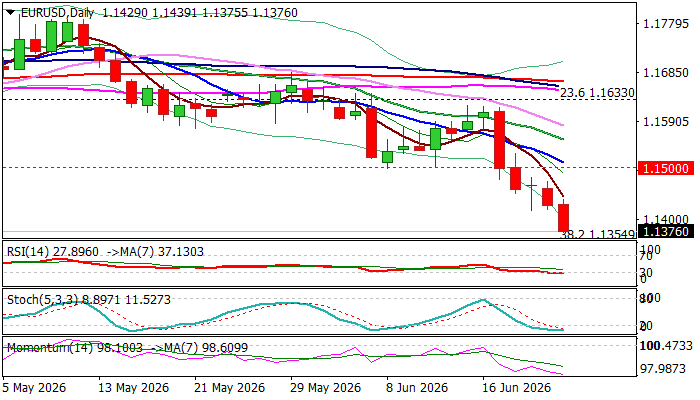
The Euro extends steep fall into fifth consecutive day and falls to the lowest in one year on Tuesday, following break of former 2026 low (1.1410).
The single currency was deflated by growing expectations of Fed rate hike that continue to boost US dollar, with latest dovish remarks from ECB President Lagarde, adding pressure.
Fresh weakness nears next technical support at 1.1354 (Fibo 38.2% of 1.0177/1.2082 rally) and is about to complete Head and Shoulders pattern on weekly chart that would reinforce bearish stance.
Full bearish setup of daily studies supports negative scenario, but oversold conditions warn of increased headwinds bears may face on approach 1.1354 Fibo level and 100WMA (1.1290).
Daily close below 1.1410 is needed to validate signal, however, bounce on partial profit taking may precede.
Under current conditions, upticks are likely to be limited and ideally to be capped by 1.1500 resistance zone (psychological / falling 10DMA / former daily higher base) to provide better levels for re-entering bearish market.
Firm break of 1.1354/1.1290 pivots to open way for extension towards 1.1130 (50% retracement) and to unmask weekly cloud base (1.1048) and 1.1000 zone (psychological / 200WMA).
Res: 1.1410; 1.1443; 1.1500; 1.1555
Sup: 1.1354; 1.1290; 1.1210; 1.1130
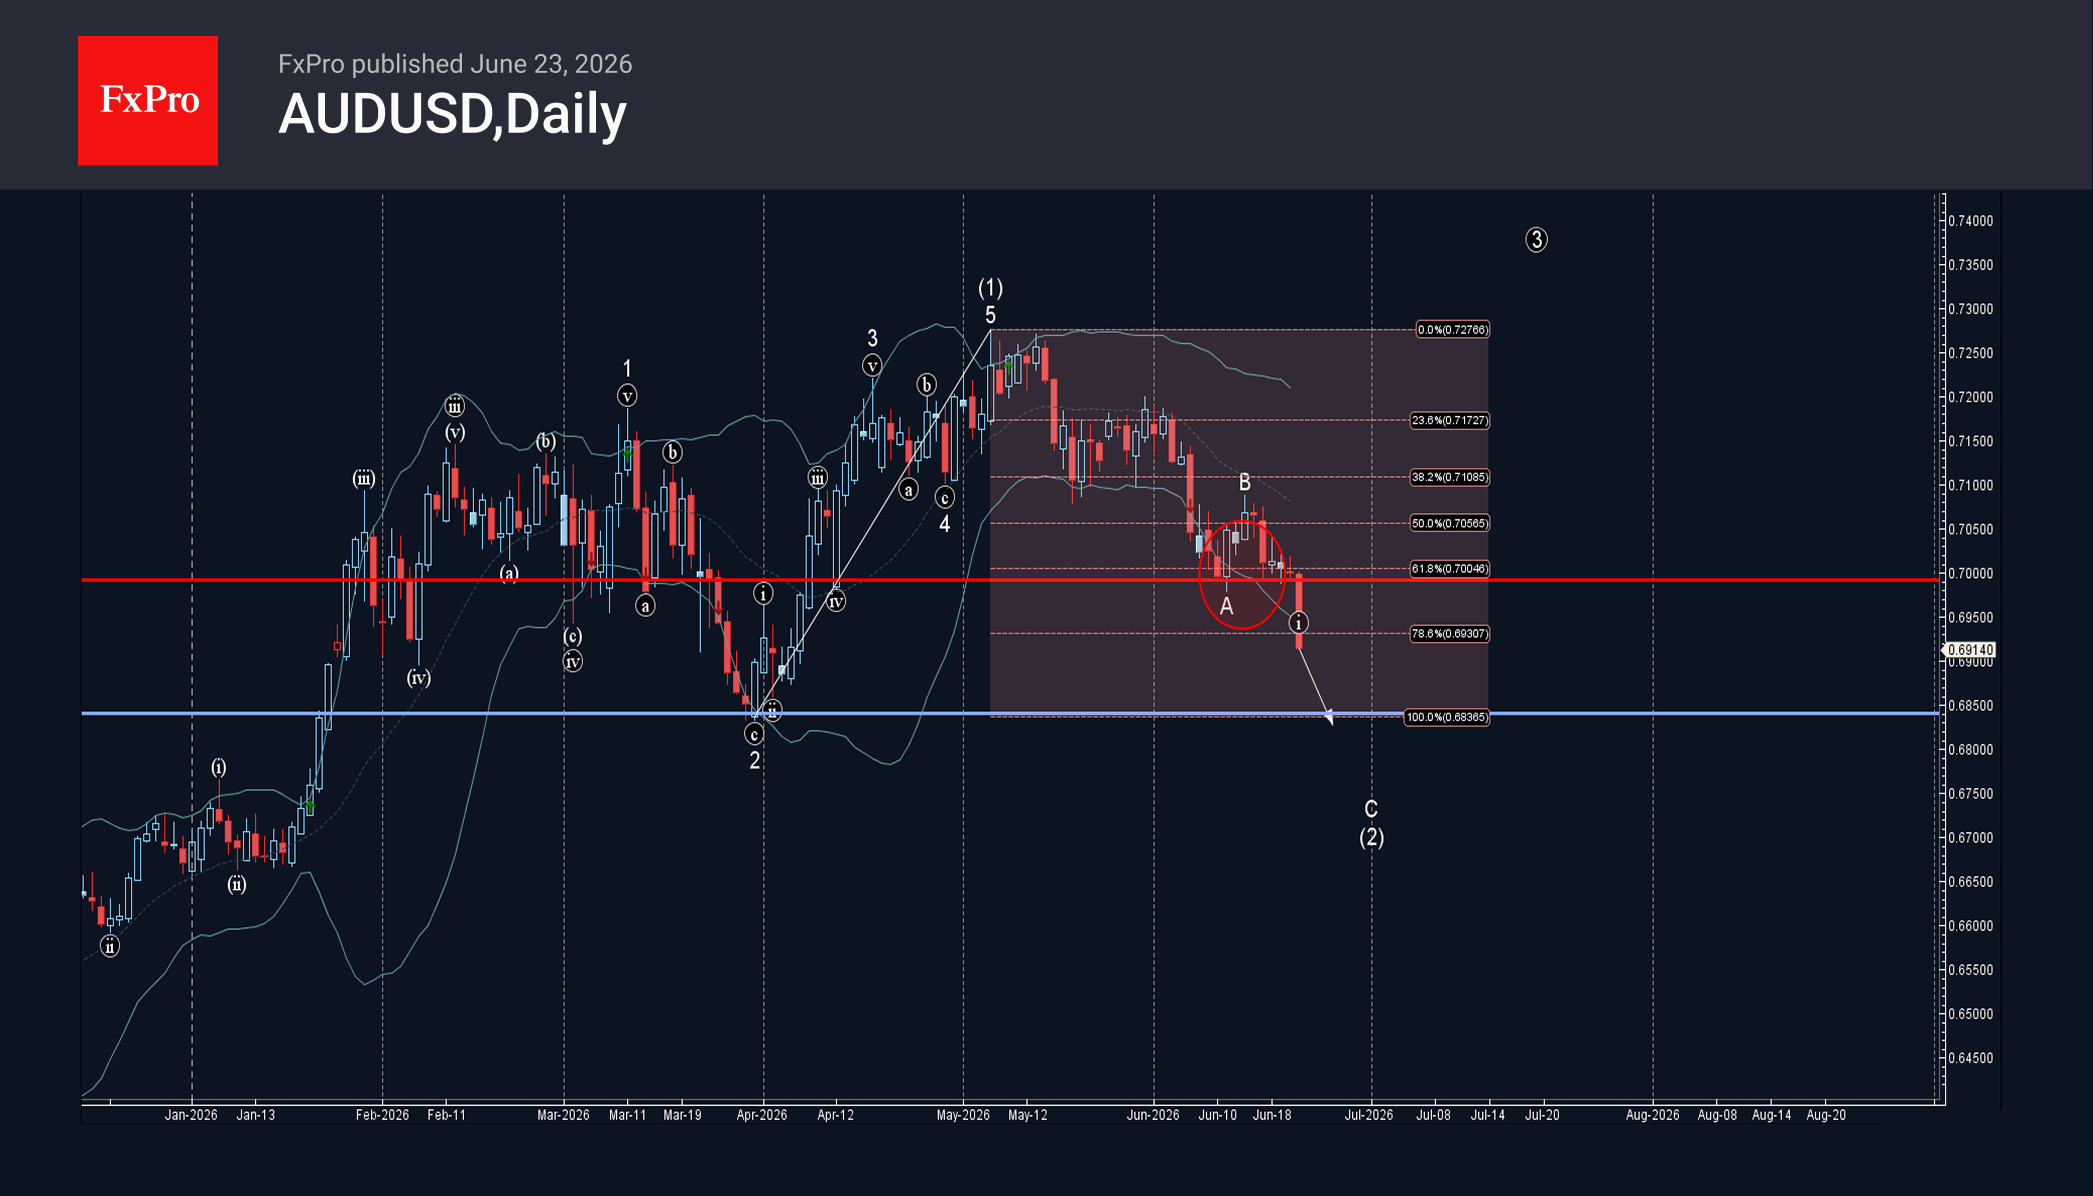
AUDUSD Wave Analysis – 23 June 2026
AUDUSD: ⬇️ Sell
– AUDUSD broke support zone
– Likely to fall to support level 0.6850
AUDUSD currency pair recently broke the support zone between the round support level 0.7000 (which stopped the previous impulse wave A at the start of June, as can be seen below) and the 61.8% Fibonacci correction of the upward impulse from March.
The breakout of this support zone accelerated wave C of the ABC correction (2) from the start of May.
AUDUSD currency pair can be expected to fall further to the next support level 0.6850 (former multi-month low from the end of March).
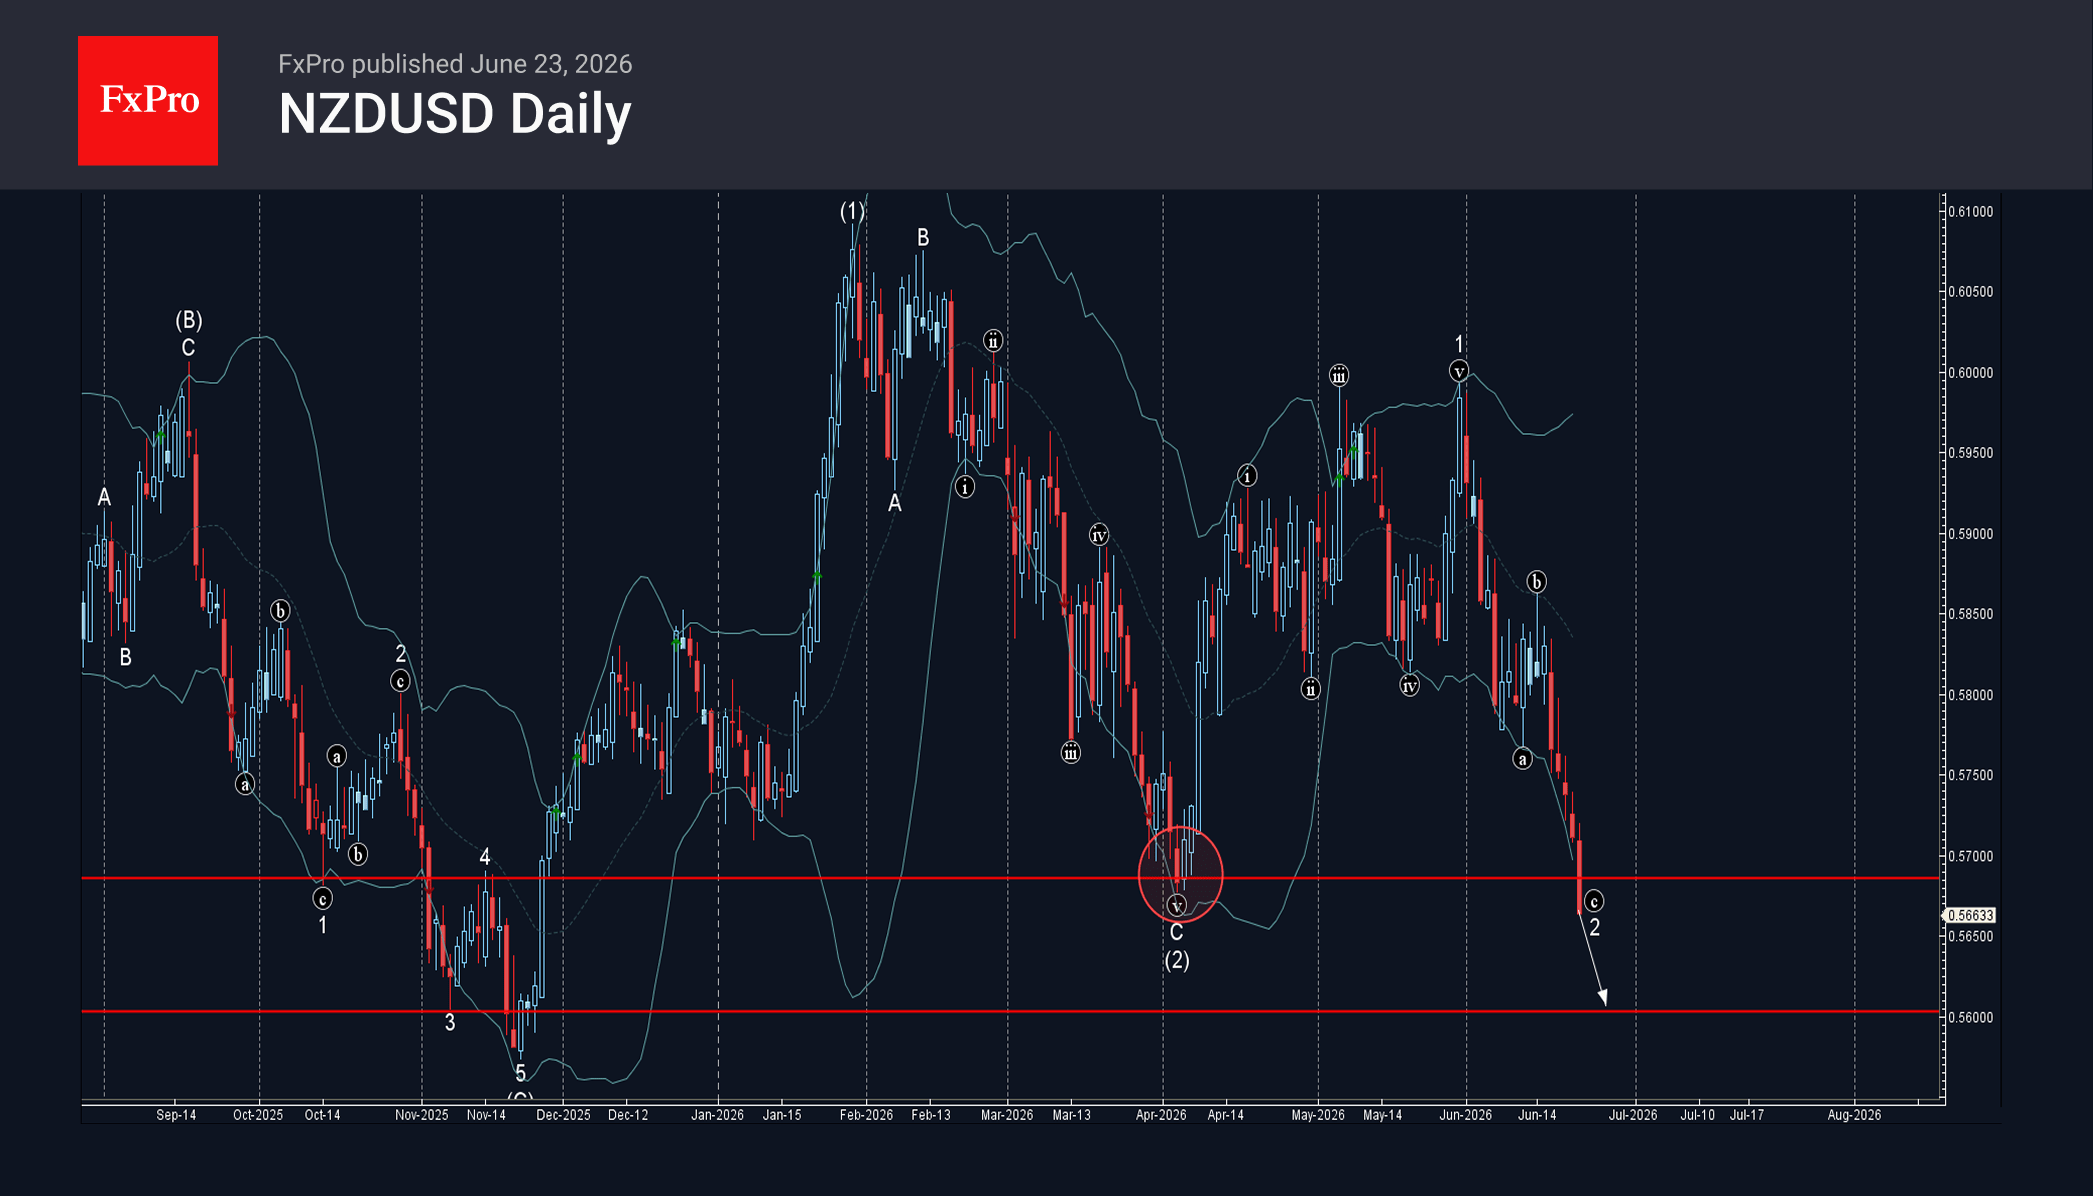
NZDUSD Wave Analysis – 23 June 2026
NZDUSD: ⬇️ Sell
– NZDUSD broke key support level 0.5685
– Likely to fall to support level 0.5600
NZDUSD currency pair recently broke the key support level 0.5685 (which stopped the previous impulse wave С at the start of April, as can be seen below).
The breakout of the support level 0.5685 accelerated wave c of the ABC correction 2 from the end of May.
Given the strongly bullish US dollar sentiment seen today, NZDUSD currency pair can be expected to fall to the next support level 0.5600 (former strong support from November).
Eco Data 6/24/26
| GMT | Ccy | Events | Act | Cons | Prev | Rev |
|---|---|---|---|---|---|---|
| 23:50 | JPY | Corporate Service Price Index Y/Y May | 3.30% | 3.30% | 3.00% | 3.30% |
| 23:50 | JPY | BoJ Summary of Opinions | ||||
| 01:30 | AUD | CPI M/M May | -0.70% | -0.40% | 0.40% | |
| 01:30 | AUD | CPI Y/Y May | 4.00% | 4.30% | 4.20% | |
| 01:30 | AUD | Trimmed Mean CPI M/M May | 0.40% | 0.30% | 0.30% | |
| 01:30 | AUD | Trimmed Mean CPI Y/Y May | 3.60% | 3.60% | 3.40% | |
| 08:00 | CHF | UBS Economic Expectations Jun | -25 | -11.1 | ||
| 08:00 | EUR | Germany IFO Business Climate Jun | 85.6 | 85.6 | 84.9 | |
| 08:00 | EUR | Germany IFO Current Assessment Jun | 87 | 86 | 86.1 | |
| 08:00 | EUR | Germany IFO Expectations Jun | 84.1 | 85 | 83.8 | |
| 12:30 | USD | Current Account (USD) Q1 | -227B | -225B | -190.7B | -221B |
| 14:00 | USD | New Home Sales May | 580K | 640K | 622K | 626K |
| 14:30 | USD | Crude Oil Inventories (Jun 19) | -6.1M | -3.9M | -8.3M |
| 23:50 | JPY |
| Corporate Service Price Index Y/Y May | |
| Actual | 3.30% |
| Consensus | 3.30% |
| Previous | 3.00% |
| Revised | 3.30% |
| 23:50 | JPY |
| BoJ Summary of Opinions | |
| Actual | |
| Consensus | |
| Previous | |
| 01:30 | AUD |
| CPI M/M May | |
| Actual | -0.70% |
| Consensus | -0.40% |
| Previous | 0.40% |
| 01:30 | AUD |
| CPI Y/Y May | |
| Actual | 4.00% |
| Consensus | 4.30% |
| Previous | 4.20% |
| 01:30 | AUD |
| Trimmed Mean CPI M/M May | |
| Actual | 0.40% |
| Consensus | 0.30% |
| Previous | 0.30% |
| 01:30 | AUD |
| Trimmed Mean CPI Y/Y May | |
| Actual | 3.60% |
| Consensus | 3.60% |
| Previous | 3.40% |
| 08:00 | CHF |
| UBS Economic Expectations Jun | |
| Actual | -25 |
| Consensus | |
| Previous | -11.1 |
| 08:00 | EUR |
| Germany IFO Business Climate Jun | |
| Actual | 85.6 |
| Consensus | 85.6 |
| Previous | 84.9 |
| 08:00 | EUR |
| Germany IFO Current Assessment Jun | |
| Actual | 87 |
| Consensus | 86 |
| Previous | 86.1 |
| 08:00 | EUR |
| Germany IFO Expectations Jun | |
| Actual | 84.1 |
| Consensus | 85 |
| Previous | 83.8 |
| 12:30 | USD |
| Current Account (USD) Q1 | |
| Actual | -227B |
| Consensus | -225B |
| Previous | -190.7B |
| Revised | -221B |
| 14:00 | USD |
| New Home Sales May | |
| Actual | 580K |
| Consensus | 640K |
| Previous | 622K |
| Revised | 626K |
| 14:30 | USD |
| Crude Oil Inventories (Jun 19) | |
| Actual | -6.1M |
| Consensus | -3.9M |
| Previous | -8.3M |
Sunset Market Commentary
Markets
The June PMIs come with an important disclaimer this time around: "Most of the responses used in the calculation of the June flash PMI data were received prior to the signing of the memorandum of understanding for a cessation of hostilities between the US and Iran on June 17th." A deal was reached at the start of last week, meaning some related optimism entered the closely watched business confidence indicators. But with the actual signing of the deal days later, it's likely that the final reading (July 3) will get revised higher. For now, the euro area economy is contracting at a slower pace than in May with the headline index recovering from 48.5 to 49.5. The survey is indicative of unchanged GDP over Q2, the owner said. The services sector carried the improvement on signs that demand recovers after war-related disruptions. Activity slowed at a slower pace (48.9 from 47.7). Manufacturing production continued to rise modestly (51.2 from 51.3). New businesses fell again. A small increase in manufacturing failed to counter a further fall in services. June saw a renewed, but marginal increase in service staffing levels. Sustained job cuts in manufacturing, however, more than offset that. Manufacturers reported lengthening suppliers' delivery times while purchasing activity was broadly unchanged. The latter meant the end of a three-month increase in anticipative buying. Inflationary pressures eased. Input costs rose rapidly, yet at the slowest pace since February across both sectors. Prices charged/output prices rose again. While less quickly than in May, they did not fully reflect the larger easing in factory gate prices. Optimism for the year ahead ticked higher from the 31-month low seen in June. While still low historically, the direction is encouraging. The PMIs printed close to consensus and leave little traces on markets. German bunds gradually grinded high, resulting in yield changes varying between -3.5 and -4.6 bps. It's more a haven-thing though. A tech shake-out is weighing on stock markets with rotation into value and small caps continuing. The Nasdaq trades another 1.6% lower. The shaky risk environment turns out to be the biggest driver for FX too. It could remain a key factor for trading going into the close of 2026Q2 and 2026H1. The US dollar is the main beneficiary. EUR/USD is testing critical support at 1.1392. Breaking lower means a return to intermediate support in the 1.1214-1.1276 area (2024 and 2023 high respectively). Strong support lies at 1.1109/1.1111, where the 38.2% and the 50% pullback on the 2022-2026 and 2025-2026 rally merge. DXY breaks through 101.14 resistance (38.2% recovery on the 2025-2026 decline) to trade at 101.30. Next stops are 102.86 (50% recovery), followed by 104.59 (61.8%) and 104.68 (March 2025 correction high). Today's market environment helps the yen to stop the haemorrhaging of the last couple of weeks. USD/JPY stabilizes just shy of multidecade highs around 161.5. Sterling continues to enjoy a politically inspired bid, shrugging off the largely weaker-than-expected UK PMIs. The composite indicator unexpectedly slipped marginally deeper into contraction territory (49.4). EUR/GBP trades at 0.8618, the weakest since mid-March. US PMIs improved from May to 52.2 (composite) with better readings across both sectors. They amount to an annualized 1% growth in Q2. The PMI owners strike a cautious tone, particularly when it comes to employment. Factory job cuts are running at the highest since 2009 if the pandemic is excluded. Input cost inflation is high but has eased from May while prices charged rose at the same pace seen last month.
News & Views
The Hungarian central bank (MNB) lowered its policy rate as generally expected by 25 bps, from 6.25% to 6%. The inflation path in the June forecast significantly shifted downwards compared to the March Inflation Report. The stronger forint, as well as the decline in energy and food prices has resulted in lower inflation. With the easing of the conflict in Iran, market fuel prices are declining below the level of fuel price caps. For the rest of this year and next year the rate of price increases will remain below the central bank's 3% target. On annual average, inflation is expected to be 1.8% this year, 2.3% in 2027, and 3% in 2028. New GDP forecasts stand at 2%-3%-2.9% for the policy horizon. The baseline scenario is surrounded by balanced inflation and upside growth risks. The global risk environment has become more favourable, Hungarian risk premia remain tight and frozen EU funds will be unlocked. Looking ahead, if current positive developments persist, the MNB – while maintaining a positive real interest rate – sees room for further interest rate cuts throughout the summer, with a decision on their continuation to be made based on the September Inflation Report. The MNB meets both in July (21) and August (25) suggesting a 5.5% policy rate going into the September meeting. That's faster than markets were anticipating. EUR/HUF extends today's risk-off gains, moving from 352 to 355. The HUF swap rate curve bull steepens with yields up to 6 bps lower at the front end.
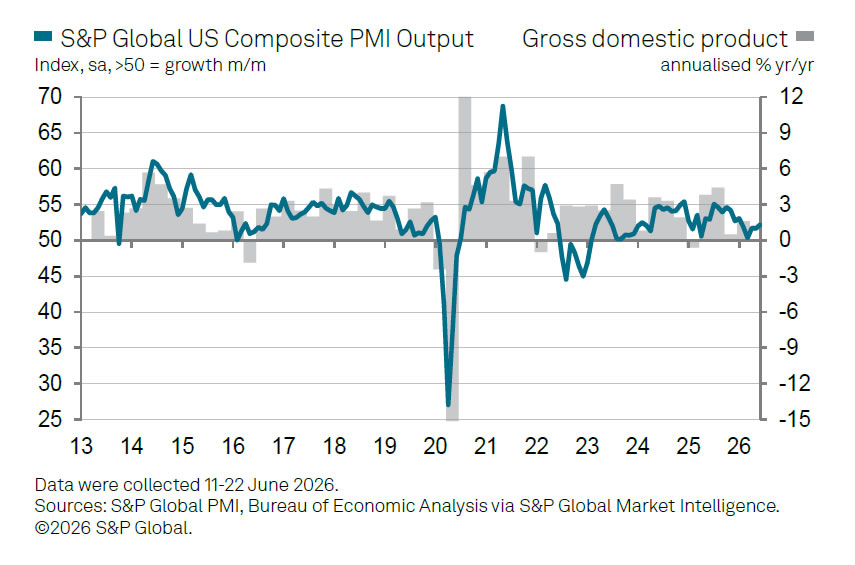
US PMI Improves as Middle East Tensions Ease and Energy Costs Fall
US business activity accelerated in June, with the Flash Composite PMI Output Index rising from 51.5 to 52.2, its highest level in five months. The improvement was driven largely by manufacturing, where the Manufacturing PMI increased from 55.1 to 55.7, a 49-month high, while the Manufacturing Output Index climbed from 56.6 to 57.7, the strongest reading in nearly five years. Services activity also improved modestly, with the Services PMI Business Activity Index rising from 50.7 to 51.3, a four-month high.
According to S&P Global's Chris Williamson, improved sentiment following progress toward peace in the Middle East helped support business confidence. However, he cautioned that overall growth remains relatively subdued compared with the pace seen before the conflict. The survey is consistent with an economy expanding at little more than a 1% annualized rate in the second quarter. Services activity continued to be restrained by consumer resistance to higher prices and weak confidence, while manufacturing growth remained supported by inventory building as firms sought protection against supply disruptions. Supply delays became more widespread during June, suggesting concerns about supply chains have not fully disappeared.
The labor market remained the weakest part of the report. Williamson noted that employment fell again, with manufacturing job losses running at their fastest pace since 2009, excluding the pandemic period. Businesses appear increasingly concerned about the durability of recent demand growth and the impact of rising raw material costs. Nevertheless, there was some relief on the inflation front. While input cost pressures remained elevated by historical standards, June data showed signs of cooling, helped in part by lower energy prices toward the end of the survey period.
| Indicator | May | June | Change |
|---|---|---|---|
| Composite PMI Output Index | 51.5 | 52.2 | ↑ 0.7 |
| Services PMI Business Activity Index | 50.7 | 51.3 | ↑ 0.6 |
| Manufacturing PMI | 55.1 | 55.7 | ↑ 0.6 |
| Manufacturing Output Index | 56.6 | 57.7 | ↑ 1.1 |