Sample Category Title
EURUSD Under Pressure US inflation, France, and ECB Rate
The EUR/USD pair declined to 1.0504 on Thursday, influenced by investor reactions to the latest US inflation data. The November US Consumer Price Index (CPI) showed a rise of 0.3% month-over-month, aligning with forecasts but indicating a slight acceleration from the previous 0.2% increase. This recent uptick has adjusted market expectations significantly, reducing hopes for a substantial interest rate cut by the Federal Reserve in the upcoming meeting. According to CME Watch, the likelihood of a 25-basis-point cut is now pegged at 94%.
US inflation stands at 2.7% year-on-year, slightly up from 2.6%, suggesting persistent inflationary pressures despite elevated interest rates. This scenario indicates that consumers remain active, which could complicate the Federal Reserve’s monetary policy strategy.
Meanwhile, the political situation in France has been factored into the EUR/USD rates, though some underlying tensions persist.
Attention now turns to the European Central Bank (ECB), whose interest rate is 3.4%. Market participants are keenly awaiting whether the ECB will adjust rates in its upcoming meeting.
Technical analysis of EUR/USD
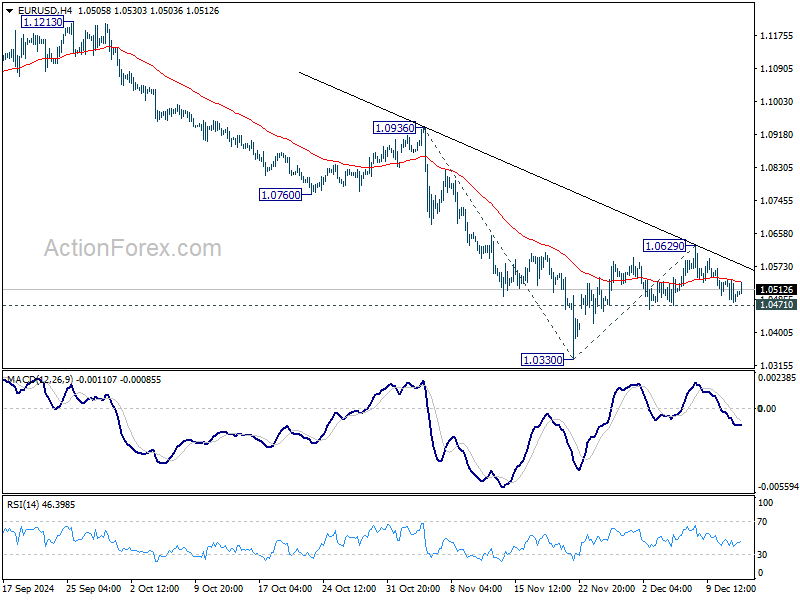
H4 chart: the EUR/USD has recently completed a decline to the level of 1.0479 and appears poised to continue this downward trend towards 1.0470. Following this, a corrective move to 1.0535 is anticipated, and once this is complete, another decline to 1.0444 could follow. This bearish outlook is supported by the MACD indicator, with its signal line positioned below zero and trending downwards, indicating continued selling pressure.
H1 chart: the pair is developing a downward structure towards 1.0470, currently consolidating around 1.0505. A breakout below this level could lead to reaching the target level of 1.0470. Subsequently, a rebound to 1.0535 might occur, followed by a further decline to 1.0444. This scenario is supported by the Stochastic Oscillator, with its signal line above 80 but poised to drop towards 20, suggesting a potential shift from overbought conditions to lower levels.
USD/CHF Outlook: Swiss Franc Falls After SNB’s Surprise 0.50% Rate Cut
USDCHF rose to two-week high on 0.8% jump on Thursday morning, after the Swiss National Bank surprised by 50 basis points rate cut (0.50% from 1%) against widely expected 25 basis points cut.
This was the fourth policy easing in 2024, following three 0.25% cuts in March, June and September, and the biggest rate reduction in nearly a decade.
The SNB said it will continue to monitor the situation and act accordingly in order to maintain price stability and inflation within the central bank’s0%-2% range (November inflation was 0.7%).
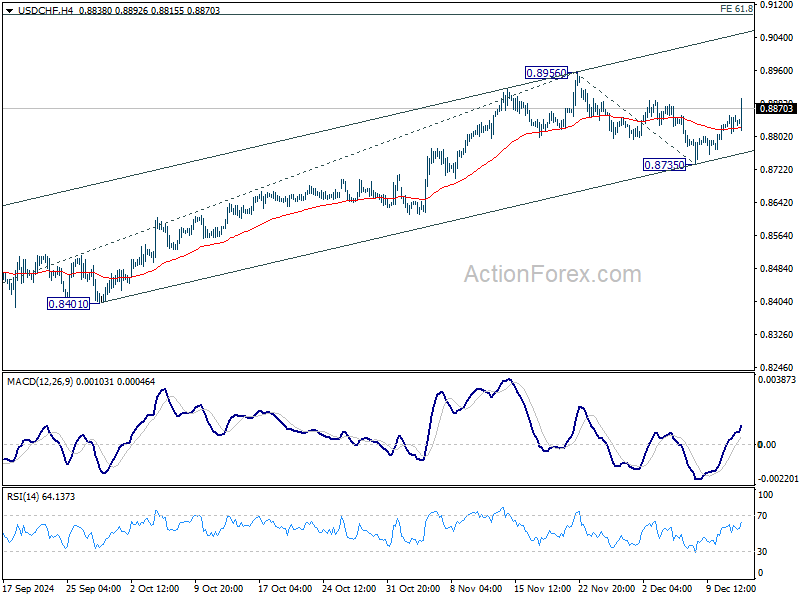
Fresh post-SNB acceleration extended recovery leg from 0.8725 (Dec 6 higher low) into fifth straight day and broke above Fibo 61.8% retracement of 0.8957/0.8725 pullback, also denting the lower platform at 0.8890 zone.
Sustained break above these levels is needed to validate fresh bullish signal and open way for full retracement of 0.8957/0.8725 bear-leg.
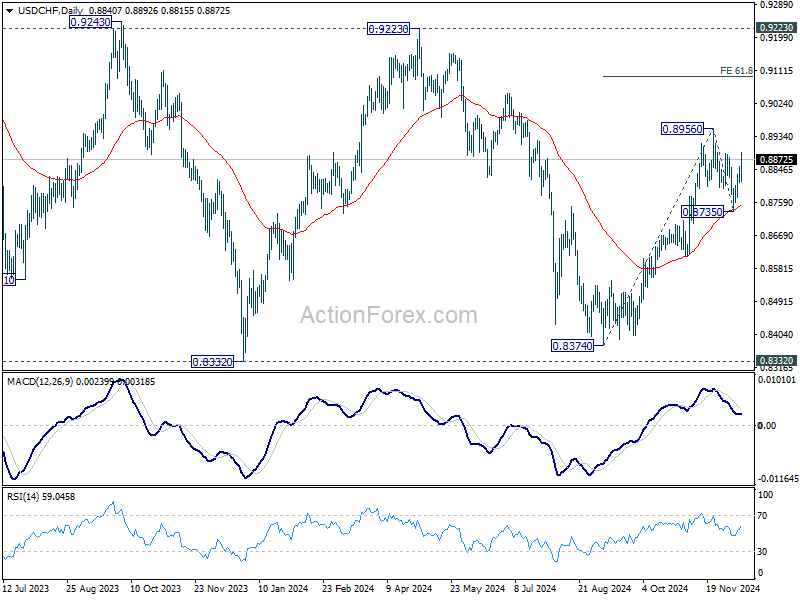
Technical studies on daily chart are still mixed as 14-d momentum dips further in the negative territory, conflicting MA’s in bullish configuration and formation of 10/200 DMA golden cross.
Near-term bias is expected to remain with bulls while the price stays above broken Fibo 50% level at 0.8841, reinforced by 20DMA, which reverted to support.
Caution on loss of 200DMA pivot (0.8824) which would signal recovery stall and shift near-term focus to the downside.
Res: 0.8869; 0.8893; 0.8902; 0.8917.
Sup: 0.8841; 0.8824; 0.8814; 0.8780.
Bitcoin and Ethereum on the Verge of Breaking Resistance
Market Picture
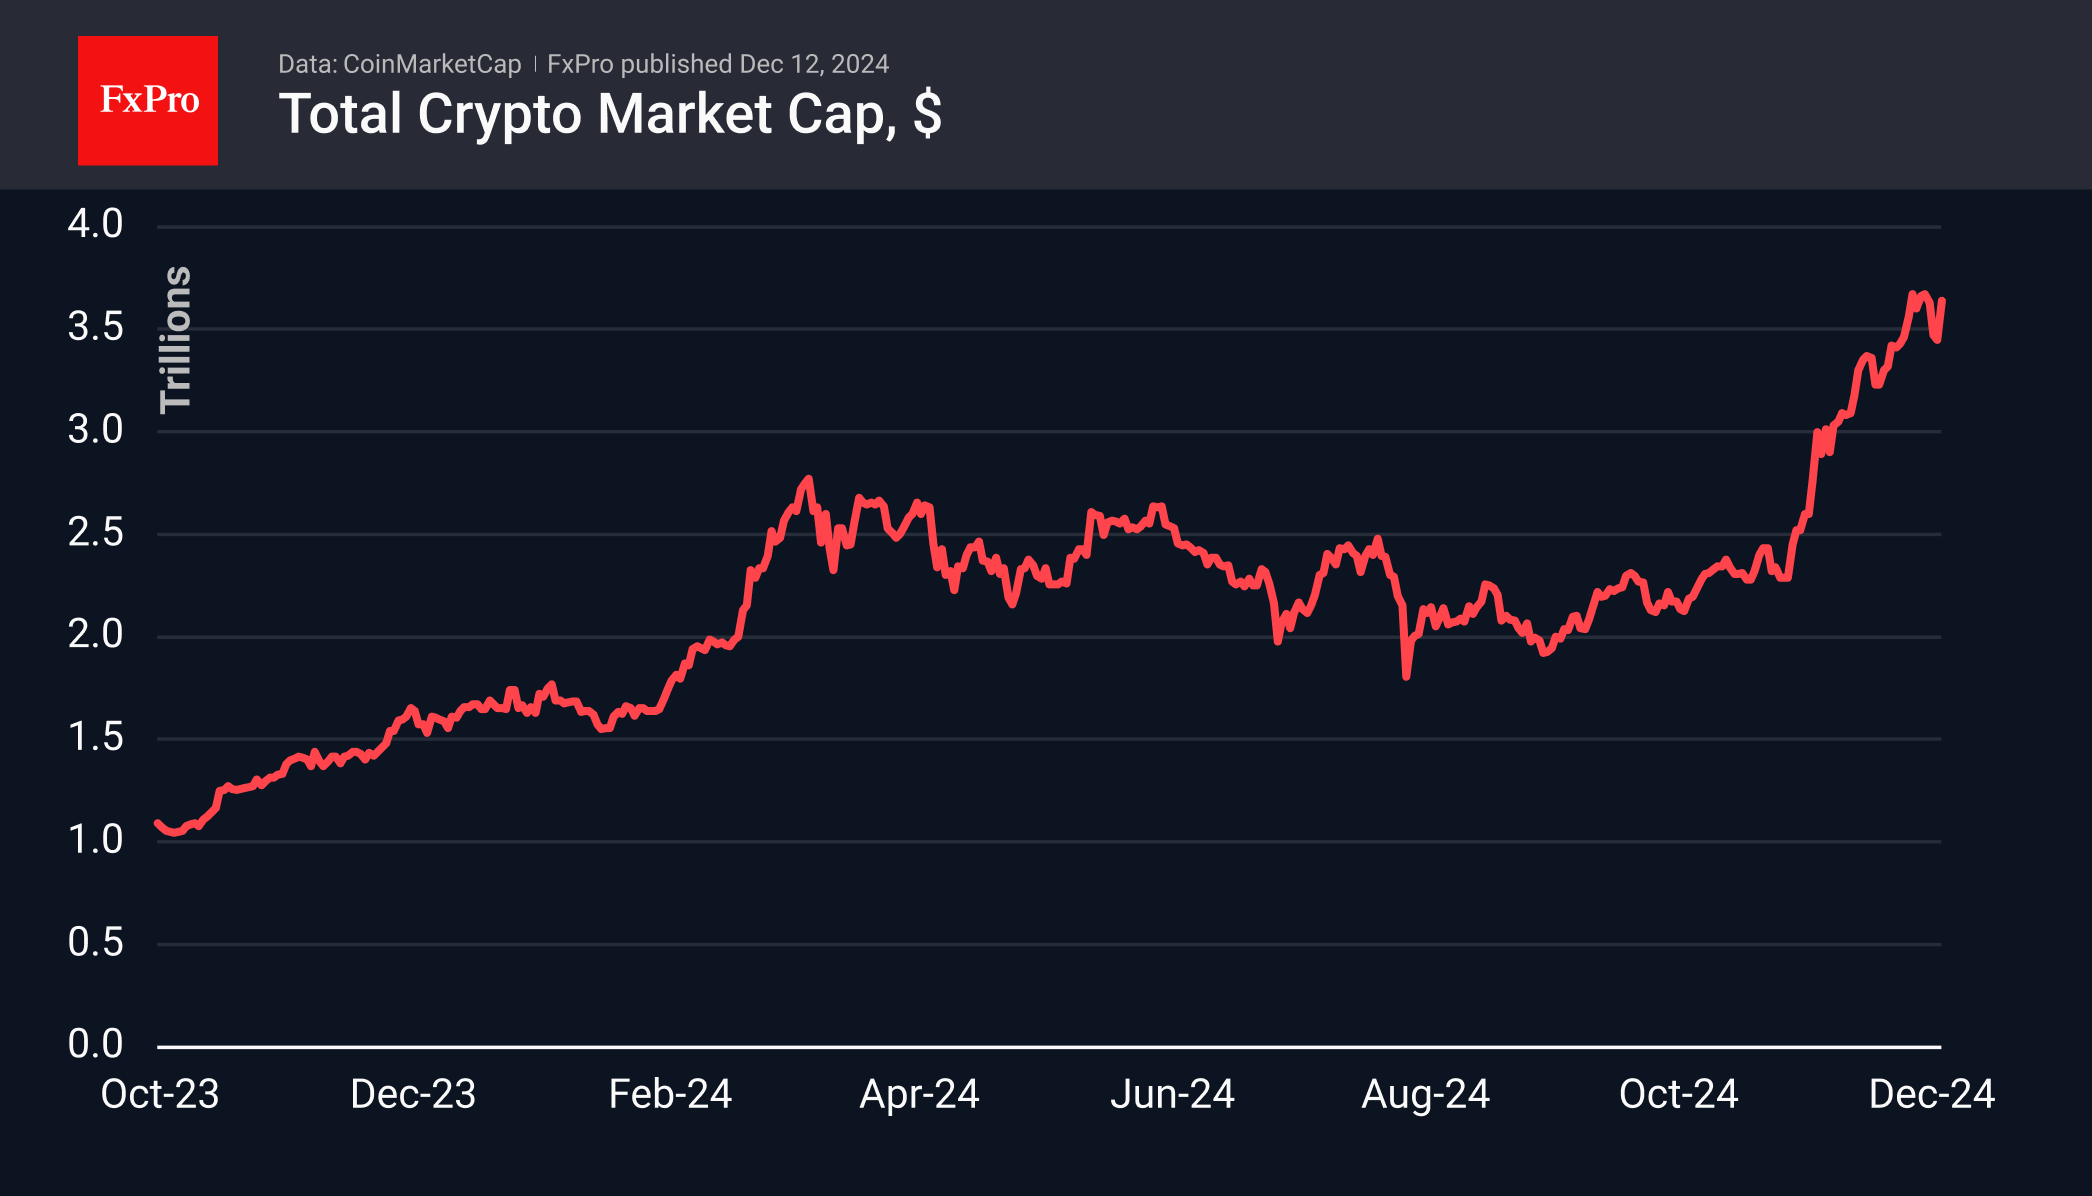
Crypto market capitalisation jumped 5% in 24 hours to $3.64 trillion. Optimism in the US stock market pushed Bitcoin above $100K, bringing buyers back into altcoins. The Cryptocurrency Sentiment Index returned to extreme greed territory at 83.
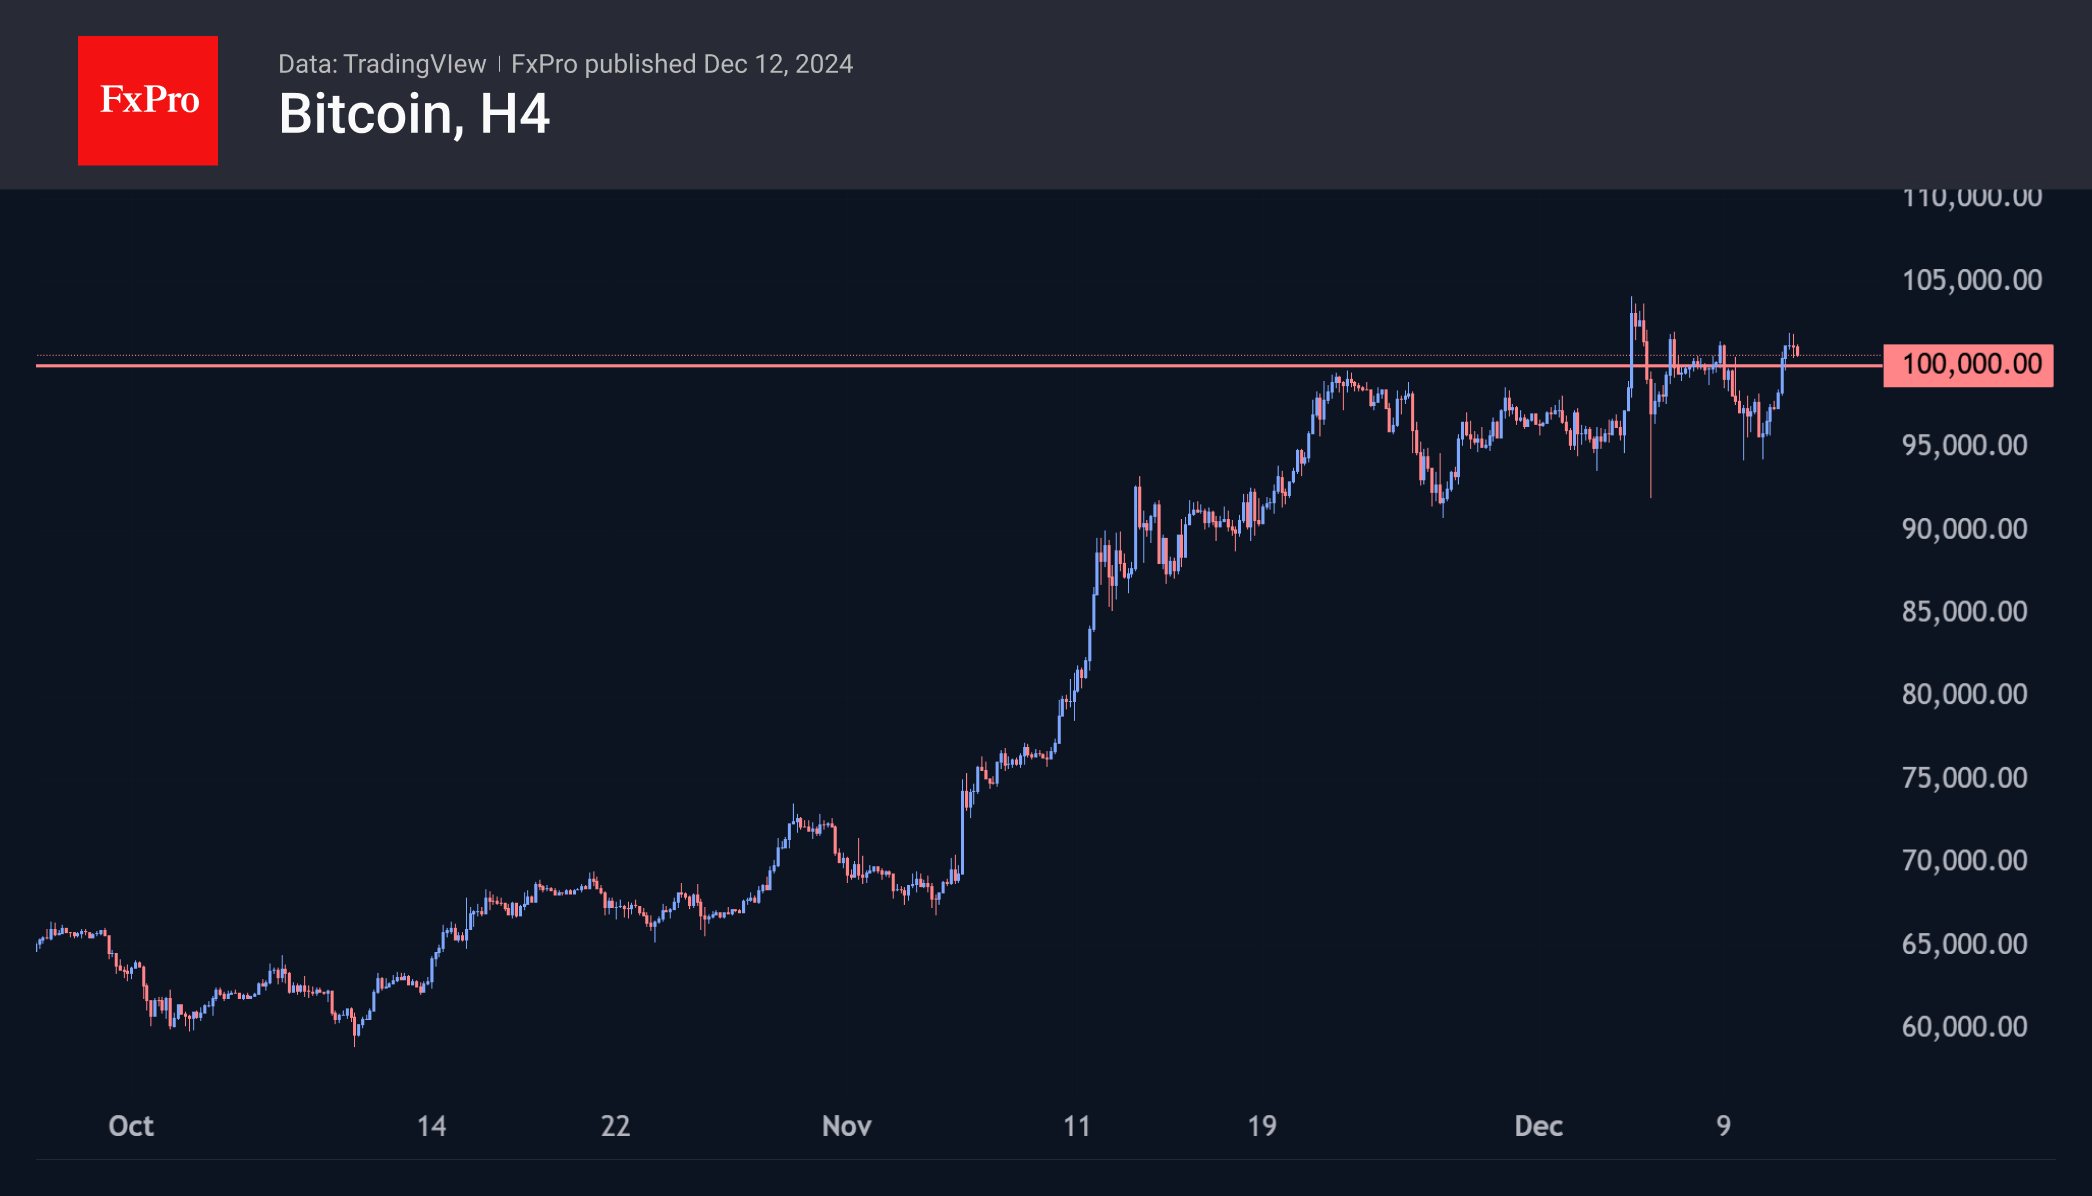
Bitcoin climbed just above $101.5K, meeting solid resistance for the past seven days. Current levels are above the psychologically important round level and the consolidation area of the last three weeks. It may be risky to talk about a breakout to new highs and a complete eradication of bearish sentiment. A confirmation of buying strength could see a quick rally into the $120,000 area.
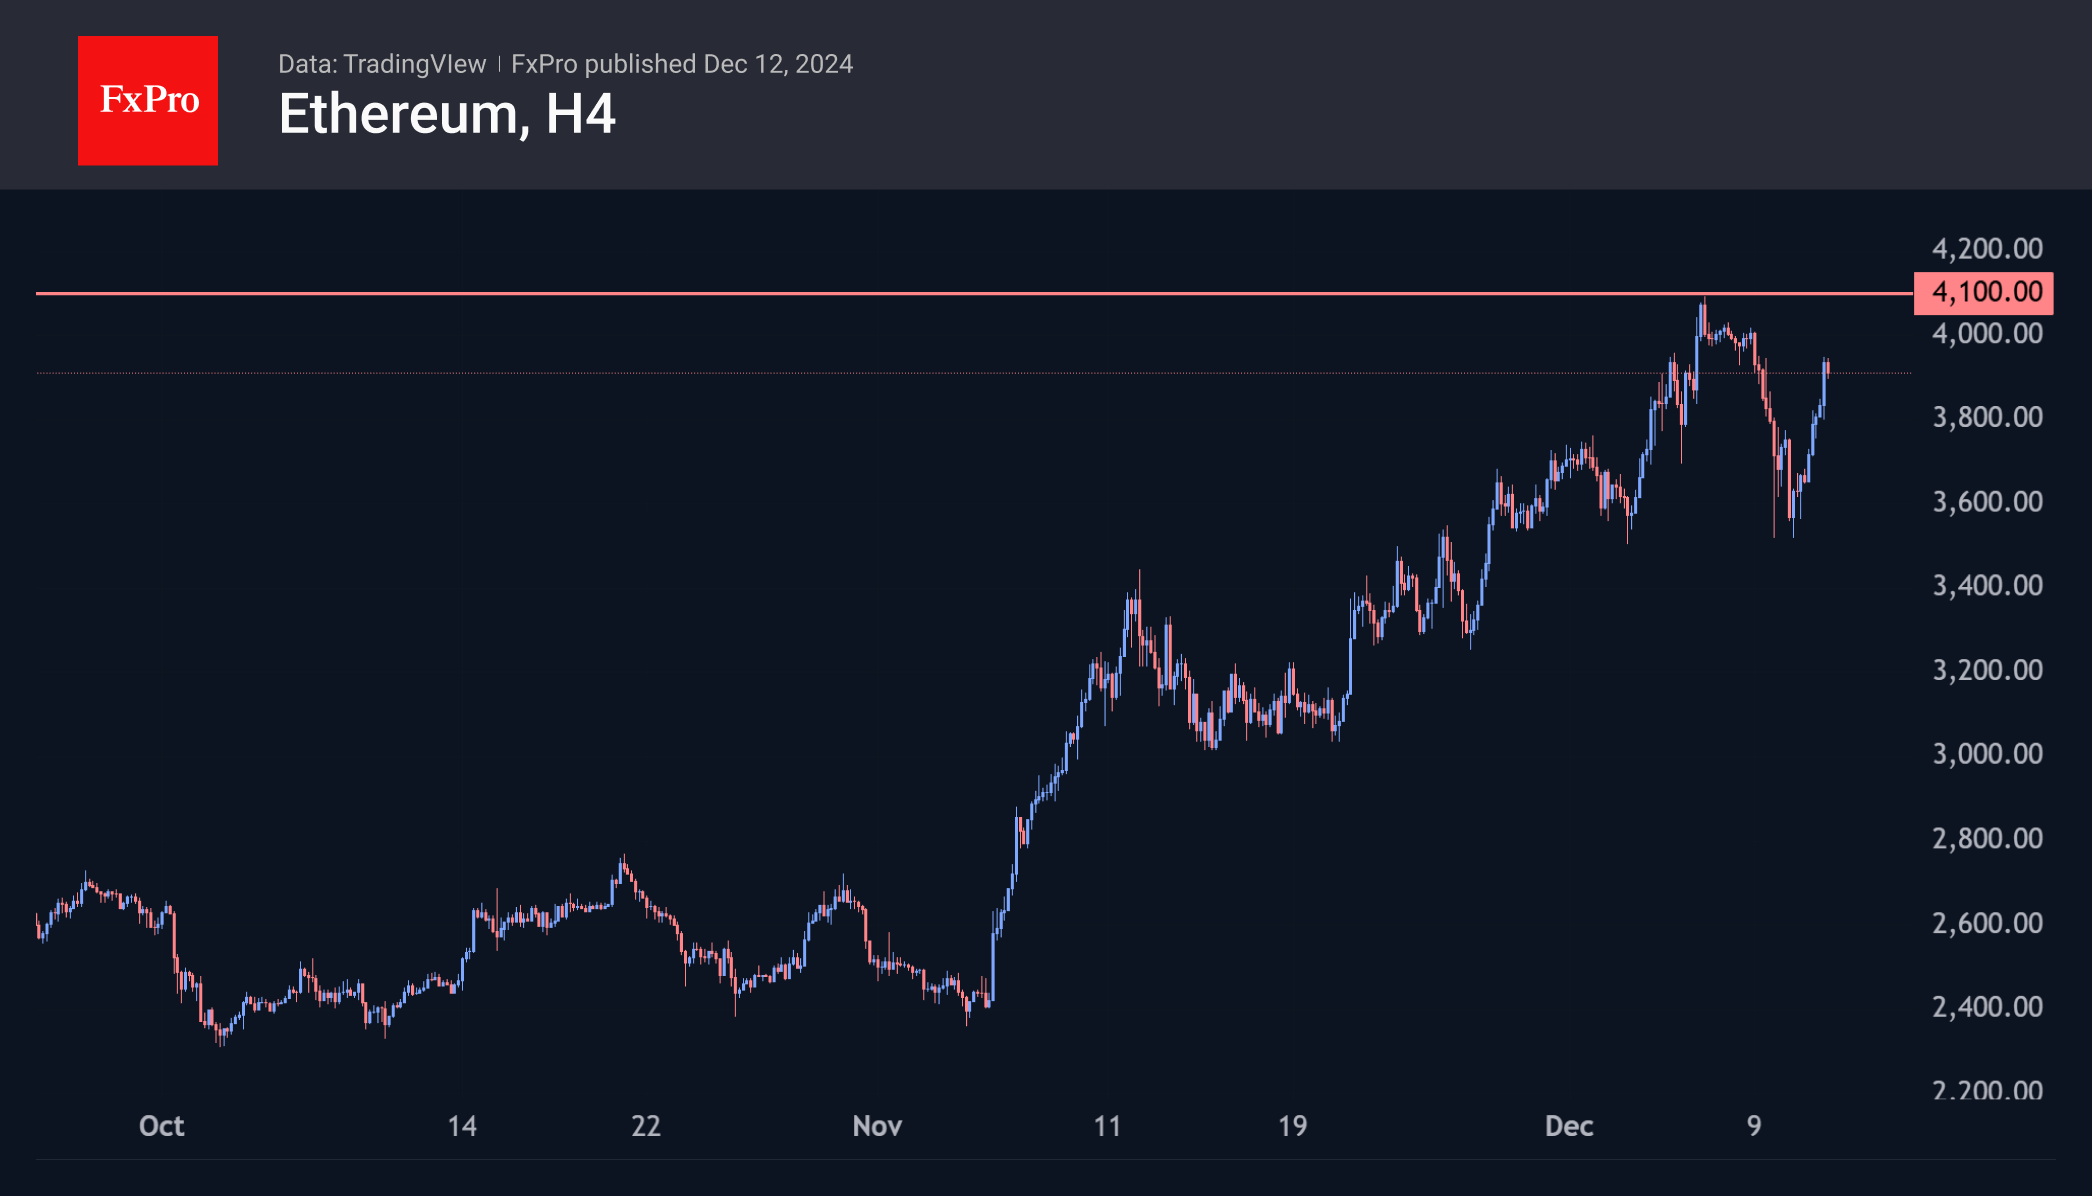
Ethereum rose 7% on the day to $3900, doubling bitcoin’s performance. However, this is a rally and not a breakout to new highs, which makes the path easier. It will be interesting to watch the price action as it enters the $4100 area. From this level, there are roughly equal chances of a sharp reversal to the downside and a break of resistance with a flight to the $5000 area.
News Background
Ray Dalio, founder of Bridgewater Associates, said he would invest in the first cryptocurrency amid the inevitable debt crisis and the coming fall of fiat currencies. He urged people to ‘stay away from leveraged assets like bonds and own hard money like gold and bitcoin’.
According to options protocol Derive, Ethereum’s chances of hitting $5,000 in December have fallen below 10%. However, according to EthHub founder Eric Conner, a ‘supply crisis’ is looming for the coin. Ethereum ETFs attracted more than $305 million on 10 December alone.
Circle and the Binance exchange have entered a strategic partnership to expand the USDC stablecoin’s global presence. The exchange will also list the ‘stablecoin’ as an asset in its corporate treasury.
On 11th December, shares of the Japanese exchange Coincheck began trading on the Nasdaq, becoming the second crypto exchange on the US stock market after Coinbase.
According to K33 Research, the volume of liquidations in altcoins ($1.75bn) on 10 December was the largest since 19 May 2021, while the cryptocurrency market ($12.8bn) hit a record high. This signals a reduction in excessive leverage and sets the stage for more sustainable growth.
Gold Price Hits Monthly High
The XAU/USD chart shows:
→ A notable peak in November near the $2716 level (indicated by the first arrow);
→ Yesterday, gold surpassed this peak, reaching a new one-month high.
Factors Supporting Bullish Sentiment
→ Yesterday’s US Consumer Price Index data met analysts’ expectations. This bolstered market speculation about a Federal Reserve interest rate cut in December, enhancing the appeal of non-yielding assets like gold.
→ Geopolitical tensions in Eastern Europe and the Middle East, along with uncertainty surrounding the policy direction and tariff plans of newly elected US President Donald Trump, are contributing to gold’s safe-haven appeal.

Technical Analysis of XAU/USD
Gold prices have been rising since August within a channel, with the lower boundary marked as Support 1. However, in November, Support 2—a line with a gentler slope—gained relevance, potentially signalling waning demand strength.
If buyers are indeed losing momentum, a price reversal from the fresh high could occur. This would suggest a false bullish breakout above the mid-November peak near $2715. Early trading action on the XAU/USD chart this morning lends weight to this potential scenario.
Start trading commodity CFDs with tight spreads. Open your trading account now or learn more about trading commodity CFDs with FXOpen.
This article represents the opinion of the Companies operating under the FXOpen brand only. It is not to be construed as an offer, solicitation, or recommendation with respect to products and services provided by the Companies operating under the FXOpen brand, nor is it to be considered financial advice.
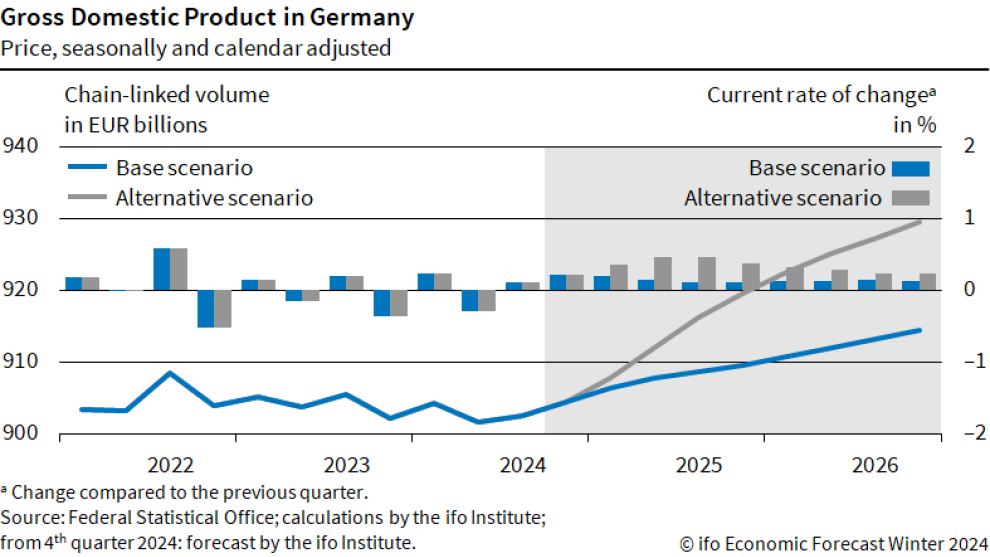
Ifo flags structural risks as German economy faces subdued 0.4% growth next year
Germany's economy is forecast to contract by -0.1% in 2024, according to the Ifo Institute. The economy has been "treading water for five years", with growth stalled amid structural challenges.
The institute presents two possible trajectories for 2025: sluggish growth of just 0.4% if structural issues persist, or a recovery to 1.1% if economic policy reforms support industrial revival.
Timo Wollmershäuser, Head of Forecasts at Ifo, stated, “It is not yet clear whether the current phase of stagnation is a temporary weakness or one that is permanent and hence a painful change in the economy.”
He noted that Germany's export sector, once a key driver of growth, has become "increasingly decoupled from global economic development," with competitiveness eroding, particularly in industrial goods outside Europe.
In a pessimistic scenario, this weakness could lead to "creeping deindustrialization," while an optimistic outcome would depend on supportive policies enabling manufacturing to expand production capacities. Such measures could, in turn, boost private consumption and reduce the high savings rate, providing further stimulus to the economy.
USD/CHF Daily Outlook
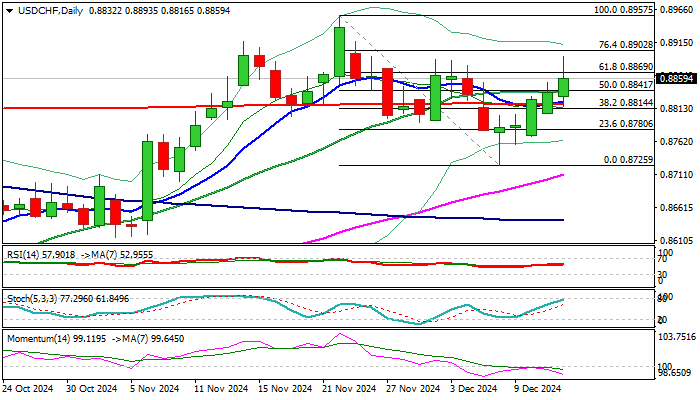
Daily Pivots: (S1) 0.8817; (P) 0.8836; (R1) 0.8860; More…
Outlook in USD/CHF remains unchanged as corrective fall from 0.8956 should have completed at 0.8735 after hitting 55 D EMA. Intraday bias remains on the upside for retesting 0.8956 high first. Firm break there will resume the whole rise from 0.8374. Next target is 61.8% projection of 0.8374 to 0.8956 from 0.8735 at 0.9095. This will remains the favored case as long as 0.8735 support holds, in case of retreat.
In the bigger picture, price actions from 0.8332 (2023 low) are currently seen as a medium term corrective pattern, with rise from 0.8374 as the third leg. Overall outlook will continue to stay bearish as long as 0.9223 resistance holds. Break of 0.8332 low is in favor at a later stage when the consolidation completes.
EUR/USD Daily Outlook
Daily Pivots: (S1) 1.0471; (P) 1.0505; (R1) 1.0531; More...
Intraday bias in EUR/USD remains neutral and outlook is unchanged. On the downside, break of 1.0471 support will suggest that corrective recovery from 1.0330 has completed at 1.0629, and fall from 1.1213 is ready to resume. Intraday bias will be back on the downside for 1.0330 first, and then 61.8% projection of 1.0936 to 1.0330 from 1.0629 at 1.0254. Also, in this case, sustained trading below 1.0404 key fibonacci level will carry larger bearish implication.
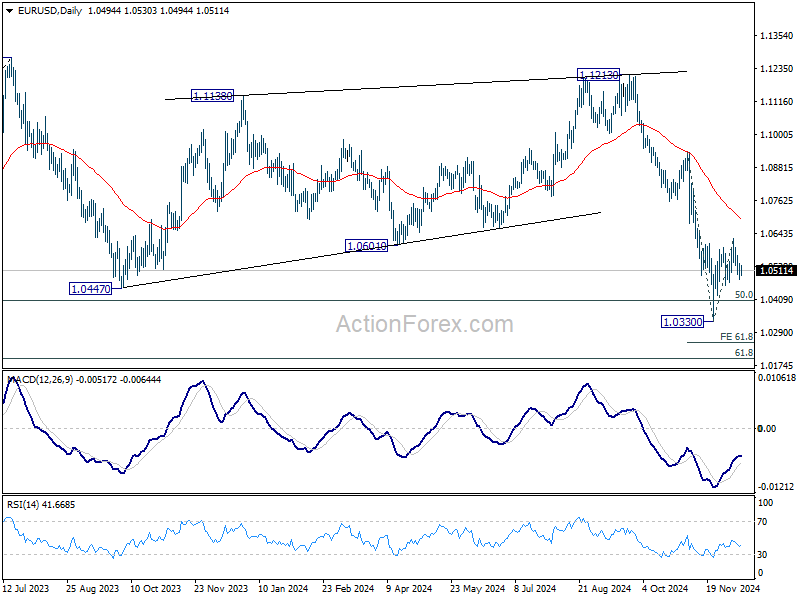
In the bigger picture, focus stays on 50% retracement of 0.9534 (2022 low) to 1.1274 at 1.0404. Strong rebound from this level will keep price actions from 1.1273 (2023 high) as a medium term consolidation pattern only. However, sustained break of 1.0404 will raise the chance that whole up trend from 0.9534 has reversed. That would pave the way to 61.8% retracement at 1.0199 first. Firm break there will target 0.9534 low again.
GBP/USD Daily Outlook
Daily Pivots: (S1) 1.2715; (P) 1.2749; (R1) 1.2784; More...
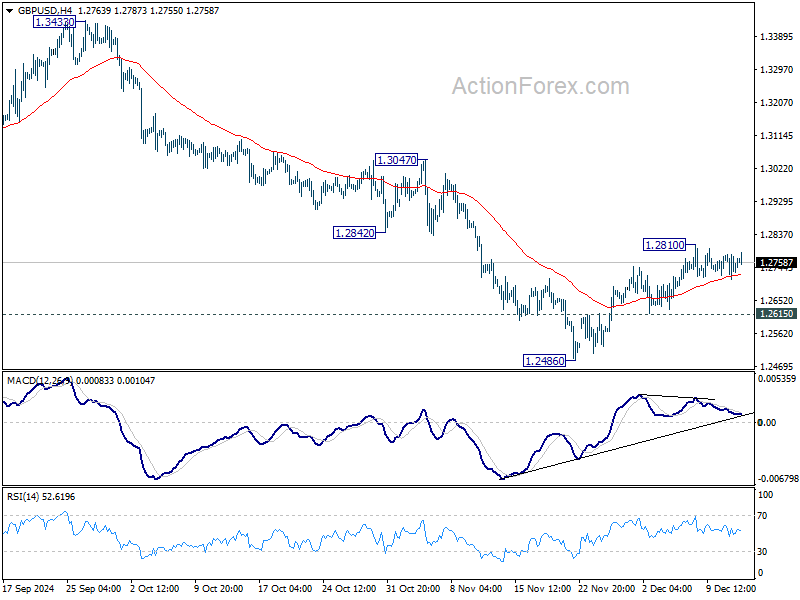
No change in GBP/USD's outlook as consolidations continue below 1.2810 temporary top. Rebound from 1.2486 short term bottom could still extend higher. But outlook will stay bearish as long as 55 D EMA (now at 1.2834) holds. On the downside, below 1.2615 minor support will bring retest of 1.2486 first. Firm break there will target 1.2298 cluster support zone. However, sustained break of 55 D EMA will argue that the near term trend has reversed, and targets 1.3047 resistance for confirmation.
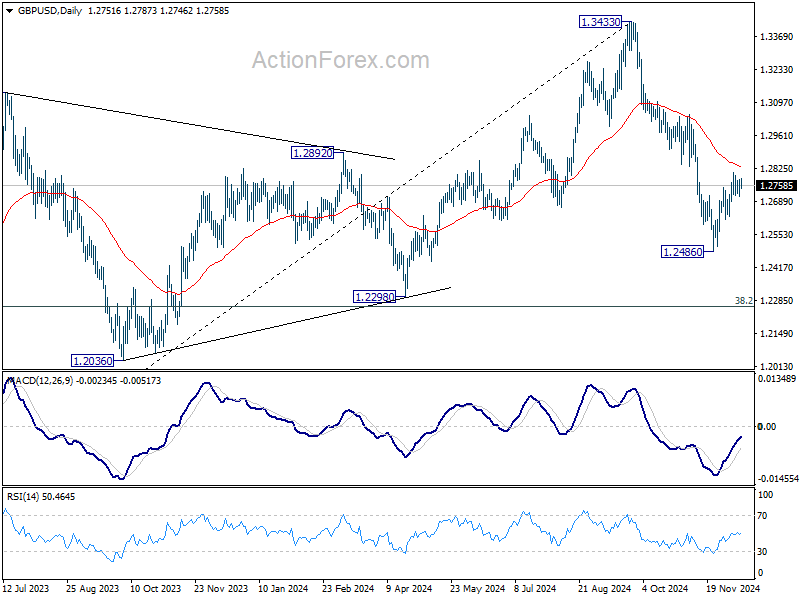
In the bigger picture, price actions from 1.3433 medium term are seen as correcting whole up trend from 1.0351 (2022 low). Deeper decline could be seen to 38.2% retracement of 1.0351 to 1.3433 at 1.2256, which is close to 1.2298 structural support. But strong support is expected there to bring rebound to extend the corrective pattern.
USD/JPY Daily Outlook
Daily Pivots: (S1) 151.37; (P) 152.11; (R1) 153.20; More...
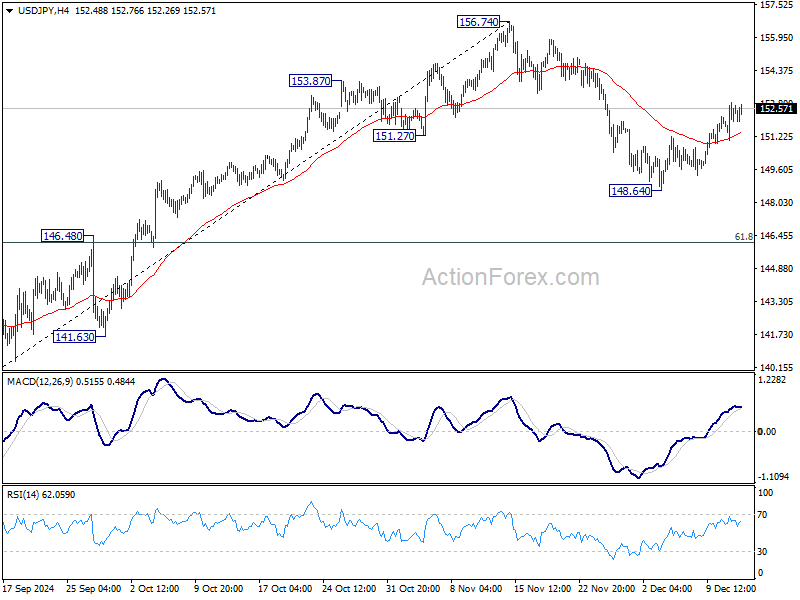
Intraday bias in USD/JPY stays on the upside for retesting 156.74 high. Current development suggests that rise from 139.57 might still be in progress and break of 156.74 will confirm resumption. For now, this will be the favored case as long as 148.64 support holds, in case of retreat.
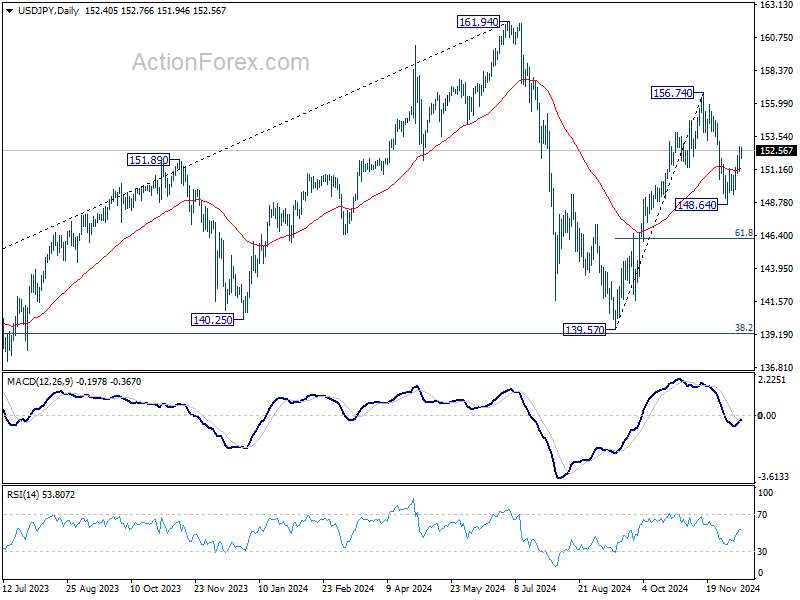
In the bigger picture, price actions from 161.94 are seen as a corrective pattern to rise from 102.58 (2021 low). The range of medium term consolidation should be set between 38.2% retracement of 102.58 to 161.94 at 139.26 and 161.94. Nevertheless, sustained break of 139.26 would open up deeper medium term decline to 61.8% retracement at 125.25.
AUD/USD Daily Report
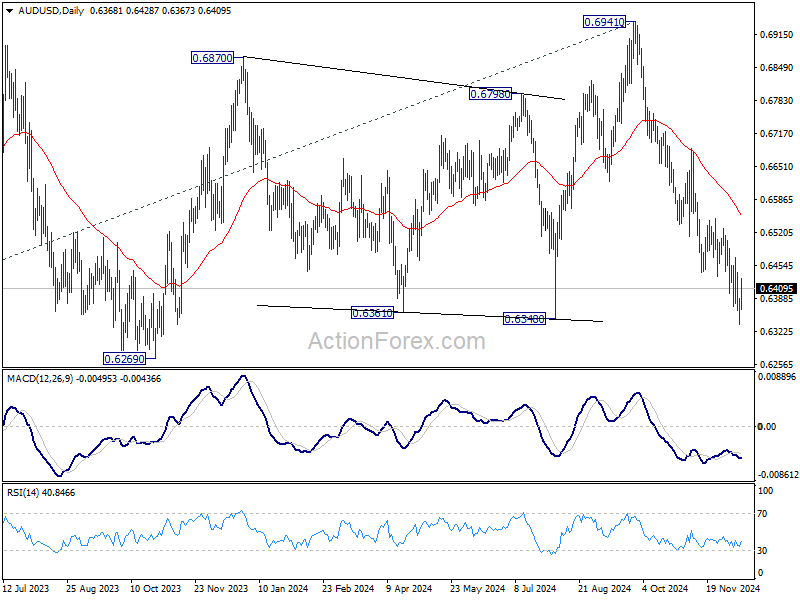
Daily Pivots: (S1) 0.6341; (P) 0.6365; (R1) 0.6393; More...
Intraday bias in AUD/USD is turned neutral again with current recovery. Some consolidations would be seen above 0.6336 temporary low. But outlook will stay bearish as long as 55 D EMA (now at 0.6554) holds. Break of 0.6336 will resume the fall from 0.6941 to 0.6269 support next.
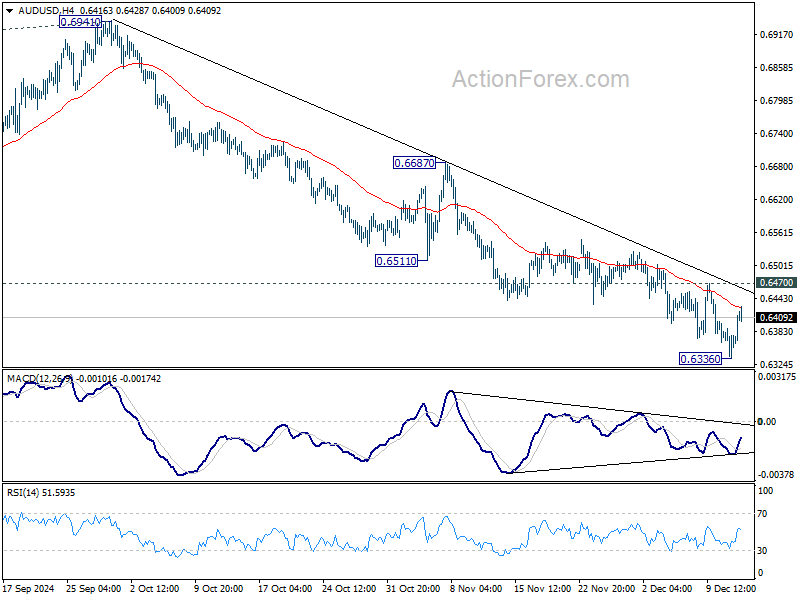
In the bigger picture, price actions from 0.6169 (2022 low) are seen as a medium term consolidation to the down trend from 0.8006. More sideway trading could be seen above 0.6169, but overall outlook will stay bearish as long as 0.6941 resistance holds. Firm break of 0.6169 will resume the down trend to 61.8% projection of 0.8006 to 0.6169 from 0.6941 at 0.5806 next.