Sample Category Title
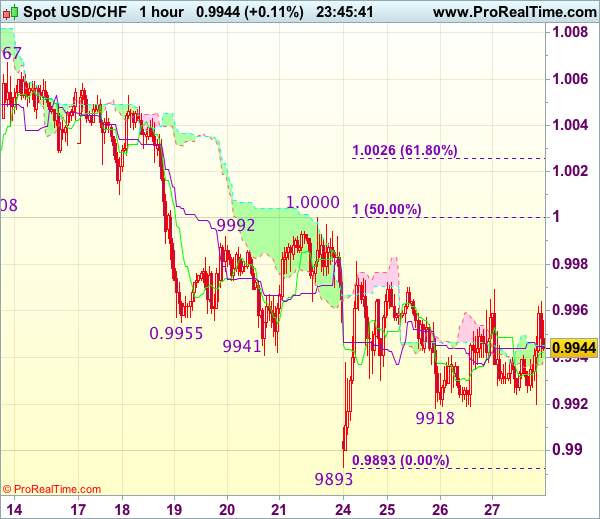
Trade Idea Wrap-up: USD/CHF – Stand aside
USD/CHF - 0.9948
Most recent candlesticks pattern : N/A
Trend : Near term down
Tenkan-Sen level : 0.9942
Kijun-Sen level : 0.9945
Ichimoku cloud top : 0.9945
Ichimoku cloud bottom : 0.9939
New strategy :
Stand aside
Position : -
Target : -
Stop : -
As dollar has rebounded again after holding above indicated support at 0.9918, retaining our view that further consolidation above this week’s low at 0.9893 would be seen and another bounce to 0.9980-85 cannot be ruled out, however, break of 1.0000-08 resistance is needed to signal low is formed at 0.9893, bring rebound to 1.0025-30 (61.8% Fibonacci retracement of 1.0108-0.9893) but price should falter below resistance at 1.0067.
On the downside, only a drop below said support at 0.9918 would signal the rebound from 0.9893 (this week’s low) has ended, bring retest of this level, break there would confirm recent decline from 1.0108 has resumed and extend weakness to 0.9865-70 (2 times extension of 1.0108-1.0008 measuring from 1.0067), however, reckon support at 0.9831 would hold from here, bring rebound later. As near term outlook is still mixed, would be prudent to stand aside for now.
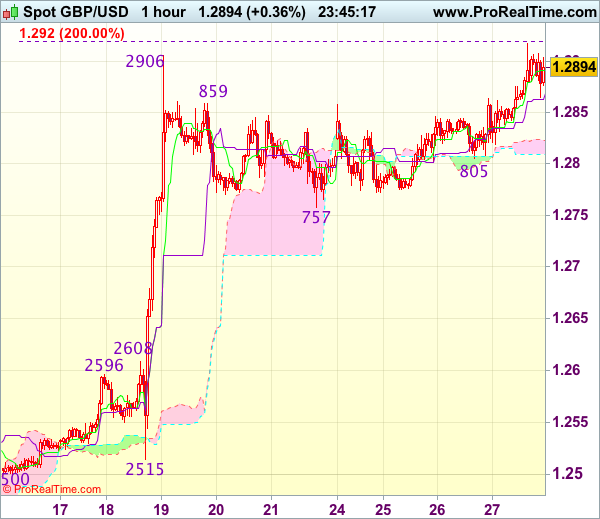
Trade Idea Wrap-up: GBP/USD – Buy at 1.2830
GBP/USD - 1.2886
Most recent candlesticks pattern : N/A
Trend : Near term up
Tenkan-Sen level : 1.2888
Kijun-Sen level : 1.2869
Ichimoku cloud top : 1.2834
Ichimoku cloud bottom : 1.2818
Original strategy :
Buy at 1.2845, Target: 1.2945, Stop: 1.2810
Position : -
Target : -
Stop : -
New strategy :
Buy at 1.2830, Target: 1.2945, Stop: 1.2795
Position : -
Target : -
Stop : -
As cable has risen again after finding renewed buying interest at 1.2805, signaling the pullback from 1.2906 has ended at 1.2757 earlier and retest of this level would be seen, break there would confirm recent upmove has resumed for headway o 1.2920-30 (2 times extension of 1.2365-1.2575 measuring from 1.2500), then 1.2950 but reckon 1.2990-00 (1.236 times projection of 1.2109-1.2616 measuring from 1.2365 and psychological resistance) would hold on first testing.
In view of this, would not chase this rise here and would be prudent to buy cable on pullback as downside should be limited to 1.2825-30. Below said support at 1.2805 would abort and prolong consolidation, then risk another corrective fall to indicated previous support at 1.2757 but price should stay well above 1.2710 (50% Fibonacci retracement of 1.2515-1.2906), bring another rise.
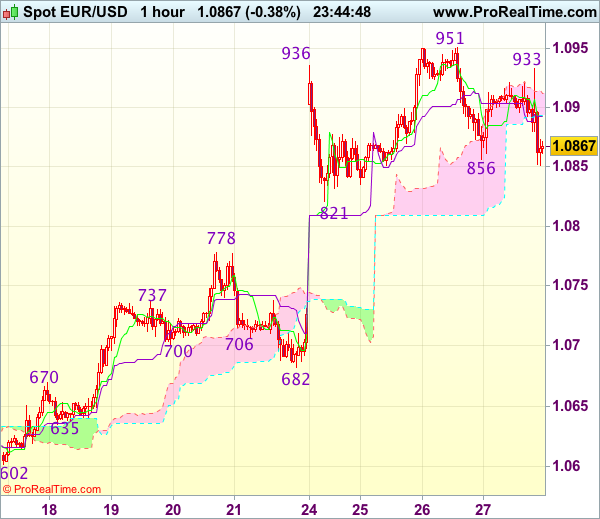
Trade Idea Wrap-up: EUR/USD – Stand aside
EUR/USD - 1.0861
Most recent candlesticks pattern : N/A
Trend : Near term up
Tenkan-Sen level : 1.0892
Kijun-Sen level : 1.0892
Ichimoku cloud top : 1.0912
Ichimoku cloud bottom : 1.0893
New strategy :
Stand aside
Position : -
Target : -
Stop : -
As the single currency met renewed selling interest at 1.0933 and has slipped again in NY morning, retaining our view that further consolidation below yesterday’s high of 1.0951 would be seen and test of support at 1.0821 cannot be ruled out, however, still reckon downside would be limited to 1.0800 and previous resistance at 1.0778 should hold from here, bring another rise later.
On the upside, above 1.0895-00 would bring test of said intra-day resistance at 1.0933 but break there is needed to signal the pullback from 1.0951 has ended, bring retest of this level later. Once this level is penetrated, this would extend recent upmove from 1.0340 low to 1.0975-80 and possibly towards 1.1000 which is likely to hold on first testing due to loss of momentum.
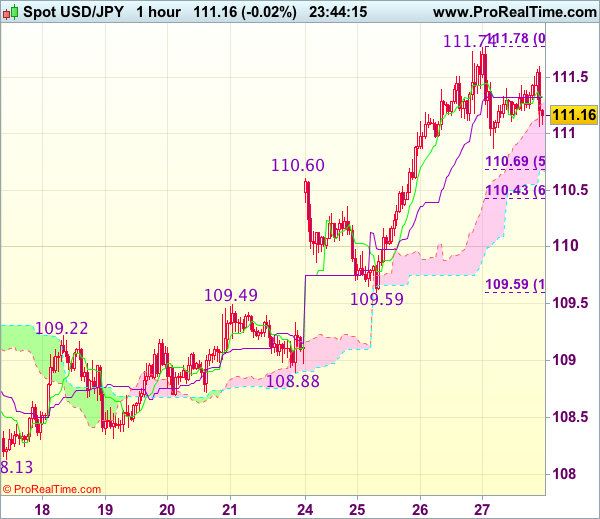
Trade Idea Wrap-up: USD/JPY – Buy at 110.45
USD/JPY - 111.49
Most recent candlesticks pattern : N/A
Trend : Near term up
Tenkan-Sen level : 111.34
Kijun-Sen level : 111.33
Ichimoku cloud top : 111.27
Ichimoku cloud bottom : 110.67
Original strategy :
Buy at 110.70, Target: 111.70, Stop: 110.35
Position : -
Target : -
Stop : -
New strategy :
Buy at 110.45, Target: 111.55, Stop: 110.10
Position : -
Target : -
Stop : -
As the greenback retreated after rising to 111.78 yesterday, suggesting consolidation below this level would be seen and pullback to 110.60-69 (previous resistance and 50% Fibonacci retracement of 109.59-111.78) cannot be ruled out, however, reckon downside would be limited and 110.40-45 (61.8% Fibonacci retracement) should hold, bring another rise later, above said resistance at 111.78 would signal recent rise from 108.13 low has resumed and extend further gain to 111.90-00 but overbought condition should prevent sharp move beyond another previous resistance at 112.20.
In view of this, would not chase this rise here and would be prudent to buy dollar on subsequent pullback as 110.40-45 (61.8% Fibonacci retracement of 109.59-111.78) should limit downside. Only break of 110.05-10 (50% Fibonacci retracement of 108.32-111.78) would defer and suggest top is possibly formed, risk weakness to 109.80 but break of support at 109.59 is needed to provide confirmation.
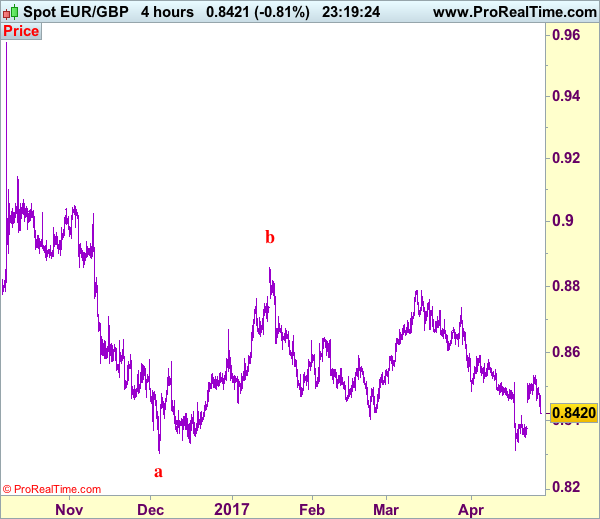
Trade Idea: EUR/GBP – Stand aside
EUR/GBP - 0.8424
Recent wave: Major double three (A)-(B)-(C)-(X)-(A)-(B)-(C) is unfolding and 2nd (A) has possibly ended at 0.6936.
Trend: Near term down
New strategy :
Stand aside
Position : -
Target : -
Stop : -
Although the single currency broke above previous resistance at 0.8512, lack of follow through buying and the subsequent retreat from 0.8531 suggest consolidation with mild downside bias would be seen and weakness to 0.8400 cannot be ruled out, however, reckon downside would be limited to 0.8370-75 and as long as support at 0.8351 holds, prospect of another rebound remains.
On the upside, expect recovery to be limited to 0.8470-75 and 0.8500 should hold, bring further consolidation later. Only break of said resistance at 0.8531 would add credence to our view that a temporary low has been formed at 0.8312 and extend the rebound from there for retracement of recent decline to 0.8550, however, reckon resistance at 0.8580 would limit upside and 0.8600-10 would hold from here. As near term outlook is mixed, would be prudent to stand aside in the meantime.
Our preferred count is that, after forming a major top at 0.9805 (wave V), (A)-(B)-(C) correction is unfolding with (A) leg ended at 0.8400 (A: 0.8637, B: 0.9491 and 5-waver C ended at 0.8400. Wave (B) has ended at 0.9413 and impulsive wave (C) has either ended at 0.8067 or may extend one more fall to 0.8000 before prospect of another rally. Current breach of indicated resistance at 0.9043 confirms our view that the (C) leg has ended and bring stronger rebound towards 0.9150/54, then towards 0.9240/50.
Trade Idea: USD/CAD – Buy at 1.3600
USD/CAD - 1.3663
Recent wave: Only wave v of c has ended at 0.9407 and wave C of major A-B-C correction is underway for headway to 1.4700
Trend: Near term up
Original strategy :
Buy at 1.3500, Target: 1.3650, Stop: 1.3440
Position: -
Target: -
Stop: -
New strategy :
Buy at 1.3600, Target: 1.3750, Stop: 1.3540
Position: -
Target: -
Stop:-
As the greenback has surged again after finding renewed buying interest at 1.3530 yesterday, adding credence to our view that recent upmove is still in progress and bullishness remains for further gain to 1.3700-10, however, near term overbought condition should prevent sharp move beyond 1.3750-60 and reckon 1.3790-00 would hold on first testing, risk from there is seen for a retreat to take place later.
In view of this, would not chase this rise here and would be prudent to buy again on pullback as 1.3600 should limit downside. Only below said support at 1.3530 would abort and signal a temporary top is formed instead, risk correction to 1.3500 and later towards 1.3450-60 but support at 1.3411 should remain intact, bring another upmove later.
To recap, wave B from 1.3066 is unfolding as an a-b-c and is sub-divided as a: 1.2192, b: 1.2716 and wave c is a 5-waver with i: 1.1983, ii: 1.2506, extended wave iii with minor iii at 1.0206, wave iv ended at 1.0781 and wave v as well as wave iii has ended at 0.9931, hence the subsequent choppy trading is the wave iv which is unfolding as (a)-(b)-(c) with (a) leg of iv ended at 1.0854, followed by (b) leg at 1.0108 and (c) leg as well as the wave iv ended at 1.0674. The wave v is sub-divided by minor wave (i): 0.9980, (ii): 1.0374, (iii): 0.9446, (iv): 0.9913 and (v) as well as v has possibly ended at 0.9407, therefore, consolidation with upside bias is seen for major correction, indicated target at 1.3700 and 1.4000 had been met and further gain to 1.4700 would be seen later.

ECB More Confident on Growth, but Inflation Remains an Overhang
ECB left the monetary policy and the QE program unchanged in April. That is, the main refi rate, marginal lending rate and the depo rate stayed unchanged at 0%, 0.25% and -0.40%, respectively. Meanwhile, the asset purchase program would be continued at the pace of 60B euro per month from this month, through to the end of December 2017, or beyond, if necessary.
Policymakers acknowledged the increasingly solid economic recovery in the Eurozone. The key message about the economy was that the recovery in the bloc is strengthening and broadening, whilst risks are diminishing. Yet, they refrained from discussing about potential tapering, likely due to concerns over subdued core inflation. The single currency initially rose following comments about the economic recovery. Gains were, however, pared as inflation has remained an overhang.
Euro area recovery becoming increasingly solid
On the global and domestic economic outlook, policymakers suggested that "the signs of a stronger global recovery and increasing global trade suggest that foreign demand should increasingly add to the overall resilience of the economic expansion of the euro area". They also acknowledged that "incoming data since March confirm that the cyclical recovery of the euro area economy is becoming increasingly solid, and that downside risks have further diminished". However, inflation has remained weak. The statement suggested that "measures of underlying inflation remain low and are expected to rise only gradually over the medium term, supported by our monetary policy measures, the expected continuing economic recovery and the corresponding gradual absorption of slack"
Substantial monetary accomodation still needed
Policymakers believed that the ultra accommodative stimulus measures should continue as the prolonged weakness on underlying inflation is worrisome. The ECB reiterated that "a very substantial degree of monetary accommodation is still needed for underlying inflation pressures to build up and support headline inflation in the medium-term". As President Mario Draghi indicated at the press conference, "in terms of my criteria the (inflation) assessment hasn't really changed". The statement also reaffirmed that key ECB interest rates would "remain at present or lower levels for an extended period of time, and well past the horizon of the net asset purchases"
Draghi: We discuss policies, not politics
Regarding euro's strength after Sunday's French election, Draghi noted that "In the Governing Council meetings we discuss policies, not politics" and "we don't do monetary policy based on likely election outcomes". Yet, he admittedly suggested that the central bank does "internalise the information that comes from the effects that political uncertainty may affect our medium-term outlook". As far as we understand, Draghi personally prefers Emmanuel Macron to Marine Le Pen.
Durable Shipments Point to Solid Q1 Equipment Spending
Durable goods orders increased less than expected in March amid weakness in non-transportation items. Core capital goods orders posted a modest gain, while shipments point to solid rise in Q1 equipment spending.
Cooler Orders, but Recovery in Business Spending intact
Consistent with some of the softening that has begun to emerge in the survey data of the factory sector, growth in durable goods orders cooled in March. New orders rose 0.7 percent versus the market's expectation for a 1.3 percent gain. That said, the weaker-than-expected outturn for March follows an upward revision to February. Orders for February were revised up from a 1.8 percent increase to a 2.3 percent gain.
As has been the case in recent months, transportation was a key source of strength, but due to the long lead time of aircraft orders. Nondefense aircraft orders rose by $941 million (+7.0 percent), while orders for defense aircraft increased by $1.0 billion (+26.1 percent).
Following the recent weakness in auto sales and production, new orders for motor vehicles and parts fell 0.8 percent, the second straight decline. Autos have been one of the strongest areas for orders over the expansion, but we do not expect it to provide much support in the coming months given the high levels of dealer inventories and weakening sales environment for new vehicles.
Excluding transportation, orders missed the mark by falling 0.2 percent versus expectations for a 0.4 percent gain. In addition, relative to the headline's revisions, growth in February was revised up only 0.2 percentage points.
Nondefense capital goods orders excluding aircraft, our preferred bellwether of business equipment spending, rose 0.2 percent last month. Growth in core orders has slowed since the end of the last year, in part due to weaker orders for computers & electronics and machinery. Nevertheless, nondefense capital goods orders are running at a 6.0 percent three-month average annualized pace, compared to contracting as recently as this past summer. While that still looks sluggish relative to "soft" indicators on the factory sector, including the ISM manufacturing index, both the hard and soft data indicate a decent pace of expansion for manufacturing and business spending.
Q1 Equipment Spending Looks Solid
While orders were somewhat disappointing in March, shipments suggest business spending for the first quarter as a whole was solid. Nondefense shipments, a good guide of equipment spending, rose 1.3 percent last month. Real equipment spending has begun to claw its way back from the hole dug from late 2015 through most of last year, and today's reading on shipments points to a strong increase in Q1 business spending in tomorrow's GDP report. The slower pace of core capital goods orders, however, suggests a more moderate clip in Q2, but that business spending should continue to grow in the months ahead.
Pound Hits 7-Month High on Strong UK Retail Sales Data, Soft US Numbers
GBP/USD has posted slight gains on Thursday, continuing the upward trend we've seen for most of this week. In the North American session, the pair is trading just below the 1.29 line. Earlier, the pound touched a high of 1.2917, its highest level since early October. The pound received a boost from CBI Realized Sales, which climbed to 38 points, crushing the estimate of 6 points. In the US, key indicators were dismal. Core Durable Goods, Unemployment Claims, and Pending Home Sales all missed their estimates. On Friday, the UK releases Preliminary GDP, with an estimate of 0.4%. The US will publish Advance GDP, which is expected to gain 1.3%. We'll also get a look at UoM Consumer Sentiment.
In the UK, there was good news on the consumer front, as retailers reported a sharp increase in sales volume. With Brexit constantly in the minds of the markets, consumer spending indicators are being closely monitored. The British economy has performed better than many analysts (and the BoE) expected, but the markets are understandably nervous about the impact that Brexit will have on the economy, given the fact that the EU is Britain's largest trading partner. On Friday, the economy will get a report card in the form of Preliminary GDP, and traders should treat this event as a market-mover.
Talks over Britain's departure from the EU are expected to be lengthy and difficult, and EU leaders don't appear to be in a generous mood, as they met in Brussels this week to discuss a united front in the Brexit talks. Britain wants any deal to include financial services, but the Europeans are working on a draft that would exclude the financial sector unless it is governed by EU rules. There are also likely to be sharp disagreements over the size of Britain's debt to the EU, among other major issues. For now, the British government is concentrating on the June election, but after that things could get nasty between the sides. If the Brexit talks run into trouble, market sentiment could take a dive and that could spell trouble for the British pound.
One of President Trump's most important campaign platforms was overhauling the US tax code. Trump finally announced his long-awaited tax plan on Wednesday. The proposal calls for sharp reductions for both individuals and corporations. The plan calls for three tax brackets for individuals – 10%, 25% and 35%. The corporate sector would also see significant tax relief, with the corporate tax rate dropping from 35% to 15%, and the tax on multinationals' overseas profits lowered from 35% to 10%. However, any tax reform proposals from the White House will require a stamp of approval from Congress, so Trump's proposal should be viewed as a blueprint that is a long way off from becoming law. Trump's proposal was short on details, although government officials are praising it as one of the largest tax cuts and broadest overhauls of the tax system in history. There hasn't been much reaction from the currency markets, with the dollar showing limited movement against the pound and other major currencies in Thursday trading.
Draghi Manages to Avoid ECB Exit Speculation
Headlines
European equity markets opened significantly weaker, but managed to erase some of the losses throughout dealings. US equity markets opened slightly stronger with gains of 0.1%-0.2%
The ECB kept its monetary policy and forward guidance unchanged. For the first time, the ECB said that while risks to the economic outlook remain tilted to the downside, they are moving closely to broadly balanced. The central bank didn't discuss changing its forward guidance or its future exit strategy.
The US Congress began moving to extend Friday's budget deadline until May 5 and is expected to pass legislation allowing more time to finalize a spending deal to fund the federal government through September and avoid a shutdown.
Growth in durable goods orders cooled more than expected in March (from 2.3% to 0.7%) as demand for computers, machinery and fabricated metal products slid. Weekly jobless claims increased more than forecast (to 257k), but remain near historically low levels. The trade deficit widened less than predicted (to -$64.8B).
German inflation strengthened more than economists forecast in April, rebounding after an Easter-holiday related dip the previous month. German CPI accelerated to 2% Y/Y from 1.5% Y/Y the previous month, exceeding the 1.9% Y/Y forecast and hitting the ECB's inflation target.
Economic confidence in the eurozone surpassed its pre-debt crisis peak and hit the highest level since September 2007 as the bloc's growth prospects have been lifted by buoyant consumers and a brightening global outlook. The EC's April economic sentiment gauge rose from 108 to 109.6 in April, ahead of forecasts (108.2).
In a surprise move, Sweden's central bank extended its bond buying programme and slightly delayed future rate hikes despite strong domestic growth and cautious optimism about global economy activity. EUR/SEK rose from 9.55 to 9.65.
In her toughest message so far on Brexit, Ms Merkel pledged the EU would put its interests first and manage the negotiations in its chosen way. This involves dealing first with the exit bill, in defiance of Britain's demands for the financial issues to be handled at the same time as talks on a new relationship. The order was "not reversible".
Rates
Draghi manages to avoid ECB exit speculation
European eco data released ahead of the ECB's policy meeting confirmed the new reality the central bank has to face. EC EMU economic confidence hit the highest level in nearly a decade and German inflation rebounded in April following an Easter-related dip to hit 2%. Weakness on European stock markets and a lower oil price prevailed though, allowing the Bund to gain some ground ahead of the policy decision and Draghi's press conference. US eco data printed mixed. Weekly jobless claims unexpectedly ticked up, but remain near historically low levels. The trade balance deficit widened less than expected.
Headline and core durable goods orders slightly disappointed, but the backward-looking proxy for the investment component in GDP growth (capital goods shipment) beat consensus. Markets ignored the US data.
The ECB decided to keep its monetary policy and forward guidance unchanged. Risks to the economic outlook remain tilted to the downside, but are moving closer to "broadly balanced". It's the first time since very long that the ECB, unanimously, recognizes improving growth momentum. Headline inflation is expected to hover around current levels for the remainder of the year, but core inflation is only forecast to rise gradually over time. Therefore, the central bank looks through the headline number and stands ready to increase its asset purchase programme in size and/or duration if the outlook worsens. Draghi said that the central bank didn't discuss the exit strategy or changing the forward guidance. Overall, the ECB did his utmost best today not to trigger more speculation about the start of the ECB's normalisation process. The Bund currently trades slightly above levels recorded ahead of the meeting, erasing the downtick after Draghi said that the Eurozone economic recovery is becoming "increasingly solid".
At the time of writing, the German yield curve declines by 1.9 bps (30-yr) to 2.5 bps (2-yr). Changes on the US yield curve vary between -0.2 bps (2-yr) and +1.2 bps (30-yr). On intra-EMU bond markets, 10-yr yield spread changes versus Germany range between -4 bps (Portugal) and +2 bps (Greece).
The Italian treasury sold the on the run 5-yr BTP (€2.5B 1.2% Apr2022) and 10- yr BTP (€2.75B 2.2% Jun2027). The combined amount sold was the maximum of the €4.25-5.25B target range with a 1.45 auction bid cover, which is relatively high for Italian standards.
Currencies
Draghi stays soft, preventing further euro gains
Trading in the major cross rates entered calmer waters after the sharp swings earlier this week. The Trump tax plan didn't provide clear guidance for the dollar. The focus for euro trading turned to the ECB's press conference. ECB Draghi kept his balanced message. Better growth is still counterbalanced by soft underlying inflation. For now, there is no strong enough reason for FX markets to anticipate early steps to policy normalisation. EUR/USD lost marginally ground and trades in the 1.0860 area. USD/JPY trades little changed in the 111.40 area.
Overnight, the BOJ as expected left its policy unchanged. The bank was rather upbeat on the economy. Still, it cut its inflation forecast for this fiscal year, suggesting that no policy tightening is to be expected soon. The Bank expected the 2% target to be reached during the fiscal year 2018/19. The reaction of the yen was modest. USD/JPY hovered in the 111.20/25 area. Asian equities traded with limited losses following WS. EUR/USD hovered little changed in the 1.09 area.
This morning, the swings in the major cross rates were modest. Risk sentiment was slightly risk-off as investors took some further profit on this week's equity rally The German (regional) inflation data came out on the stronger side of expectations. However, they hardly affected European yields or the single currency. Investors probably remained cautious ahead of the ECB policy decision and Draghi's press conference. EUR/USD hovered in a very tight range close to, but mostly slightly above 1.09. USD/JPY hovered in the 111.20/40 area.
The ECB as expected left its policy and the forward guidance unchanged. EUR/USD touched an intraday low in the 1.0880 area after the ECB's policy announcement. The ECB president indicated that the recovery is becoming more solid and as downside risks have diminished. At the same time, the underlying inflation pressures remain subdued. EUR/USD rebounded temporary to the 1.0920 area on the positive growth assessment, but the gains evaporated soon. Currency investors find it too early to positioning for further policy normalisation. EUR/USD trades again in the 1.0860 area. The US durable orders data and jobless claims were mixed to slight softer than expected but we didn't see a sustained impact on the dollar. Risk sentiment in the US remains a bit cautious. USD/JPY is trading stable in the mid 111.50 area. For now, EUR/USD is 'capped' in the 1.09 area as the ECB didn't provide enough evidence that further steps to policy normalisation will be taken.
Sterling holds strong as retail data stay strong
Sterling already received a good bid yesterday and the rebound continued today. We didn't see any specific story behind move. Cable jumped temporary north of 1.29 and then settled near the big figure. EUR/GBP drifted back south to the 0.8450 area. At noon, the CBI reported sales were very strong at a multi month high, supported by good weather conditions. The report was sterling supportive, but sterling had already realized an important part of its intraday gains at the time of the publication of the report. In the afternoon, EUR/GBP trading joined the euro swings caused by the ECB press conference. EUR/GBP finally declined further in line with EUR/USD. The pair trades currently in the 0.8435 area. Cable is changing hands in the 1.2880 area. So, regardless of the performance of the dollar and the euro, sterling shows solid resilience.