Sample Category Title
(ECB) Monetary Policy Decisions
At today's meeting the Governing Council of the ECB decided that the interest rate on the main refinancing operations and the interest rates on the marginal lending facility and the deposit facility will remain unchanged at 0.00%, 0.25% and -0.40% respectively. The Governing Council continues to expect the key ECB interest rates to remain at present or lower levels for an extended period of time, and well past the horizon of the net asset purchases.
Regarding non-standard monetary policy measures, the Governing Council confirms that the net asset purchases, at the new monthly pace of €60 billion, are intended to run until the end of December 2017, or beyond, if necessary, and in any case until the Governing Council sees a sustained adjustment in the path of inflation consistent with its inflation aim. The net purchases will be made alongside reinvestments of the principal payments from maturing securities purchased under the asset purchase programme. If the outlook becomes less favourable, or if financial conditions become inconsistent with further progress towards a sustained adjustment in the path of inflation, the Governing Council stands ready to increase the programme in terms of size and/or duration.
The President of the ECB will comment on the considerations underlying these decisions at a press conference starting at 14:30 CET today.
Trade Idea: GBP/USD – Buy at 1.2850
GBP/USD – 1.2897
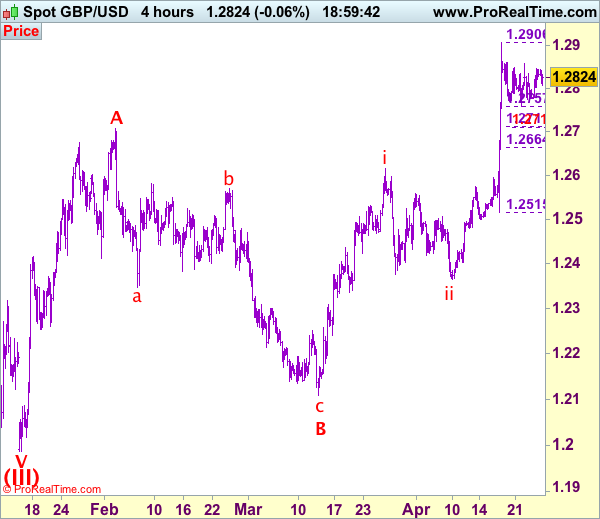
Recent wave: Wave V of larger degree wave (III) has ended at 1.1986 and major correction has commenced from there for gain to 1.3000 and 1.3140-50
Trend: Near term up
Original strategy :
Buy at 1.2710, Target: 1.2910, Stop: 1.2650
Position: -
Target: -
Stop: -
New strategy :
Buy at 1.2850, Target: 1.3000, Stop: 1.2790
Position: -
Target: -
Stop:-
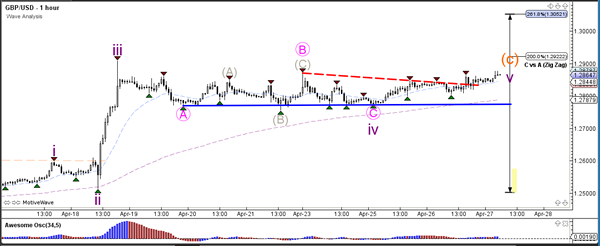
As cable has risen again and broke above indicated previous resistance at 1.2906, adding credence to our bullish view that recent upmove is still in progress and upside bias remains for further gain to 1.2950, then towards psychological resistance at 1.3000 but near term overbought condition should limit upside and 1.3050 and price should falter below 1.3100. We are keeping our view that the wave c as well as larger degree wave B has ended at 1.2109, hence impulsive wave C has commenced from there with wave i of C ended at 1.2616, follow by a correction to 1.2365 (end of wave ii) and wave iii rally is unfolding, hence further gain to indicated upside targets would be seen.
Our preferred count on the daily chart is that cable's rebound from 1.3500 (wave (A) trough) is unfolding as a wave (B) with A ended at 1.7043, followed by triangle wave B and wave C as well as wave (B) has ended at 1.7192, the subsequent selloff is the larger degree wave (C) which is still unfolding with minor wave (III) of larger degree wave 3 ended at 1.1986, hence wave (IV) correction is in progress which could either be a triangle wave (IV) of a complex formation but upside should be limited to 1.3500 and price should falter well below 1.4000, bring another decline in wave (V) of 3 for weakness to 1.1500, then 1.1200.
On the downside, whilst initial pullback to 1.2845-55 is likely, as long as support at 1.2805 holds, bullishness remains for another upmove. A drop below this level would defer and suggest top is possibly formed but only break of support at 1.2757 would add credence to this view, bring retracement of recent upmove to 1.2700-10 later.
PRE-ECB Analysis: EUR/USD Breakouts Possible
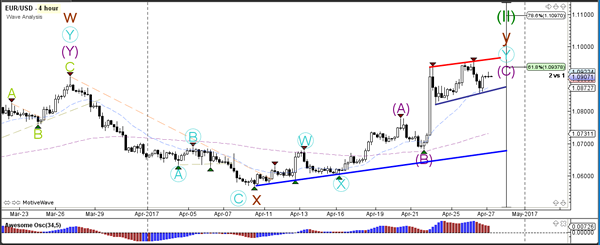
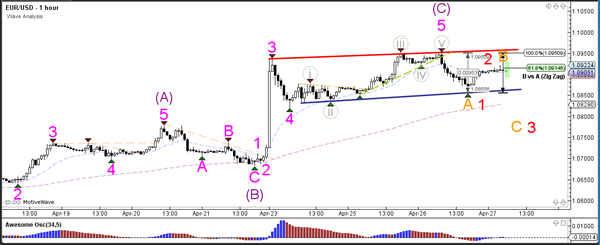
The European Central Bank is set to keep its ultra-easy policy stance firmly in place this Thursday afternoon (11:30 AM GMT) but may acknowledge better growth prospects, setting the stage for a small signal as early as June about an eventual reduction of stimulus. Volatility on EUR/USD could be expected.
Technically the EUR/USD 4h chart shows bullish momentum but anything can happen during the ECB conference. Yesterday we had a successful live EUR/USD entry on Wednesday's Live webinar that made more than 40 pips as of now. The break of 1.0950 should retest 1.0965 and possibly 1.0990-1.1020. However, the break of 1.0820 could close the retail gap around 1.0777 level. Be careful with risk allocation and using of VPS tool is advised
Trade Idea: GBP/JPY – Buy at 142.30
GBP/JPY - 143.68
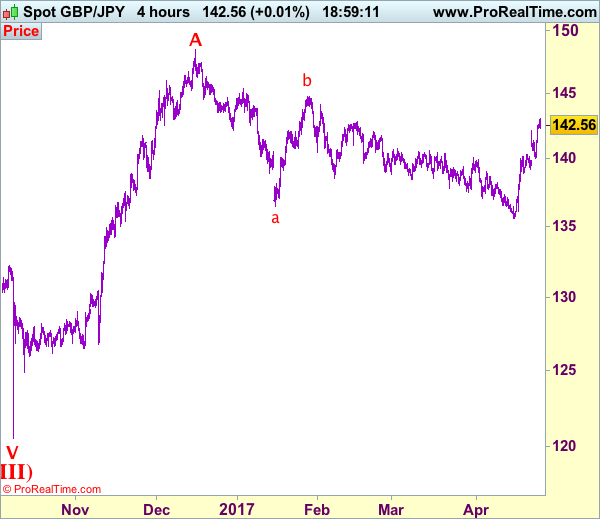
Recent wave: Medium term low formed at 120.50 and (A)-(B)-(C) major correction has commenced with (A) leg ended at 148.45, hence wave (B) is unfolding for retreat to 131.00-10.
Trend: Near term up
Original strategy:
Buy at 141.70, Target: 143.70, Stop: 141.00
Position: -
Target: -
Stop: -
New strategy :
Buy at 142.30, Target: 144.30, Stop: 141.70
Position: -
Target: -
Stop:-
As sterling has surged again after brief pullback, adding credence to our view that recent upmove from 135.60 has resumed and upside bias remains for this move to extend further gain to 144.00-10, however, near term overbought condition should prevent sharp move beyond 144.40-50 and reckon previous chart resistance at 144.75 would remain intact, bring retreat later.
In view of this, would not chase this rise here and would be prudent to buy sterling on pullback as 142.30-40 should limit downside. Below 141.60-65 would defer and suggest top is possibly formed instead, risk correction to 141.00-10 but downside should be limited to 140.55-60 and price should stay well above support at 140.10, bring another rally.
Our preferred count is that larger degree wave V with circle is unfolding from 251.12 with wave (I) 219.34, (II): 241.38 and wave (III) is subdivided into 1: 192.60, 2: 215.89 (23 Jul 2008) and wave 3 ended at 118.87 earlier in 2009. The correction from there to 162.60 is wave 4 which itself is a double three and is labeled as first a-b-c ended at 151.53, followed by wave x at 139.03, 2nd a ended at 162.60, 2nd b at 146.75 and 2nd c leg of wave 4 ended at 163.00. Therefore, the decline from 163.00 to 116.85 is now treated as wave 5 which also marked the end of larger degree wave (III), hence wave (IV) major correction has commenced for retracement of the wave (III) from 241.38 and upside target at 183.95-00 (50% Fibonacci retracement of the wave (II) from 241.38) had been met, a drop below 160.00 would suggest wave (IV) has ended at 195.85, bring decline in wave (V) for initial weakness to 130 (already met) and 120.
U.S Dollar Deflated on Trump U-turn
April 27: Five things the markets are talking about
The not so 'mighty' U.S dollar has pared gains overnight as investors digest details of the Trump administration's tax-reform plan and deal with the Presidents U-turn on NAFTA.
The Presidents tax plan includes deep reductions in business taxes and major changes to the individual tax system. The administration also said it would introduce a one-time tax break meant to encourage U.S corporations to repatriate earnings stashed overseas. However, the market has largely brushed off the plan, weighed by uncertainties over the timeline.
Sticking with uncertainties, Trump, for now, has done a U-turn on pulling out of NAFTA after talking with leaders from Mexico and Canada. Both currencies were able to take back much of yesterday's intraday losses - +1.1% and +0.5% respectively.
On the central bank front, the ECB will set monetary policy later this morning (07:45 am EST rate announcement, 08:30 am press conference). With officials of late indicating little chance of a policy change, the focus will be on any signals from President Draghi that the central bank is debating an exit from its extraordinary stimulus. Overnight, The Bank of Japan (BoJ) remained on hold as expected.
Tomorrow, U.S. GDP is due and it's projected to show the economy expanded at a +1.0% annualized rate in Q1, the weakest pace in a year.
1. Global equities mixed reaction
In Japan, stocks fell for the first time in six days, tracking the retreat on Wall Street's disappointment over the U.S tax plan. The Nikkei fell -0.2%, while the broader Topix dipped -0.05%. The BoJ kept its policies unchanged while lowering its inflation forecast and emphasizing that any exit from its monetary easing remains "far away."
In Hong Kong, financials helped lift the Hang Seng (+0.5%) to its highest close in 20-months, but the China Enterprises Index lost -0.6%.
In China, stocks ended higher with small caps bolstering sentiment. The blue-chip CSI300 index rose +0.1%, while the Shanghai Composite Index added +0.4%.
In Europe, equity indices are trading lower as market participants await the ECB's monetary policy decision. Banking and financial stocks trading notably lower in the Eurostoxx, while energy stocks in the FTSE 100 are trading lower on oil price pull backs.
U.S stocks are set to open relatively flat.
Indices: Stoxx50 -0.5% at 3,560, FTSE -0.5% at 7,250, DAX -0.4% at 12,428, CAC-40 -0.4% at 5,264, IBEX-35 -0.9% at 10,668, FTSE MIB -0.6% at 20,703, SMI -0.2% at 8,815, S&P 500 Futures flat
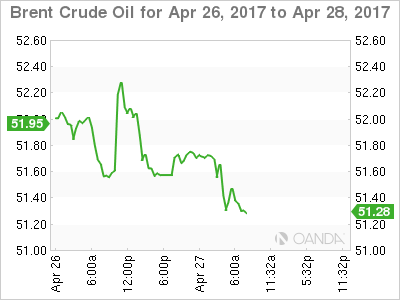
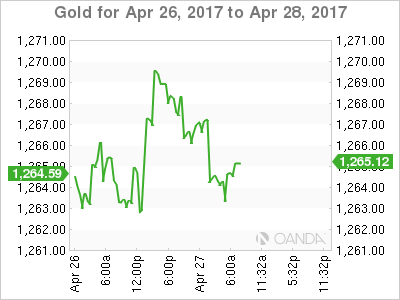
2. Oil prices fall on oversupply, gold steady
Oil prices again are on the back foot, weighed down by oversupply issues, but the losses remain somewhat contained on hopes that OPEC and non-OPEC members will agree to extend production cuts to try to rebalance the market.
Ahead of the U.S open, Brent crude futures are down -60c at +$51.22 a barrel, while U.S light crude (WTI) is down -55c at +$49.07 - both benchmarks are down -10% from this month's peak.
Inventory reports this week stated ample supplies in all key markets despite efforts led by OPEC and Russia to cut output by -1.8m bpd in H1.
OPEC is discussing extending its cuts into H2, but crude "bulls" are getting concerned as producers face an uphill battle with oil inventories atop of record levels in many parts of the world.
Yesterday's EIA report showed a drop in crude oil stocks, but gasoline inventories surged as refiners produced more fuel than the market could consume.
Gold prices have edged down overnight as global risk sentiment diminishes, but scepticism over Trump's tax reform plan has limited the losses. Spot gold is down -0.3% at +$1,264.60 per ounce.
3. Few surprises from Central Banks rate announcements
The ECB is expected to hold off any 'hawkish' tendencies ahead of France's second round Presidential elections (May 7). Sweden's Riksbank has extended QE for another six-months, while the BoJ did was expected and stood pat.
Sweden Central Bank (Riksbank) has surprised the market with its "dovish" stance - repo rate unchanged (+0.5%), however, it has extended its government bond buying for another six months citing global uncertainties. The policy statement noted that it would take longer before inflation stabilized around +2% and indicated that to support the upturn in inflation, monetary policy "needed to be somewhat more expansionary." The program was set to expire next month.
In Governor Kuroda's post BoJ rate decision press conference he noted that the economic cycle was strengthening and that BoJ would continue with QQE until prices hit its inflation target. He reiterated the view that they would achieve the +2% inflation target during the financial year 2018/19 and that they need to achieve this target before discussing 'exit' strategy.
Next up is the ECB.
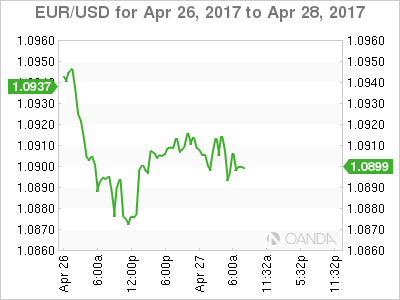
4. U.S dollar deflated on Trump U-turn
Ahead of the ECB rate announcement, the EUR is steady trading atop of €1.0900. The focus of the ECB meeting is likely be on the recent run of stronger growth and inflation data out of the Eurozone and possibility that the taper argument could be revisited as the fundamental picture is improving. The consensus doesn't believe that Draghi and co. will alter its policy language.
Note: The market is speculating that the ECB could discuss removing some of its easing biases in the June statement.
EUR/SEK (€9.6400) is trading +1% higher after the Riksbank surprised with an extension of its QE bond buying. The market was betting that monetary policy did not need to be more expansionary at this time.
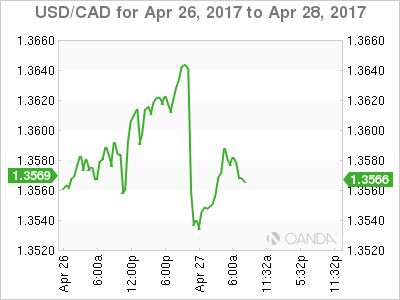
Elsewhere, USD/JPY (¥113.35) is a tad higher after the BoJ announcement while the CAD (C$1.3576) and MXN ($19.00) are firmer after President Trump noted that he would "not" scrap NAFTA, but renegotiate the trade agreement.
5. Eurozone confidence hits post crisis high
Euro data this morning shows eurozone confidence was stronger than expected in this month, with the European Commission's ESI measure jumping to 109.6 from 108.0 in March. It's the highest level in a decade.
The market was expecting a modest rise to 108.1. The pickup suggests that the eurozone's economic recovery is gaining momentum this year, and will reinforce the ECB's view that the outlook has improved.
The survey also showed household inflation expectations have fallen back this month, reaching their lowest level in five-months - This will likely support the ECB's caution over winding down its stimulus programs.
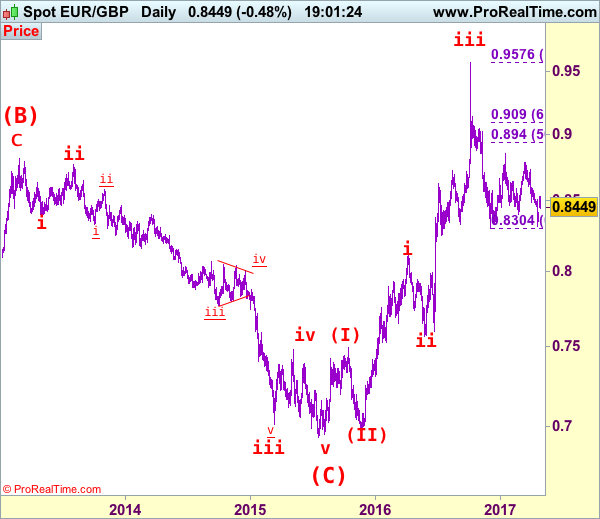
EUR/GBP Elliott Wave Analysis
EUR/GBP – 0.8452
EUR/GBP – The major (A)(B)(C)-(X)-(A)(B)(C) correction from 0.9805 is unfolding and 2nd (A) has possibly ended at 0.6936.
Although the single currency fell to as low as 0.8312 last week, failure to penetrate indicated previous support at 0.87304 and the subsequent gap-up opening this week suggest further consolidation above 0.9304 would be seen and above this week’s high at 0.8531 would bring a stronger rebound to 0.8592 but break of latter level is needed to signal the fall from 0.8857 has ended instead, bring further subsequent gain to 0.8650-60 and possibly towards resistance at 0.8735 but price should falter well below resistance at 0.8788.
Our latest preferred count is that the wave V of a 5-wave series from 0.5682 ended at 0.9805 earlier and major from there has possibly ended at 0.8067 as A-B-C-X-A-B-C. We are keeping our view that the entire correction from 0.9805 has possibly ended at 0.7756 and as labeled as the attached daily chart and impulsive move from 0.9084 has ended at 0.7756 as a 5-waver which marked either the (C) wave or the A leg of (C), a daily close above resistance at 0.8831 would suggest (C) leg has ended and headway towards 0.9084.
On the downside, whilst the pullback from 0.8531 may bring initial weakness to 0.8410-20, reckon downside would be limited and support at 0.8351 should hold, bring another rebound later. A drop below 0.8351 support would signal the rebound from 0.8312 has ended but only break of said support at 0.8304 would revive bearishness and signal early decline from 0.9576 top (2016 high) has resumed for weakness to 0.8251 support, then 0.8200.
Recommendation: Stand aside for this week.
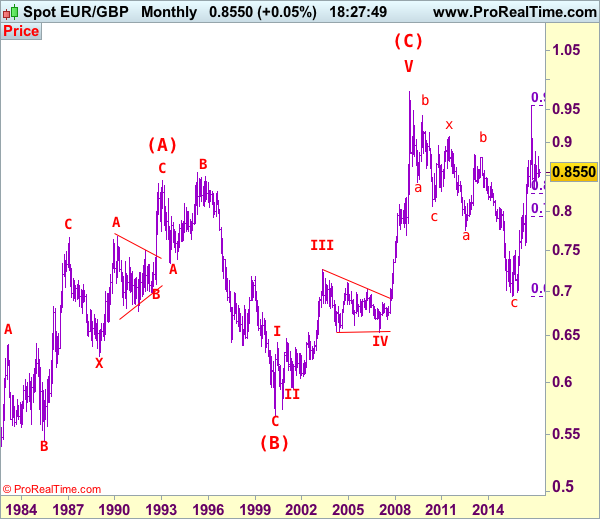
Euro's long term uptrend started in Feb 1981 at 0.5039 and is unfolding as a (A)-(B)-(C) move with (A): 0.8433 (Feb 1993), (B): 0.5682 (May 2000) and impulsive wave (C) should have ended at 0.9805 with wave III ended at 0.7254 (May 2003), triangle wave IV at 0.6536 (23 Jan 2007) and wave V as well as wave (C) has ended at 0.9805.
We are keeping an alternate count that only wave III ended at 0.9805 and the correction from there is the wave IV and may extend weakness to 0.7700, however, it is necessary to see a daily close above resistance at 0.9143 would change this to be the preferred count.
USD/CAD Elliott Wave Analysis
USD/CAD – 1.3278
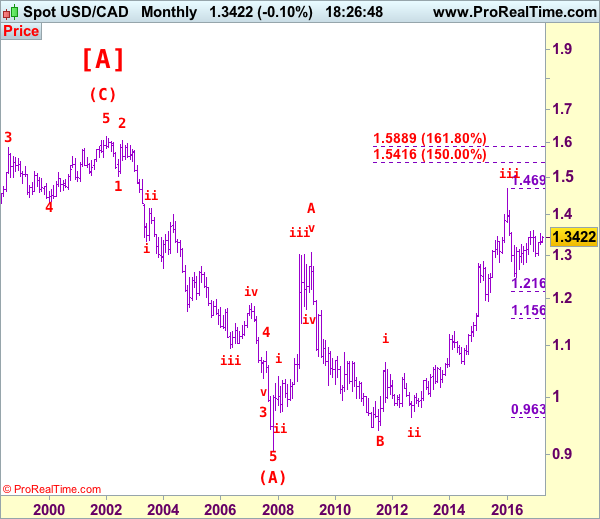
USD/CAD – Wave v ended at 0.9407 and a-b-c correction may extend gain to 1.4700
As the greenback has surged again after brief pullback to 1.3411 initially this week and broke above resistance at 1.3535 and 1.3599, signaling the rise from 1.2461 (2016 low) is still in progress and bullishness is seen for this move to bring at least a correction of the fall from 1.4690 (2016 high), hence further gain to 1.3700 and later 1.3750-60 would be seen, however, near term overbought condition would limit upside to 1.3790-00 and reckon upside would be limited to 1.3835-40 (61.8% Fibonacci retracement of 1.4690-1.2461) and bring retreat later.
We are keeping our view that the wave b from 1.0657 (a leg top) has possibly ended at 0.9633 with (a): 0.9800, wave (b): 1.0447 and wave c at 0.9633, the subsequent rise from there is now treated as wave c exceeded indicated upside target at 1.3770-80 and 1.4000 and wave (3) has possibly ended at 1.4690 and wave (4) correction has commenced for retracement back to 1.2832 support, then 1.2410-20.
On the daily chart, our latest preferred count remains that the A of (B) rally from 0.9059 low (7 Nov 2007) unfolded into an impulsive wave with i: 0.9059-1.0380, ii ended at 0.9819, iii at 1.3019 followed by triangle wave iv at 1.2026 , then wave v formed a top at 1.3066 and also ended the wave A. The wave B is unfolding as an double three a-b-c-x-a-b-c and is sub-divided as a: 1.2192, b: 1.2716 and wave c at 1.0784, followed by wave x at 1.1725, another set of a-b-c unfolded with 2nd a at 0.9931, 2nd b at 1.0674. the 2nd c has possibly ended at 0.9407, therefore, consolidation with upside bias is seen for major correction, indicated target at 1.3900 had been met and gain to 1.4700 would follow.
On the downside, whilst pullback to 1.3500-10 cannot be ruled out, reckon downside would be limited to 1.3450-60 and bring another rise later. Only below said this week’s low at 1.3411 would suggest top is formed instead, bring further fall to 1.3380-85 but a daily close below 1.3335-40 is needed to add credence to this view, then test of 1.3262 support would follow, however, key level at 1.3223 should remain intact.
Recommendation: Stand aside for this week and look to turn long on subsequent pullback.
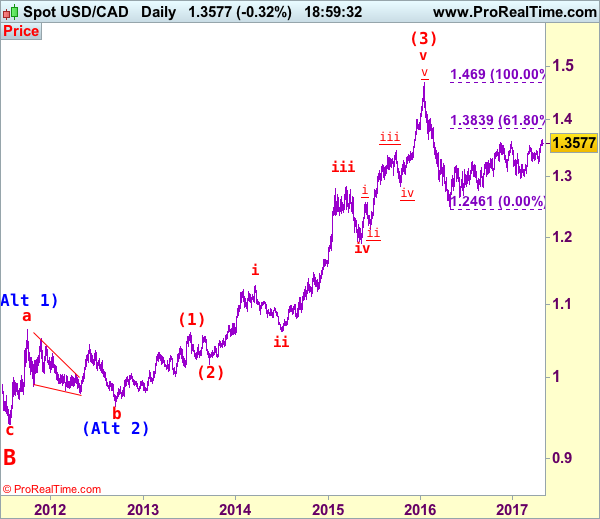
Longer term - The selloff from 1.6194 (21 Jan 2002) to 0.9059 (07 Nov 2007) is viewed as (A) wave which is a 5-waver as labeled on the monthly chart as below, the subsequently rally is labeled as (B) with impulsive A leg of (B) ended at 1.3066, wave B of (B) is unfolding which has either ended at 0.9407 or would extend one more fall but downside should be limited to 0.9200 and 0.9000 should hold.
Technical Outlook: Oil Remains Pressured By Global Oversupply, Hopes Of Extended Output Cut Agreement Balance The Market For Now
US oil remains under strong pressure on global oversupply that sent the price significantly lower during past two weeks. Oil price slumped from April's high at $53.74 to the levels below psychological $50%, loss of which has generated another strong bearish signal.
The fall found temporary footstep just under $49.00, above which the price entered consolidation phase.
Long upper shadows of past three day's candles signal strong recovery rejections and keep the downside under pressure, but on the other side, hopes that major oil producers would reach an agreement to extend production cut, balances the market for now.
Extended consolidation could be expected while current lows at $48.93/87 hold, however, thickening daily cloud (base is currently at $50) continues to weigh.
Stronger recovery signals require break above Mon/Wed highs at $50.18 and daily Kijun-sen at $50.41 to ease persisting bearish pressure.
Otherwise, loss of temporary base would look for extension towards 48.64 (Fibo 76.4% of $47.07/$53.74 rally and unmask key short-term support at $47.07.
Res: 50.00, 50.18, 50.41, 51.02
Sup: 48.90, 48.64, 48.37, 47.79
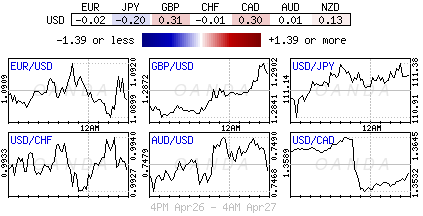
Daily Technical Analysis: EUR/USD Bearish Momentum Could Break Bullish Channel
Currency pair EUR/USD
The EUR/USD is in a channel (red/blue lines) which is struggling to break above the 61.8% Fibonacci retracement level of wave 2 (green) near the round level of 1.10. A breakout above or below a trend line could indicate the next direction. A bullish break indicates a continuation within wave C (purple) whereas a bearish break indicates a potential reversal.
The EUR/USD could have completed waves 5 (grey/pink) within wave C (purple) if price manages to break below the support trend line (blue). If that occurs, price could be building either an ABC (orange) or 12345 (red).
Currency pair GBP/USD
The GBP/USD broke the bull flag chart pattern (dotted orange) but the larger sideways zone (red/blue lines) remains intact. A potential bullish breakout could challenge 1.30.
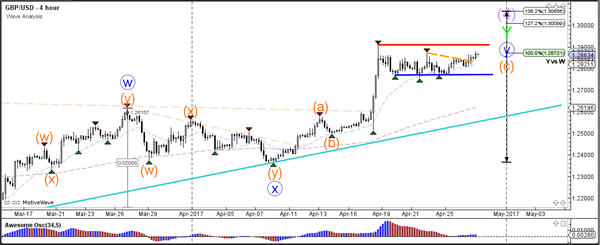
The GBP/USD seems to be in a wave 5 (purple) and its first target is 1.2925 at the 200% Fibonacci level.
Currency pair USD/JPY
The USD/JPY could have completed wave 3 (brown) due to the bearish engulfing twins, which is the candlestick pattern that emerged near the 112 resistance. Price could now be building a potential wave 4 (brown) retracement if price stops at one of the shallow Fibonacci levels (23.6-50%).
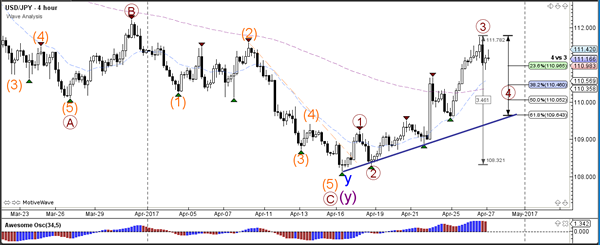
The USD/JPY has already made a retracement to and bounce at the 23.6% Fibonacci retracement level of wave 4 (brown). A break below the support trend line (green) could see a larger retracement unfold.

Technical Outlook: TRY Remains Well Supported And Attacks Key Support At 3.5555
Turkish lira continues to trend higher against the dollar after starting the week with gap-higher opening and being on track for strong bullish weekly close.
Weaker dollar and positive economic environment boosted lira which is attacking key support at 3.5555 (23 Feb trough) which lies near another pivot at 3.5489 (Fibo 38.2% of 2.9137/3.9416 Aug-Jan rally). Break here would generate strong bearish signal for extension of pullback from fresh record high at 3.9416 (11 Jan peak) and expose targets at 3.5159 (weekly Kijun-sen) and psychological 3.5000 support. Pair's session high at 3.5800 and former low of 27 Mar at 3.5850 mark initial resistances, followed by 3.6000 (round-figure barrier) and week's high at 3.6245.
Res: 3.5660, 3.5800, 3.5850, 3.6000
Sup: 3.5555, 3.5489, 3.5301, 3.5159