
Sample Category Title
Currencies: Dollar Weakens On Trump Comments
Headlines
- US stock markets ended a fairly dull session 0.3% to 0.5% lower, ignoring a late night drop in US yields and the dollar on comments by US president Trump. Overnight, Asian stock markets withstand dollar weakness rather well with Japan underperforming though (-1%).
- US President Trump said the US dollar 'is getting too strong' and he would prefer the Federal Reserve keep interest rates low. Mr. Trump, in an interview with The Wall Street Journal, also said his administration won't label China a currency manipulator in a report due this week.
- US President Trump said he has offered President Xi Jinping more favorable trade terms for Beijing in exchange for help on confronting the threat of North Korea, raising the prospect of a new pact that does less than Mr. Trump would otherwise like to address the US trade deficit with China.
- The Australian economy added 60,900 jobs in March (+74,000 full time jobs; -13,600 part-time jobs), up from a revised 2,800 gain (previously a 6,400 loss) the previous month and compared to a 20,000 forecast. The unemployment rate held steady at 5.9%, in line with expectations.
- China's exports rose at the fastest pace in a little more than two years in March, climbing 16.4% Y/Y in a further sign that global demand is picking up. Import growth remained strong at 20.3% Y/Y, driven by the country's voracious appetite for oil, copper, iron ore, coal and soybeans, whose volumes all surged from February despite worries about rising inventories. Crude oil imports hit a record high.
- The Bank of Canada did not even consider cutting interest rates as it left monetary policy unchanged at 0.5% amid signs of strong growth, but it is too early to conclude the economic growth is sustainable, Governor Poloz said.
- Brazil's central bank slashed interest rates by 100 bps in a decision that could help spur a recovery from the worst recession on record to hit Latin America's biggest economy. The central bank cut the benchmark Selic rate from 12.25% to 11.25%, stepping its easing cycle.
- South Korea's central bank stood pat on interest rates amid heightened geopolitical tensions on the Korean peninsula. The Bank of Korea held its 7-day repo rate at 1.25%, where it has been since the bank cut the key interest rate by 25 bps in June 2016.
- Australia's central bank highlighted vulnerabilities in the country's skyrocketing property market, warning regulators would consider further tightening lending rules to head off a debt-fuelled bubble in home prices.
Dollar weakens on Trump comments
Trading on currency markets remained also confined to tight ranges yesterday until Trump's surprising comments. He said: 'I think our dollar is getting too strong, and partially that's my fault because people have confidence in me. But that's hurting—that will hurt ultimately'. He continued, 'It's very, very hard to compete when you have a strong dollar and other countries are devaluing their currency.' In another change of heart, he no longer labels China as currency manipulators, hoping to get them on board in his approach against North Korea.
In the final US trading hour, USD/JPY dropped deeper below 110 support, from 109.80 to 108.80 this morning with some reaction now (109.04). EUR/USD surged from 1.06 to 1.0670. The trade-weighted fell from 100.80 to 100.
Overnight, the US dollar remained in the defensive even if the decline seems to be halting as we approach the European market opening. Today's eco calendar contains US weekly jobless claims, PPI data and Michigan consumer confidence, but we don't expect them to impact trading. The earnings reports might affect currencies, especially USD/JPY, via the overall equity climate. If earnings are weak and equities slide away, it would give the yen more upside and push USD/JPY further below the 110 level. Interesting, while Trump's comments pushed yields and the dollar lower, equities didn't react at all on this intrinsically equity positive development. Regarding USD/JPY, the short term trend is yen positive (since break below 110) and we shouldn't yet row against the tide. The Trump comment goes with the trend. We are cautious though as the past yen strength was largely due to its safe haven qualities. If geopolitical tensions ease, the yen may lose again. However, only when the pair breaks through 112.20, we would embrace a dollar positive strategy. Next key support stands at USD/JPY 107.18, the 62% retracement of the previous up-leg. For now, we still prefer a USD/JPY sell-onupticks given recent progress.
EUR/USD jumped on Trump's comments from 1.06 to 1.0670 followed by sideways trading. We don't believe that Trump's comments will have important consequences for EUR/USD short term. The euro is weak too ahead of the French presidential elections and the fate of the dollar depends more on the intrinsic qualities of the currency than on the comments of Mr. Trump, even if he might help shape the underlying conditions via its policy. The Fed is still independent and should continue to tighten policy. We had an above consensus Fed view with 4 rate hikes in both 2017-2018. We might side again on the Fed's dot plot with 3 hikes in 2017/18, but prefer to not react immediate and instead reconsider the issue after Easter. Technically the overnight move had little significance. So we think that the 1.05 to 1.0907 range is still intact and tactically we still prefer a sell-on-upticks, preferable closer to 1.09.
USD/JPY sets new low after Trump's comments, dropping further below 110.10 support
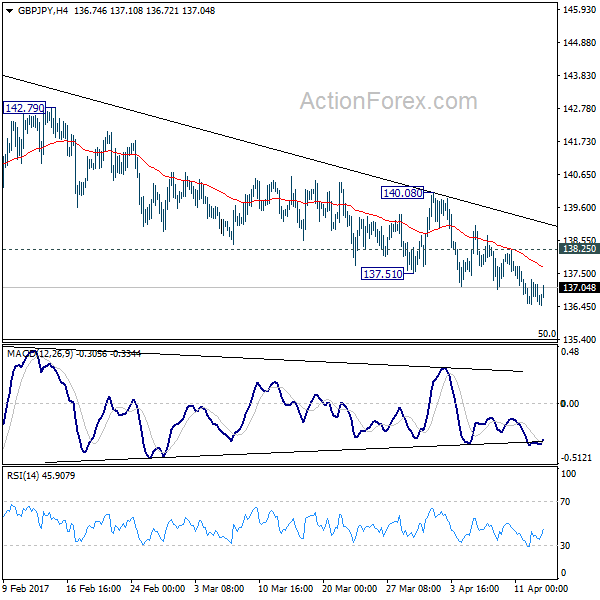
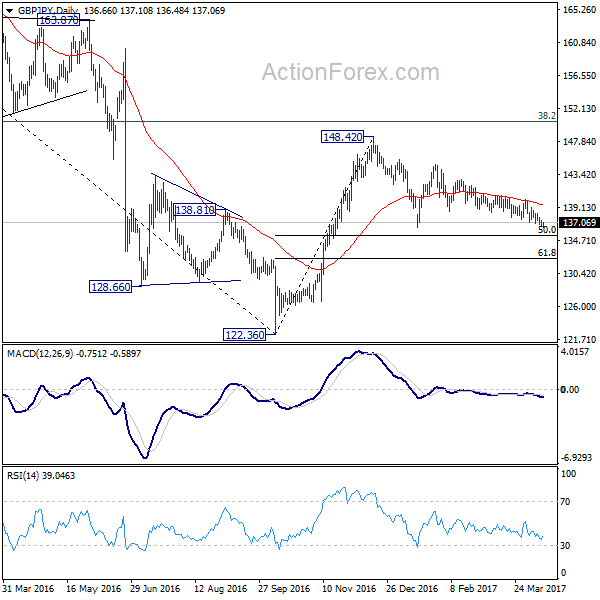
GBP/JPY Daily Outlook
Daily Pivots: (S1) 136.36; (P) 136.84; (R1) 137.16; More...
With 138.25 minor resistance intact, choppy decline from 144.77 is expected to extend lower. Nonetheless, price actions from 148.42 are still viewed as a corrective pattern. There, we'd anticipate strong support from 135.39 medium term fibonacci level to bring rebound. On the upside, break of 138.25 minor resistance will turn bias to the upside for 140.08 resistance. Break will indicate near term reversal. However, sustained break of 135.39 will target 61.8% retracement at 132.31.
In the bigger picture, price actions from 122.36 medium term bottom are still seen as a corrective pattern. Main focus is on 38.2% retracement of 195.86 to 122.36 at 150.42. Rejection from there will turn the cross into medium term sideway pattern. Or, sustained break of 50% retracement of 122.36 to 148.42 at 135.39 will turn outlook bearish for a test on 122.36 low. Though, sustained break of 150.42 will extend the rebound towards 61.8% retracement of 195.86 to 122.36 at 167.78.
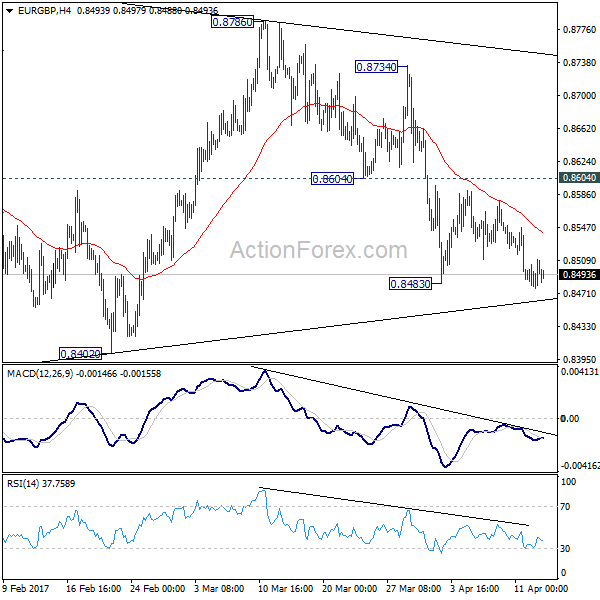
EUR/GBP Daily Outlook
Daily Pivots: (S1) 0.8482; (P) 0.8497; (R1) 0.8516; More...
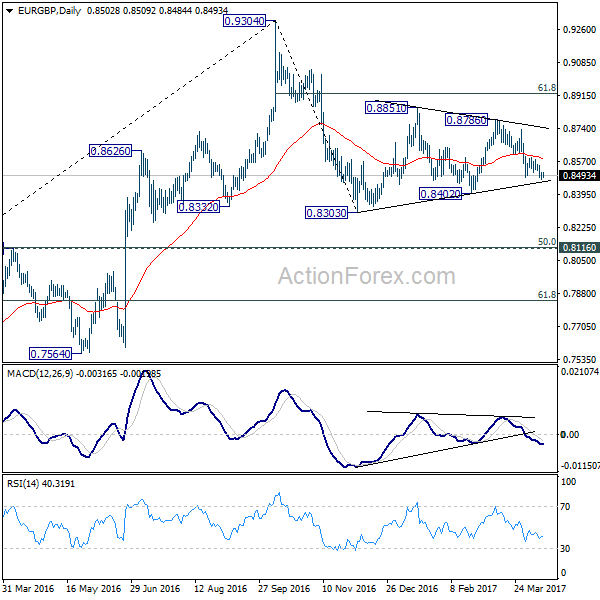
Intraday bias in EUR/GBP remains neutral with bearish outlook. Decline from 0.8786 could be developing into the third leg of the whole corrective pattern from 0.9304. And hence, deeper fall is expected ahead. On the downside, break of 0.8483 will turn bias to the downside for 0.8402 support first. Decisive break there should confirm our bearish view and target 0.8303 and below. As fall from 0.9304 is viewed as a corrective move, we'd expect strong support at 0.8116/20 cluster support to contain downside and bring rebound. On the upside, above 0.8604 minor resistance will delay the bearish case. That is, one more recovery will be seen to complete a five wave triangle pattern fro 0.8303 before completion.
In the bigger picture, price actions from 0.9304 are viewed as a medium term corrective pattern. Such decline is likely ready to resume and should make a new low below 0.8303. At this point, we'd expect strong support from 0.8116 cluster support (50% retracement of 0.6935 to 0.9304 at 0.8120) to contain downside. Rise from 0.6935 (2015 low) will resume at a later stage to 0.9799 (2008 high). However, sustained break of 0.8116 could bring deeper decline to next key support level at 0.7564 before the correction completes.
EUR/AUD Daily Outlook
Daily Pivots: (S1) 1.4134; (P) 1.4168; (R1) 1.4211; More...
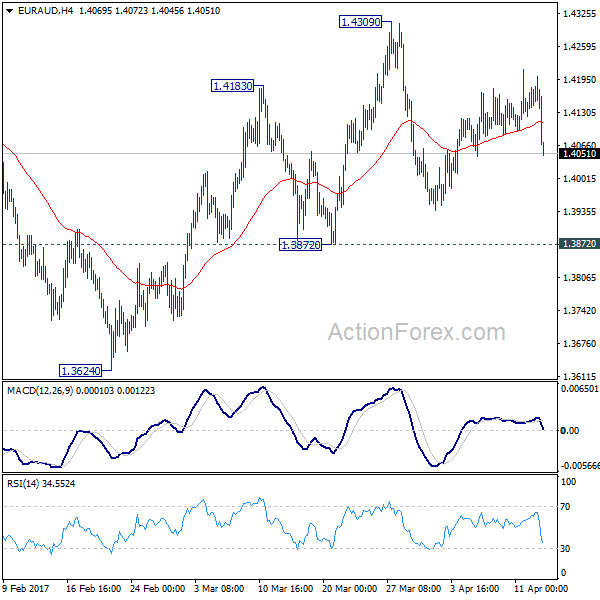
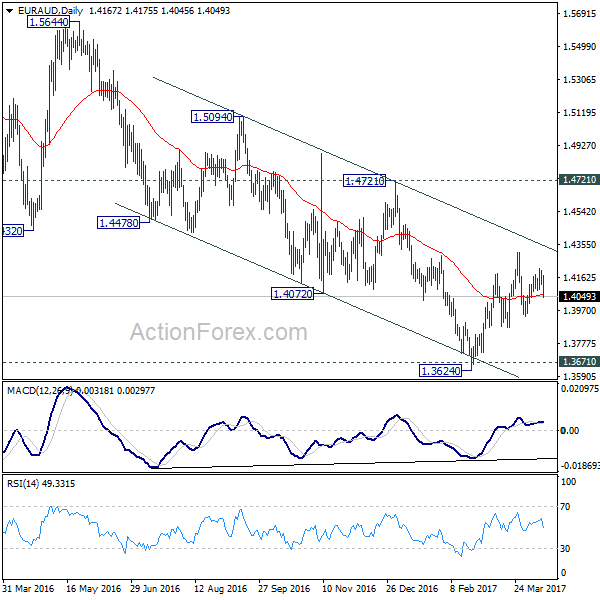
Intraday bias in EUR/AUD remains neural as it's staying in range of 1.3872/4309. With 1.3872 support intact, further rise is in favor. And, we're mildly favoring the case of trend reversal after defending key support level at 1.3671. On the upside, break of 1.4309 will extend the rebound from 1.3624 to 1.4721 key resistance level next. Decisive break of 1.4721 should confirm larger trend reversal. However, firm break of 1.3872 support will dampen our bullish view. In such case, intraday bias will be turned back to the downside for 1.3624 low instead.
In the bigger picture, price actions from 1.6587 medium term top are viewed as a corrective pattern. Such correction could be completed after testing 1.3671 key support. Break of 1.4721 cluster resistance (38.2% retracement of 1.6587 to 1.3624 at 1.4756) should confirm this case and target 61.8% retracement at 1.5455 and above. Overall, we'd expect the up trend from 1.1602 to resume later. However, sustained break of 1.3671 will invalidate our bullish view and would turn extend the fall from 1.6587 towards 1.1602 long term bottom.
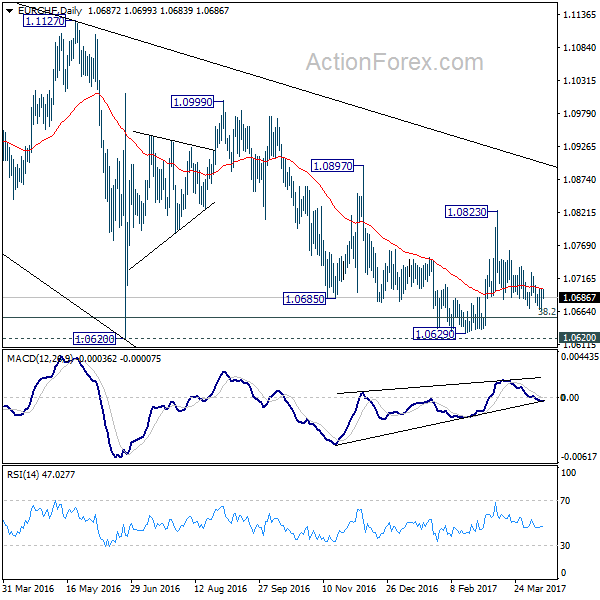
EUR/CHF Daily Outlook
Daily Pivots: (S1) 1.0676; (P) 1.0687; (R1) 1.0710; More...
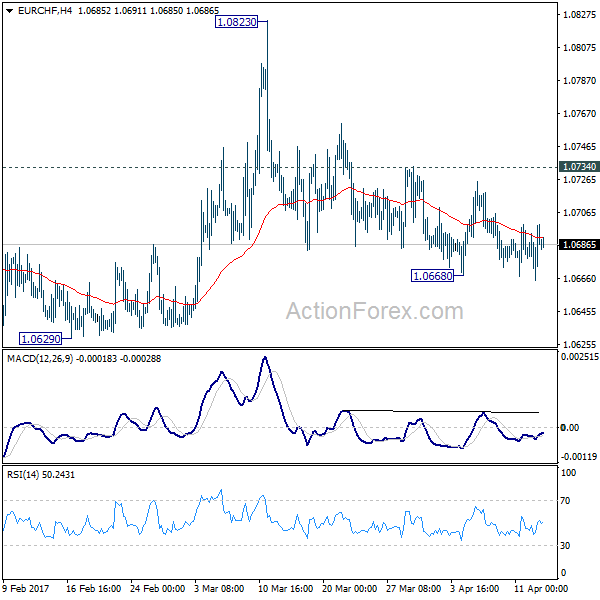
Intraday bias in EUR/CHF remains neutral for the moment. the bearish outlook is unchanged with 1.0734 resistance intact. That is, rebound from 1.0629 has completed at 1.0823. And the larger decline from 1.1198 is likely still in progress. On the downside, break of 1.0668 will target 1.0620/29 key support zone. Decisive break there will resume whole fall from 1.1198 and target next long term fibonacci level at 1.0485. Nonetheless, break of 1.0734 will suggest that pull back from 1.0823 is completed and turn bias back to the upside for this resistance.
In the bigger picture, the decline from 1.1198 is seen as a corrective move. Current development suggests that it's not completed yet. Sustained trading below 38.2% retracement of 0.9771 to 1.1198 at 1.0653 will target 50% retracement at 1.0485. In any case, break of 1.0823 resistance is needed to be the first indication of reversal. Otherwise, deeper fall is still expected even in case of recovery.
Trump Ordered Up A Dessert Storm
President Tump ordered the Syrian strikes over dessert with President Xi, stellar Australian employment and Chinese trade data, the flight to safety; it’s been quite a morning already.
The USD has been generally weaker overnight into the Asia morning following on mostly from an interview published overnight in the Wall Street Journal. The comments that have had the most effect were that the USD was too strong and that China won’t be labelled a currency manipulator. This has weakened the USD across the board continuing its poor run of the last few days. Especially against the YEN. We also saw US 10-year bonds rally aggressively to 2.24%. Among the more esoteric comments to emerge overnight was that Mr Trump ordered the Syrian airstrikes over dessert with China President Xi. I am not sure if it was a chocolate bomb he was eating, but one could definitely say he served up a dessert storm. State dinners around the word will definitely be more poignant going forward. Diplomats would be well advised to note President Trump likes his steak well done. Just saying.
Over in Europe, the French elections have become more muddied with the ascendance in the polls of the far-left candidate Jean-Luc Melechon. Readers should note that when I say far-left, this candidate makes Hugo Chavez look like an activist shareholder hedge fund. He is also vehemently anti-Euro. This has raised the spectre of a nightmare scenario where the 2nd round run-off could be contested by the extreme right wing and left wing candidates. Despite safe-haven inflows into German Bunds, this reality check has been capping Euro rallies even as the USD is generally weaker.
Moving to Asia today, we have the unfortunate circumstance that the founder of North Korea, Kim Il-jung has his birthday anniversary tomorrow, on Easter Friday. North Korea’s unique interpretation of festive fare means that there is a chance that they will commemorate Eater Friday with a nuclear test. Apparently, they have gathered foreign journalists in Pyongyang for a “special event.” Along with Russian intrusions into Japanese airspace and the U.S. Navy parking a fleet of the Korean Penninsula, this has kept Asian traders and investors very nervous all week. It is, therefore, no surprise that precious metals have been vigorously bid all week in this timezone as we roll into the long weekend.
Looking at the markets this morning in Asia.
FX
USD/JPY
Continues to trade heavily as the US/Japan yield spread closes up and safe haven flows pile into Yen ahead of the weekend. The USD/JPY is trading just above its 200-day moving average (DMA) at 108.60 which marks first support. A close below opens a move to the 61.8% Fibonacci at 106.85 from a chart perspective.
Resistance is at 110.00 the breakdown level of a few days ago. Overall though the flight to safety still rules into Easter.
EUR/USD
Euro has managed a benign rally from 1.0600 back to 1.0670 on the back of Trump’s USD comments and safe haven inflows into German Bunds. In the process breaking back up through its 100-dma at 1.0628. However, the adage that France changes by revolution not evolution is rearing its head vis-a-vis the first Presidential run-off, and this should help to cap gains in the single currency.
Euro has resistance at 1.0700 and 1.0775, with support at 1.0628 and then 1.0565.
AUD/USD
A weaker USD and spectacular employment numbers lift the lucky country of the floor today.
AUD is showing no signs of the weaker commodity prices affecting it for now. AUD has resistance right here at 7585 followed by 7600 and then 7680.
Spport lies at 7530, 7510 and then 7570.
USD/CNH
Excellent trade data sees the CNH rally continue following a weaker USD overnight.
USD/CNH has fallen back below the 6.9000 level which becomes solid resistance yet again.
Support lies at 6.8760 and then 6.8450.
PRECIOUS METALS
GOLD
Mr.Trump and geopolitical turmoil around the world was all gold needed to jump another 15 USD last night. Although we are seeing some consolidation today in Asia, it is clear that the safe haven bid is in place on any dips. Especially as we enter a long weekend. Precious metals will be very headline driven into the weekend.
Gold has support at 1280 and 1272.50 with resistance at 1288, 1300 and then 1307.
SILVER
Although a few world leaders probably wish they had silver bullets at the moment, silver continues its safe haven march higher with its bigger cousin.
Silver has resistance at 18.5700 with a daily close opening a run at 19.0000 on the charts.
Support appears at 18.4500, 18.2400 and then the 200-DMA at 18.0700.
SUMMARY
Asia stocks are generally in the red to a small degree today. Most notably Australia and Japan as the Nikkei suffers from a stronger YEN and uncertainty in the region. Safe havens reign supreme with precious metals and US bonds rallying hard overnight. Trump’s dessert storm set the ball rolling, but it seems the weekend will belong to North Korea. Expect investors to continue to seek safe harbours as we head into the long weekend.
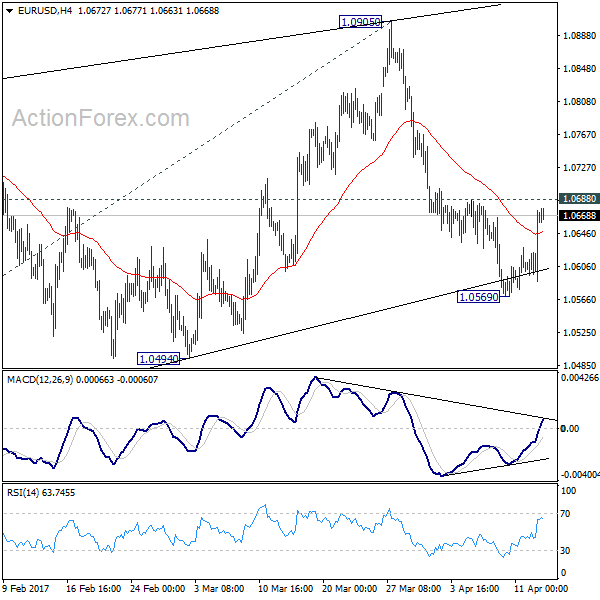
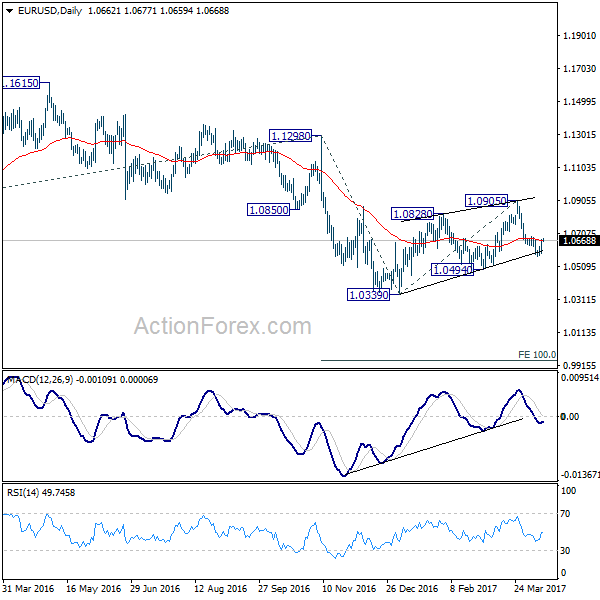
EUR/USD Daily Outlook
Daily Pivots: (S1) 1.0611; (P) 1.0642 (R1) 1.0697; More....
EUR/USD's rebound from 1.0569 extended higher but it's still kept below 1.0688 minor resistance. Intraday bias remains neutral first and the bearish outlook is unchanged. Corrective rise from 1.0339 is likely finished after being rejected by 55 week EMA. And, the larger down trend is ready to resume. Below 1.0569 will turn bias to the downside for 1.0494 support first. Break will confirm this bearish case and send EUR/USD through 1.0339 to 100% projection of 1.1298 to 1.0339 from 1.0905 at 0.9946. On the upside, however, break of 1.0688 resistance will delay the bearish case and turn focus back to 1.0905 resistance instead.
In the bigger picture, as long as 1.1298 key resistance holds, whole down trend from 1.6039 (2008 high) is still expected to continue. Break of 1.0339 low will send EUR/USD through parity to 61.8% projection of 1.3993 to 1.0461 from 1.1298 at 0.9115. However, considering bullish convergence condition in weekly MACD, break of 1.1298 will indicate term reversal. this would also be supported by sustained trading above 55 week EMA.
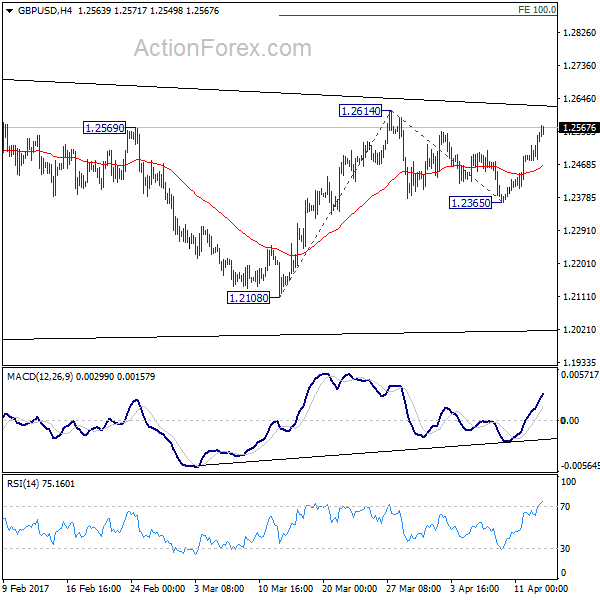
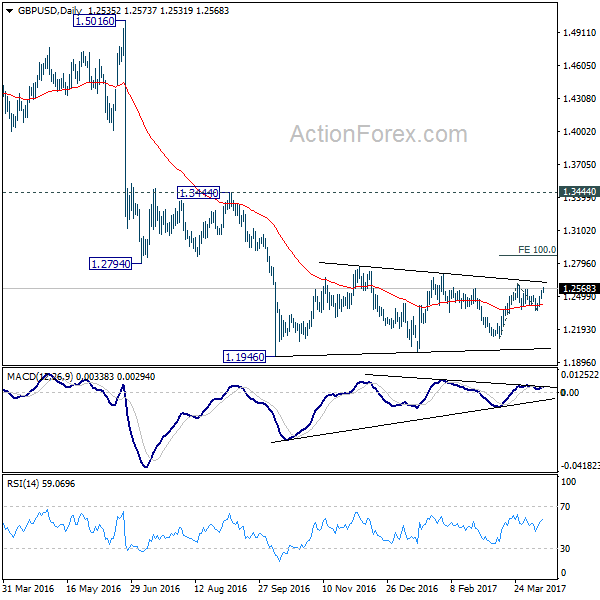
GBP/USD Daily Outlook
Daily Pivots: (S1) 1.2499; (P) 1.2524; (R1) 1.2567; More...
Intraday bias in GBP/USD remains on the upside for 1.2614 resistance. Break there will resume whole rise from 1.2108 and target 100% projection of 1.2108 to 1.2614 from 1.2365 at 1.2871. But overall, price actions from 1.1946 low are viewed as a consolidation pattern. We'd expect strong resistance around 55 week EMA (now at 1.3015) to limit upside and bring down trend resumption. But for now, further rise will be favored in near term as long as 1.2365 support holds.
In the bigger picture, fall from 1.7190 is seen as part of the down trend from 2.1161. There is no sign of medium term reversal yet. Sustained trading below 61.8% projection of 2.1161 to 1.3503 from 1.7190 at 1.2457 will target 100% projection at 0.9532. Overall, break of 1.3444 resistance is needed to confirm medium term bottoming. Otherwise, outlook will remain bearish.
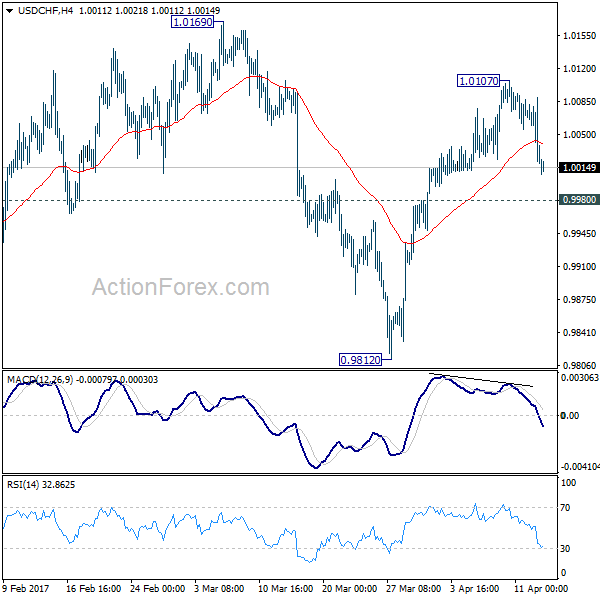
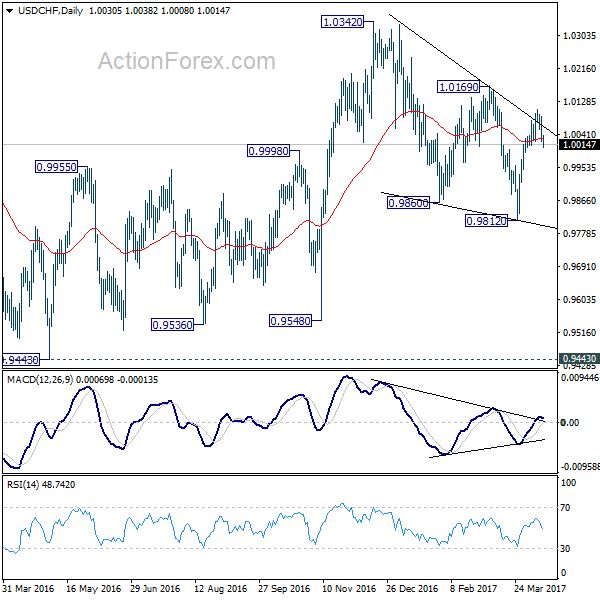
USD/CHF Daily Outlook
Daily Pivots: (S1) 1.0004; (P) 1.0047; (R1) 1.0072; More.....
USD/CHF dipped notably follow dollar weakness. But it's staying above 0.9980 minor support. Intraday bias stays neutral first. Hence, downside of retreat should be contained by 0.9980 support and bring rally resumption. Above 1.0107 will target 1.0169 resistance. Decisive break there will confirm this bullish case and target 1.0342 key resistance next. However, below 0.9980 will dampen this bullish case and turn bias back to the downside for 0.9812 low.
In the bigger picture, we're still maintain that firm break of 1.0342 key resistance is needed to confirm underlying bullish momentum in the cross. However, the corrective nature of the fall from 1.0342 to 0.9812 is starting to give the medium term outlook a bullish favor. Hence, in stead of looking for topping signal around 1.0342, we'd now pay closer attention to upside acceleration as USD/CHF approaches this level again.
Market Update – Asian Session: Australia Jobs Gains At 16-Month Highs
Asia Mid-Session Market Update: China Trade rebounds from last month's deficit; Australia jobs gains at 16-month highs; Bank of Korea on hold with higher target for growth and inflation
US Session Highlights
(US) MAR IMPORT PRICE INDEX M/M: -0.2% V -0.2%E (driven by lower fuel import prices); Y/Y: 4.2% V 4.0%E
(CA) BANK OF CANADA (BOC) LEAVES INTEREST RATES UNCHANGED AT 0.50%; AS EXPECTED; too early to conclude economy is on a sustainable growth path
(CA) Bank of Canada (BoC) Gov Poloz: given the data in the last few months, a rate cut is not currently on the table
(MX) Mexico Central Bank (Banxico) Mar Minutes: all board members agreed there was a certain margin for smaller hike
(US) Fed's Kaplan (moderate, voter): can start trimming balance sheet as soon as later on this year; balance sheet runoff will have some tightening impact
(US) DOE CRUDE: -2.2M V 0ME; GASOLINE: -3.0M V -1.5ME; DISTILLATE: -2.2M V -1ME; Cushing crude stocks +0.3M at 69.4M bbl
President Trump in a press interview said that a strong dollar will ultimately hurt the US and that he prefers low interest rate policy. He also reversed his position on China, saying he will not label the Asian nation a currency manipulator. In another reversal, he said he likes and respects Fed Chair Yellen and that it's too soon to comment on whether he might re-nominate her at the end of her term in 2018.
US markets on close: Dow -0.3%, S&P500 -0.4%, Nasdaq -0.5%
Best Sector in S&P500: Real Estate
Worst Sector in S&P500: Technology
Biggest gainers: HPQ +2.7%; TSN +2.2%; WFM +1.7%
Biggest losers: TSCO -8.3%; FAST -8.1%; FCX -5.4%
At the close: VIX 15.8 (+0.7pts); Treasuries: 2-yr 1.21% (-3bps), 10-yr 2.30% (flat), 30-yr 2.93% (flat)
US movers afterhours
AAOI: Raises Q1 $1.00-1.02 v $0.83e, R$96.2M v $89.5Me (guided $0.80-0.88, R$87-91M prior); +19.9% afterhours
HBI: Reports prelim Q1 adj EPS $0.28-0.29 v $0.28e, R$1.38B v $1.38Be; affirms FY17 financial guidance; CFO Moss to retire at end of 2017; +6.1% afterhours
PIR: Reports Q4 $0.34 v $0.33e, R$528.4M v $531Me; Guides Q1 -$0.07 to -$0.03 v -$0.02e; -3.7% afterhours
Politics
(US) Pres Trump: US dollar is getting too strong; Will not label China a currency manipulator - press interview
(US) Pres Trump: Will work to enhance the NATO partnership; NATO members must meet their financial obligations, pay their fair share - press conf with NATO Sec Gen
Key economic data
(BR) BRAZIL CENTRAL BANK (BCB) CUTS SELIC TARGET RATE BY 100BPS TO 11.25%; AS EXPECTED
(KR) BANK OF KOREA (BOK) LEAVES 7-DAY REPO RATE UNCHANGED AT 1.25%; AS EXPECTED
(CN) CHINA MAR TRADE BALANCE (CNY TERMS): +164B V +76BE
(CN) CHINA MAR TRADE BALANCE (USD TERMS): +$23.9B V +$12.5BE
(AU) AUSTRALIA MAR EMPLOYMENT CHANGE: +60.9K (16-month high) V +20.0KE; UNEMPLOYMENT RATE: 5.9% V 5.9%E
(AU) AUSTRALIA APR CONSUMER INFLATION EXPECTATION: 4.1% V 4.0% PRIOR
(AU) AUSTRALIA Q1 CBA/HIA HOUSE AFFORDABILITY: 81.4 V 79.9 PRIOR
(NZ) New Zealand Mar Business Manufacturing PMI: 57.8 v 55.7 prior; 14-month high
Asia Session Notable Observations, Speakers and Press
Asian equity markets are mixed even as volatility continues to pick up dramatically on geopolitical worries and US President Trump's policy adjustments. In late US hours, USD sold off sharply after Trump confirmed that China will not be labeled a currency manipulator but rather it was the US dollar that has gotten too strong. Moreover, Trump said he favored a low interest rate policy and offered praises to Fed Chair Yellen whom he previously attacked on the campaign trail for politicizing Fed monetary stance. Nikkei225 fell by over 1% as USD/JPY crumbled to 5-month lows below ¥109, Gold spiked up on inflationary implications of lower USD, while Treasuries rose at the expense of Financials. In other USD majors, AUD/USD has gained a full cent on Trump's comments and strong Aussie jobs data, while MXN saw its best levels since mid-November.
China Trade Balance rebounded to a surplus after last month's surprise deficit, sending Shanghai Composite into positive territory. Exports in CNY terms were well above consensus at 22.3% v 8.0%e, Imports also beat at 26.3% v 15.0%e, and even Crude Oil prices saw an atypical bounce on China trade with a 20c rise as Mar imports of 9.24M bpd registered a record high. China Customs noted that trade is improving as global demand recovers, but also warned that import growth may slow in Q2. Also of note in China, PBoC has resumed its open market operations after a 2-week pause with a CNY110B injection.
Australia employment data also reversed last month's negative surprise. Although unemployment rate remained at 5.9%, net jobs gains was a 16-month high at 60.9K while participation rate also rose to an 8-month high of 64.8% v 64.6%e.
In a trifecta of central bank rate decisions, Brazil cut by 100bps to 11.25% as widely expected and said the accelerating pace of easing is appropriate with favorable trend of reduced inflation. Singapore Central Bank also preserved its SGD appreciation policy at zero and kept its inflation targets at 0.5-1.5% for this year. South Korea stood pat at 1.25% but raises its 2017 GDP and CPI forecasts by a decimal to 2.6% and 1.9% respectively, citing trend of improvement in exports and expectations of a rebound in consumption. South Korea did concede increasing uncertainty related to the threat from the North, just as analysts speculated that Pyongyang may be preparing to conduct its 6th nuclear test as soon as Apr 15th to commemorate the birthday of Kim Il-sung.
China
(CN) China NDRC: Q1 power consumption 1.45T KWH, 6.9% y/y; March 513.9B KWH, +7.9% y/y
(CN) China Dalian Commodity Exchange to cut transaction fees on iron ore, coking coal, coke, PP futures - Chinese press
Japan
(JP) Japan PM Abe: Japan and China agree on a peaceful resolution for North Korea issue
(JP) Japan Fin Min Aso: Wage increases have been inadequate relative to corporate profit increases - press
Australia/New Zealand
(AU) ACCC has issued a draft determination proposing to allow the South Australian Chamber of Mines and Energy, along with 24 other South Australian businesses, to establish a joint electricity purchasing group
(AU) RBA issues financial stability review: outlook for the global economy has improved over the past six months
Korea
(KR) US govt and other officials warned that North Korea reportedly placed a nuclear device in a tunnel and it may be detonated this Saturday Apr 15th
(KR) Trump administration is looking at North Korea strategy, including tougher economic sanctions, possibly including and oil embargo, banning its airline, intercepting cargo ships and punishing Chinese banks doing business with North Korea - financial press
(KR) South Korea Foreign Min Yun: Belives US will consult with South Korea before pre-emptive strike on North Korea
Asian Equity Indices/Futures (00:30ET)
Nikkei -1.0%, Hang Seng -0.1%, Shanghai Composite +0.1%, ASX200 -0.9%, Kospi +0.4%
Equity Futures: S&P500 -0.1%; Nasdaq flat, Dax flat, FTSE100 +0.1%
FX ranges/Commodities/Fixed Income (00:30ET
EUR 1.0660-1.0680; JPY 108.70-109.10; AUD 0.7520-0.7585; NZD 0.696-0.7000
June Gold +0.8% at 1,288/oz; May Crude Oil flat at $53.09/brl; May Copper +1.1% at $2.57/lb
(CN) China raises retail gasoline and diesel prices for the 3rd time this year - press
(CN) PBoC resumes open market operations after 13th consecutive skips by injecting CNY110B combined in 7, 14, and 28-day reverse repos
(CN) PBOC SETS YUAN MID POINT AT 6.8651 V 6.8940 PRIOR; strongest yuan setting since Feb 7th
(JP) Japan MoF sells ¥723.4B in 0.8% (0.8% prior) 30-yr bonds; Avg yield: 0.795% v 0.821% prior; Bid to cover: 3.08x v 3.14x prior
Asia equities / Notables / movers
Australia
WHC.AU Whitehaven Coal -6.1% (Q3 result)
FMG.AU Fortescue -7.0%, BHP.AU BHP Billiton -4.0%, RIO.AU Rio Tinto -4.6% (iron ore price declines)
WHC.AU Whitehaven -6.1% (production report)
NST.AU Northern Star +7.1%, EVN.AU Evolution +2.9% (gold price higher)
GXY.AU Galaxy Resources +2.4% (Macquarie upgrades)
AZJ.AU Aurizon Holdings -2.1% (Goldman Sachs downgrades)
Japan
2651.JP Lawson Inc -5.1% (annual result)
8267.JP Aeon Co -4.3% (annual result)
6502.JP Toshiba -4.6% (narrows potential bidders)
8086.JP Nipro Corp +5.4% (Morgan Stanley upgrades)
9101.JP Nippon Yusen -1.3% (earnings speculation)
South Korea
012630.KR Hyundai Development Co +2.3% (new contract)
047040.KR Daewoo Engineering & Constr -3.9% (share sale)
Hong Kong
285.HK BYD Electronic International +3.3% (guidance)
1929.HK Chow Tai Fook Jewellery Group +5.8% (Q1 result)
1668.HK China South City Holdings +1.3% (annual result)
1109.HK China Resources Land +0.2% (Q1 result)
921.HK Hisense Kelon Electrical Holdings Co +4.6% (Q1 guidance)
1913.HK Prada -1.7% (annual result)
China
600376.CN Beijing Capital Development Co +3.2%, 601668.CN China State Construction Engineering -2.5% (annual result)