Sample Category Title
EUR/CHF Candlesticks and Ichimoku Analysis
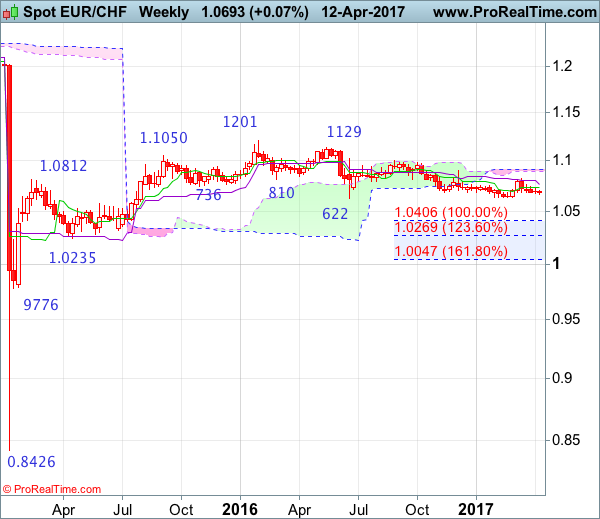
Weekly
• Last Candlesticks pattern: Doji
• Time of formation: 20 Feb 2017
• Trend bias: Up
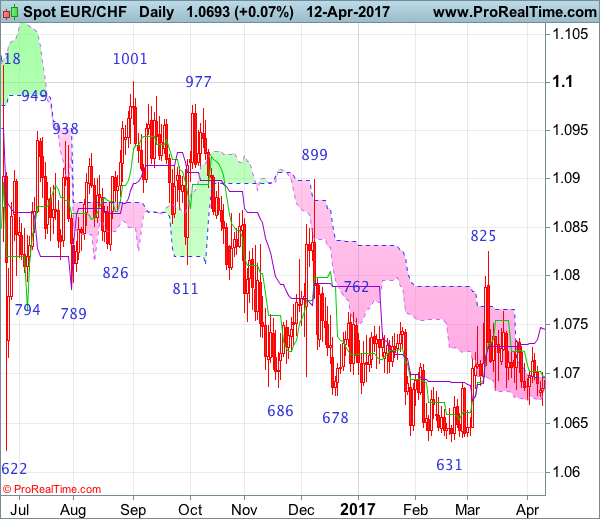
Daily
• Last Candlesticks pattern: Doji
• Time of formation: 1 Sep 2016
• Trend bias: Near term down
EUR/CHF – 1.0668
Despite last week’s brief bounce to 1.0727, as the single currency has fallen again after faltering below indicated resistance at 1.0736, suggesting the fall from 1.0825 top is still in progress and near term downside risk remains for this move to extend further decline towards 1.0622-31, however, break of this level is needed to signal the decline from 1.1201 (2016 high) has resumed and extend subsequent weakness to 1.0590-00, then towards 1.0530-35 but loss of downward momentum should prevent sharp fall below 1.0500, price should stay well above 1.0400-10, risk from there has increased for a strong rebound to take place later.
On the upside, whilst initial recovery to 1.0700 cannot be ruled out, reckon upside would be limited to said resistance at 1.0727 and bring another decline later. Only a daily close above 1.0727 would suggest the fall from 1.0825 has ended instead, bring a stronger rebound to 1.0763, break there would add credence to this view and encourage for further gain to 1.0790-00 but said resistance at 1.0825 should remain intact. In the event euro is able to penetrated resistance at 1.0825, this would shift risk back to upside and signal low has been formed instead, bring further subsequent gain to 1.0850 and later towards key resistance at 1.0899 (Dec high).
Recommendation: Stand aside for this week.
On the weekly chart, although the single currency rebounded initially last week, renewed selling interest emerged around the Tenkan-Sen and price has slipped again, suggesting the retreat from 1.0825 is still in progress and may extend weakness to indicated strong support at 1.0622-31, however, break there is needed to signal recent decline from 1.1201 top has resumed and extend further fall to 1.0550-55, then 1.0500-10 but oversold condition should prevent sharp fall below 1.0400-10 (100% projection of 1.1201-1.0622 measuring from 1.1001) and price should stay well above previous support at 1.0314, risk from there is seen for a rebound to take place later.
On the upside, expect recovery to be limited to 1.0700-10 and bring another decline. Above the Tenkan-Sen (now at 1.0728 would bring rebound to 1.0760-65, however, reckon upside would be limited to 1.0825 resistance and bring further consolidation. Only a break of 1.0825 would signal low has been formed at 1.0631, bring retracement of recent decline to 1.0850 but a break above indicated resistance at 1.0899 is needed to add credence to this view and bring a stronger rebound to 1.0970-75, then test of 1.1001. Looking ahead, only a sustained breach above 1.1001 would signal the fall from 1.1201 has ended, bring further gain to 1.1100 but reckon resistance at 1.1129 would hold on first testing.
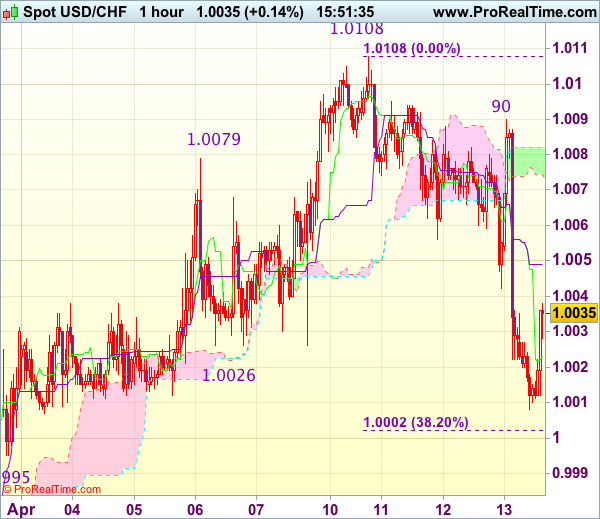
Trade Idea : USD/CHF – Buy at 0.9995
USD/CHF - 1.0030
Most recent candlesticks pattern : N/A
Trend : Near term down
Tenkan-Sen level : 1.0023
Kijun-Sen level : 1.0049
Ichimoku cloud top : 1.0082
Ichimoku cloud bottom : 1.0073
Original strategy :
Buy at 1.0000, Target: 1.0100, Stop: 0.9965
Position : -
Target : -
Stop : -
New strategy :
Buy at 0.9995, Target: 1.0100, Stop: 0.9960
Position : -
Target : -
Stop : -
As the greenback dropped quite sharply after meeting renewed selling interest at 1.0090, adding credence to our view that temporary top has been formed at 1.0108 on Monday and initial downside risk remains for weakness to 1.0002 (38.2% Fibonacci retracement of 0.9831-1.0108) but reckon support at 0.9995 would limit downside and bring another rebound later, above the Kijun-Sen (now at 1.0049) would bring rebound to 1.0070-75, break there would signal an intra-day low is formed, bring test of said resistance at 1.0090 first. Having said that, only break of this week’s high at 1.0108 would confirm recent upmove from 0.9813 has resumed for headway to 1.0140-45 but price should falter well below another previous resistance at 1.0171.
In view of this, would not chase this rise here and would be prudent to buy dollar on next decline as support at 0.9995 should limit downside. Below 0.9970 (50% Fibonacci retracement of 0.9831-1.0108) would abort and signal recent upmove has ended, bring correction to support at 0.9948.
Trade Idea : GBP/USD – Buy at 1.2485
GBP/USD - 1.2552
Most recent candlesticks pattern : N/A
Trend : Near term down
Tenkan-Sen level : 1.2559
Kijun-Sen level : 1.2528
Ichimoku cloud top : 1.2468
Ichimoku cloud bottom : 1.2436
New strategy :
Buy at 1.2485, Target: 1.2585, Stop: 1.2450
Position : -
Target : -
Stop : -
As cable has continued trading with a firm undertone after this week’s rally, adding credence to our view that low has been formed at 1.2365 on Monday and upside bias remains for the rebound from there to extend gain to 1.2585-90, however, break of previous resistance at 1.2616 is needed to retain bullishness and extend further subsequent rise to 1.2650-60.
In view of this, would not chase this rise here and would be prudent to buy cable on pullback as 1.2481 support should limit downside and bring another upmove later. Below the upper Kumo (now at 1.2468) would defer and suggest top is formed, risk test of 1.2433 (previous resistance) first.

Daily Technical Analysis: EUR/USD Bearish Divergence Creates Bullish Break Above 1.06
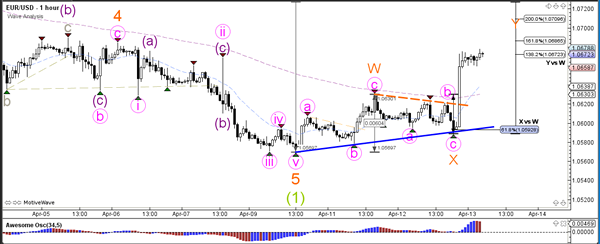
Currency pair EUR/USD
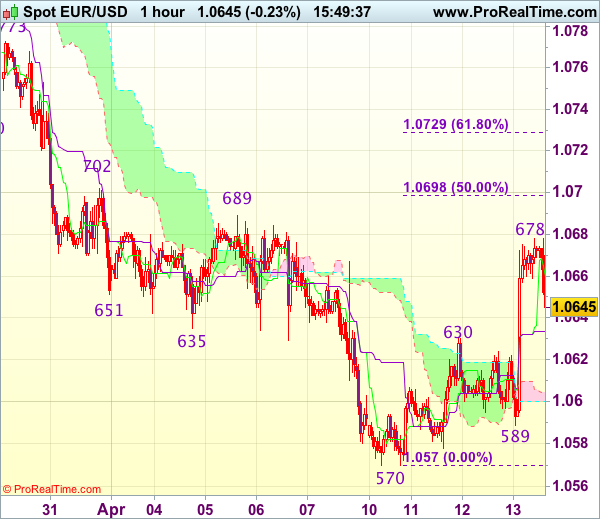
The EUR/USD is finally breaking above the resistance trendline (dotted red) after having built divergence between the bottoms (purple line). This bullish breakout could spark a retracement within wave 2 vs 1 (green).
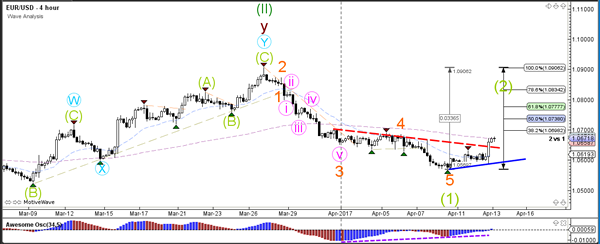
The EUR/USD built a corrective ABC (pink) zigzag as expected to the Fibonacci levels of wave X (orange). Price turned at the 61.8% Fibonacci support level and then broke above the mini trendline (dotted orange). Price is now probably heading towards 1.07, which is the 38.2% Fib of wave 2 vs 1 on the 4 hour chart.
Currency pair GBP/USD
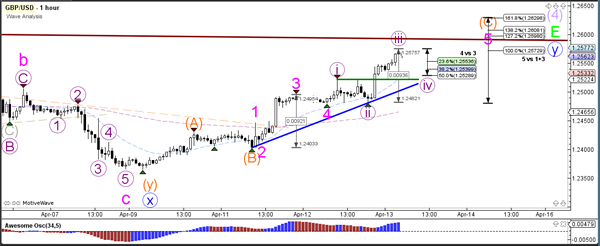
The GBP/USD bullish breakout is still pushing to higher levels within a wave Y (blue), but the price is approaching larger resistance levels (brown/red). This decision zone could see a bearish bounce and turn, whereas a break above the previous top of the triangle (red line) would invalidate wave E (green).
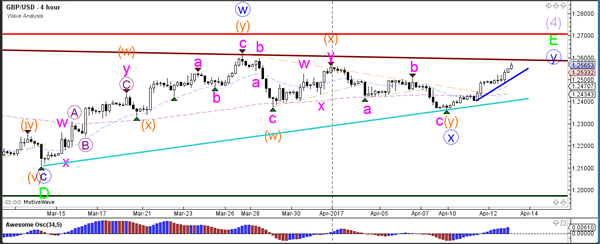
The GBP/USD is probably building another 5 wave pattern (purple) within wave 5 (pink). The wave 4 (purple) is invalidated if the price manages to retrace deeper than the top of wave 1 (green line).
Currency pair USD/JPY
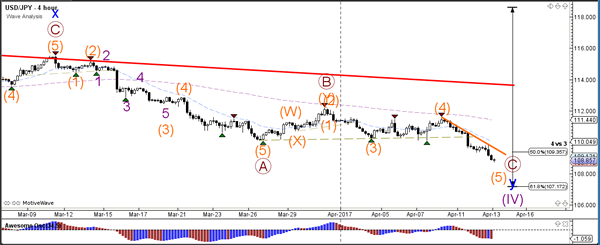
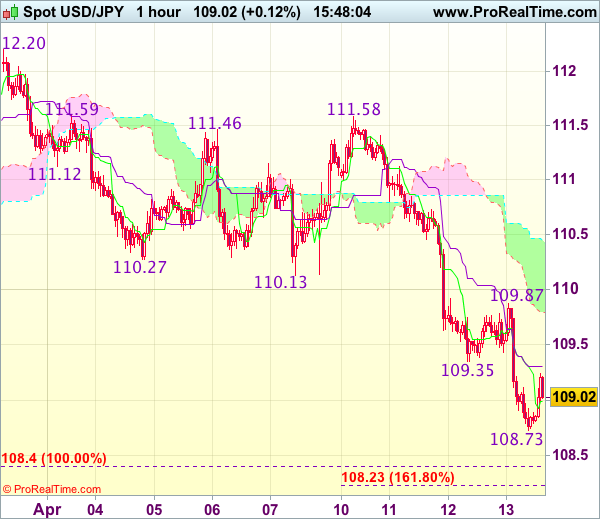
The USD/JPY bearish breakout is so far not showing any signs of slowing down, despite the fact that price is near a 50% Fibonacci level of wave 4 (purple). A strong push below 109 would make a continuation towards the 61.8% Fibonacci retracement likely (plus a new wave structure).
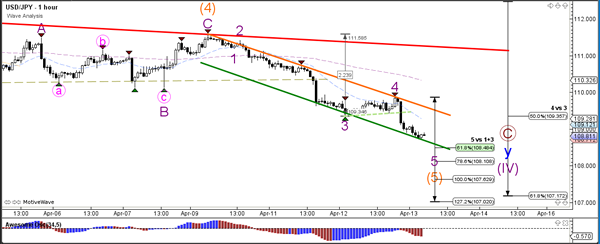
The USD/JPY could soon show divergence between the two bottom, which is typical for a wave 3 and 5 wave structure (purple). Price has also reached the bottom of the channel (green line), which could act as a support level. A bullish bounce above 108.50 could still be considered a reaction to the 50% Fibonacci level of wave 4 vs 3.
Trade Idea : EUR/USD – Hold short entered at 1.0665
EUR/USD - 1.0647
Most recent candlesticks pattern : N/A
Trend : Near term down
Tenkan-Sen level : 1.0660
Kijun-Sen level : 1.0634
Ichimoku cloud top : 1.0606
Ichimoku cloud bottom : 1.0600
Original strategy :
Sold at 1.0665, Target: 1.0565, Stop: 1.0700
Position : - Short at 1.0665
Target : - 1.0565
Stop : - 1.0700
New strategy :
Hold short entered at 1.0665, Target: 1.0565, Stop: 1.0680
Position : - Short at 1.0665
Target : - 1.0565
Stop : - 1.0680
Although the single currency staged a strong rebound after finding support at 1.0589, as this move from 1.0570 is viewed as retracement of recent decline, reckon upside would be limited and bring retreat later, below the upper Kumo (now at 1.0606) would bring test of said support at 1.0589 but break there is needed to signal the rebound from 1.0570 has ended, bring retest of this Monday’s low, below there would extend the decline from 1.0906 to 1.0550-55 (50% projection of 1.0906-1.0635 measuring from 1.0689), then 1.0525-30.
In view of this, we are holding on to our short position entered at 1.0665. A firm break above intra-day resistance at 1.0678 would abort and suggest low has been formed at 1,0570, bring a stronger rebound to 1.0698-02 (50% Fibonacci retracement of 1.0827-1.0570 and previous resistance).
Daily Technical Analysis: EURUSD, GBPUSD, USDJPY, USDCHF
EURUSD
The EURUSD had a bullish momentum yesterday topped at 1.0675 after bounced off the trend line support as you can see on my H4 chart below. The bias is bullish in nearest term testing 1.0700 – 1.0750 area. Immediate support is seen around 1.0630. A clear break below that area could lead price to neutral zone in nearest term retesting the trend line support and 1.0580 support area. On the upside, a clear break and daily close above 1.0750 would expose 1.0873 key resistance once again. Overall I remain neutral.
GBPUSD
The GBPUSD continued its bullish momentum yesterday topped at 1.2547 and hit 1.2555 earlier today in Asian session. The bias remains bullish in nearest term retesting 1.2615 region as a part of the bullish phase after rejection below 1.2375 key support as you can see on my H1 chart below. Immediate support is seen around 1.2520. A clear break below that area could lead price to neutral zone in nearest term testing 1.2480 area. Overall I remain neutral.
USDJPY
The USDJPY continued its bearish momentum yesterday bottomed at 108.95 and hit 108.74 earlier today in Asian session. The bias remains bearish in nearest term testing 108.50 – 107.80 region as a part of the bearish continuation scenario after broke below the range area as you can see on my daily chart below. Immediate resistance is seen around 109.20. A clear break above that area could lead price to neutral zone in nearest term testing 109.85 but overall I remain bearish and any upside pullback should be seen as a good opportunity to sell.
USDCHF
The USDCHF had a bearish momentum yesterday and now struggling around 1.0020 support area which is a good place to buy with a tight stop loss as a clear break back below that area would nullify the bullish phase testing 0.9970 or lower. The bias is bearish in nearest term. Immediate resistance is seen around 1.0060. A clear break above that area could lead price to neutral zone in nearest term but would keep the bullish phase remains valid testing 1.0170 region. Overall I remain neutral.
Trade Idea : USD/JPY – Sell at 109.90
USD/JPY - 109.02
Most recent candlesticks pattern : N/A
Trend : Near term down
Tenkan-Sen level : 108.99
Kijun-Sen level : 109.30
Ichimoku cloud top : 110.45
Ichimoku cloud bottom : 109.80
Original strategy :
Sell at 110.30, Target: 109.30, Stop: 110.65
Position : -
Target : -
Stop : -
New strategy :
Sell at 109.90, Target: 108.90, Stop: 110.25
Position : -
Target : -
Stop : -
The greenback has dropped again after brief recovery to 109.87, adding credence to our bearish view that recent entire decline from 118.66 top is still in progress, hence downside bias remains for recent selloff to extend further weakness to 108.40-50 (100% projection of 118.66-111.55 measuring from 115.51), however, loss of near term downward momentum should prevent sharp fall below 108.20-25 (1.618 times projection of 112.20-110.13 measuring from 111.58) and 108.00 should hold, bring rebound later.
In view of this, would not chase this fall here and would be prudent to sell dollar on recovery as said resistance at 109.87 should limit upside and bring another decline later. Above previous support at 110.13 would abort and suggest low is formed, bring a stronger rebound later to the upper Kumo (now at 110.45).
Technical Outlook: EURUSD – Recovery Rally Could Extend On Break Above 1.0700/20 Pivots
The Euro is consolidating under fresh recovery high at 1.0676, posted overnight, after strong rally in late Wednesday, inspired by comments from President Trump about too strong dollar.
The rally could be seen as correction of broader fall from 1.0905 to 1.0568, which is now eyeing pivotal barriers at 1.0700/14 (Fibo 38.2% of 1.0905/1.0568 descend / daily Kijun-sen), break of which could trigger further recovery towards Fibo 50% and 61.8% levels at 1.0736 and 1.0776 respectively.
Initial bullish signal was generated on false break below daily cloud and subsequent rally above the cloud.
In addition, break above 10SMA (currently at 1.0640) was another boost for the pair, which is on track for bullish weekly close after two weeks in red.
Corrective easing should hold above broken Tenkan-sen line (currently at 1.0628) to keep in play hopes for attack and break above 1.07 pivot.
Res: 1.0676, 1.0700, 1.0720, 1.0736
Sup: 1.0640, 1.0628, 1.0613, 1.0583
Trump U-Turns, Dollar Tumbles
The Greenback and U.S. Treasury yields continued to fall early Thursday, after Trump's comments to the Wall Street Journal that the dollar is getting too strong. According to the U.S. President, he's the one to blame for this, because “people have confidence”in him. Maybe not everyone agrees, with his approval rating currently standing at 40%. More importantly, Trumpsaid “I do like a low-interest rate policy” and that the Treasury would not be labeling China a currency manipulator.
Donald Trump has already made many U-turns after his election, but yesterday's one is of primary concern to currency traders. Duringhis Presidential campaign, he accused Fed Chair Janet Yellen of being “political” and “doing what Obama wants her to do”, by keeping rates at zero. He even called the high equity prices a false market, with the cost of funds being essentially free. Now, he likes a low- interest rate policy and may reappoint Yellen to a new four-year term, possibly adding more doves to voting members. However, markets still believe that the Fed will continue with the tightening process for now, with June's 25 basis points rate hike expectations hovering steady above 60% according to CME's FedWatch. This is likely to limit further steep losses on the USD, but overall there's a high chance that the dollar could have already topped out for the year.
Backing away from labeling China a currency manipulator is another promise he broke. This shift is seen as a positive development bymarkets, as it eliminates the risk of China dumping its U.S. Treasury holdings and reduces the potential for further tensions between the world's largest two economies.
In other currency news the Aussie was the best performer today, rising 0.9% against the USD after the economy added 60,900 jobs in March up from 2,800 the previous month. This was triple the market's expectations for 20,000. More importantly, 74,500 full-time jobs were added while part-time jobs continued to fall, suggesting that interest rates in Australia may have only one direction to go, which is up.
Gold is approaching the key $1,300. The precious metal is benefiting from three main factors at the moment - the dollar's weakness, ongoing geopolitical tensions, and breaking above key resistant points on the charts. I think that investors don't want to dump equities aggressively as we enter the earning season. Instead, they are keeping holding equities and adding some safe havens on the side, which is likely to keep gold supported.
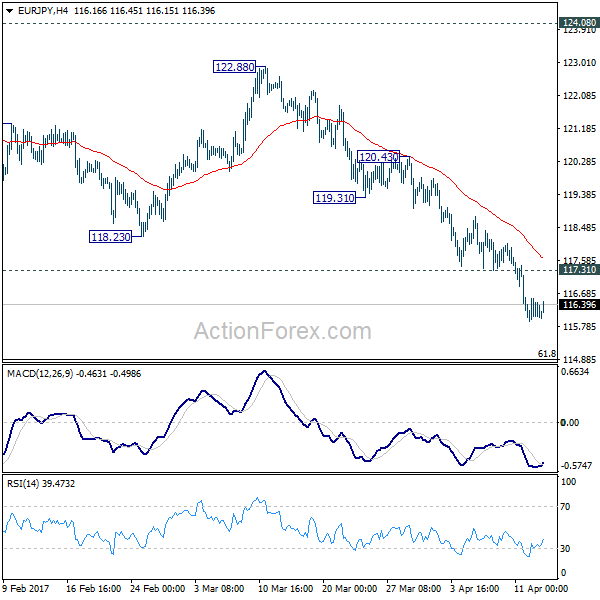
EUR/JPY Daily Outlook
Daily Pivots: (S1) 115.92; (P) 116.23; (R1) 116.54; More...
With 117.31 minor resistance intact, intraday bias in EUR/JPY stays on the downside for 61.8% retracement of 109.20 to 124.08 at 114.88 next. And, sustained break there will pave the way to retest 109.20 low. On the upside, above 117.31 minor resistance will turn bias neutral and bring consolidations. But upside should be limited below 119.31 support turned resistance and bring another fall.
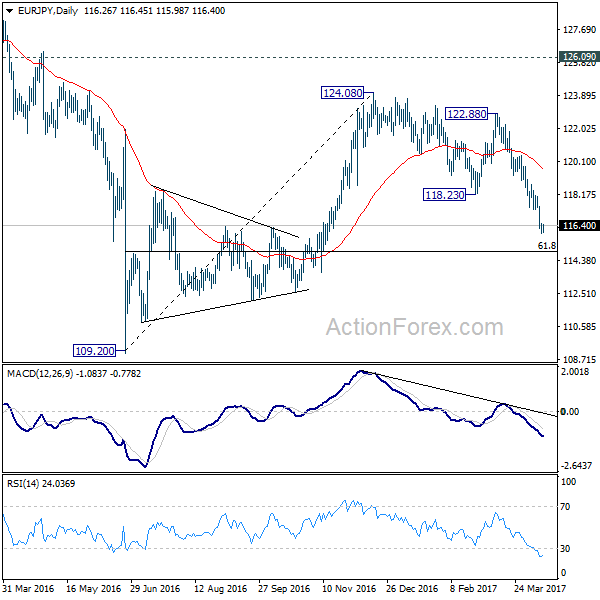
In the bigger picture, the firm break of 38.2% retracement of 109.20 to 124.08 at 118.39 indicates that medium term rise from 109.20 is completed at 124.08. That's well below 126.09 key support turned resistance. Also, EUR/JPY failed to sustain above 55 week EMA. Deeper decline would now be seen back to 109.20 low. Overall, the down trend from 149.76 (2014 high) is not completed yet. Break of 109.20 will resume such down trend towards 94.11 low. In any case, break of 126.09 is needed needed to confirm medium term reversal.