Sample Category Title
EUR/JPY Stalling Below 122.00, EUR/GBP Short-Term Bearish Pressures, EUR/CHF Strengthening.
EUR/JPY Stalling below 122.00.
EUR/JPY's buying pressures are there. Key resistance stands at 123.31 (27/01/0217 high). Major support is given at 114.90 (18/04/2017low). Expected to see short-term consolidation.
In the longer term, the technical structure validates a medium-term succession of lower highs and lower lows. As a result, the resistance at 149.78 (08/12/2014 high) has likely marked the end of the rise that started in July 2012. Strong support at 94.12 (24/07/2012 low) looks nonetheless far away.
EUR/GBP Short-term bearish pressures.
EUR/GBP is going lower. The pair has exited the short-term bullish pattern. The technical structure is negative as long as the resistance at 0.8596 holds. Expected to show continued weakness.
In the long-term, the pair has largely recovered from recent lows in 2015. The technical structure suggests a growing upside momentum. The pair is trading above from its 200 DMA. Strong resistance can be found at 0.9500 psychological level.
EUR/CHF Strengthening.
EUR/CHF continues to push higher, yet very slightly. However, despite the sharp increase and the recent bullish breakout which is very likely psychological, we believe that the medium-term pattern suggests us to see at some point renewed bearish pressures towards key support that can be found at 1.0623 (24/06/2016 low).
In the longer term, the technical structure is mixed. Resistance can be found at 1.1200 (04/02/2015 high). Yet,the ECB's QE programme is likely to cause persistent selling pressures on the euro, which should weigh on EUR/CHF. Supports can be found at 1.0184 (28/01/2015 low) and 1.0082 (27/01/2015 low).
Technical Outlook: Loonie Strengthens On NAFTA Talks, Overbought Techs Suggest Further Strength
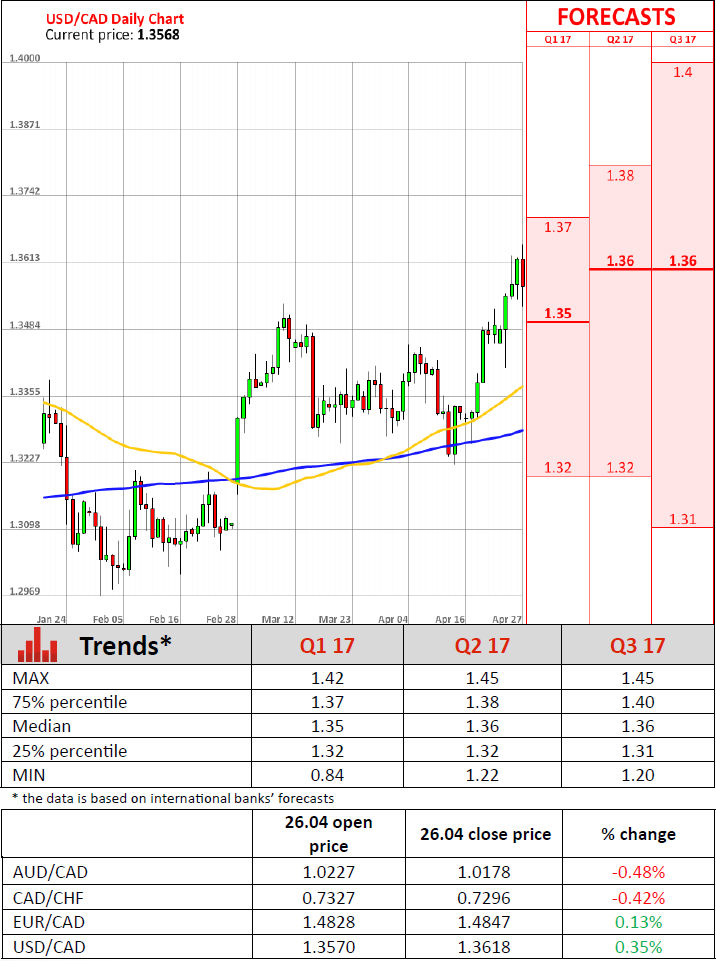
Canadian dollar was sharply higher in Asia on Thursday, supported by comments from US President Trump who said that termination of NAFTA treaty is not at the agenda at this stage of negotiations between the members of the treaty. The news boosted Loonie which was under increased pressure from lumber news earlier this week. USDCAD fell from fresh over one-year high at 1.3645 and spiked to session low at 1.3527. Fresh weakness may extend, as today's fall could be seen as rejection on probe above weekly cloud top (1.3573) and bearish signals building on reversal of daily RSI and slow stochastic from the overbought territory. Focus will be on today's close, which would give another negative signal if in red, with confirmation of reversal seen on extension below 1.3483/70 (Fibo 38.2% of 1.3221/1.3645/rising daily 10SMA). Conversely, return and close above weekly cloud would be seen as bullish signal.
Res: 1.3573, 1.3596, 1.3645, 1.3700
Sup: 1.3527, 1.3483, 1.3470, 1.3412
USD/CHF Trading Sideways, USD/CAD Renewed Buying Pressures, AUD/USD Continued Decline.
USD/CHF Trading sideways.
USD/CHF keeps on declining despite strong volatility. The short-term technical structure is negative as long as prices remain below the hourly resistance at 1.0171 (07/03/2017). Monitor strong support given at 0.9814 (27/03/2017 low).
In the long-term, the pair is still trading in range since 2011 despite some turmoil when the SNB unpegged the CHF. Key support can be found 0.8986 (30/01/2015 low). The technical structure favours nonetheless a long term bullish bias since the unpeg in January 2015.

USD/CAD Renewed buying pressures.
USD/CAD has broken key resistance given at 1.3599 (28/12/206 high). Yet, the pair has failed to go any higher. There is still a strong upside momentum. Hourly support can be found at 1.3411 (24/04/2017 high) then 1.3353 (20/01/2017 high). Expected to show renewed bullish pressures as long as the pair remains above 1.3411.
In the longer term, there is a golden cross with the 50 dma crossing the 200 dma indicating further upside pressures. Strong resistance is given at 1.4690 (22/01/2016 high). Long-term support can be found at 1.2461 (16/03/2015 low).

AUD/USD Continued decline.
AUD/USD has broken support at 0.7473 (12/04/2017 low). As long as prices remain below the resistance at 0.7608 (17/04/2017 high), the short-term technical structure is negative. Key resistance stands at 0.7681 (30/03/2017 high). Expected to show further weakness.
In the long-term, we are waiting for further signs that the current downtrend is ending. Key supports stand at 0.6009 (31/10/2008 low) . A break of the key resistance at 0.8295 (15/01/2015 high) is needed to invalidate our long-term bearish view.
EUR/GBP Candlesticks and Ichimoku Analysis
Weekly
• Last Candlesticks pattern: N/A
• ime of formation: N/A
• Trend bias: Near term up
Daily
• Last Candlesticks pattern: Hammer
• Time of formation: 3 Feb 2016
• Trend bias: Up
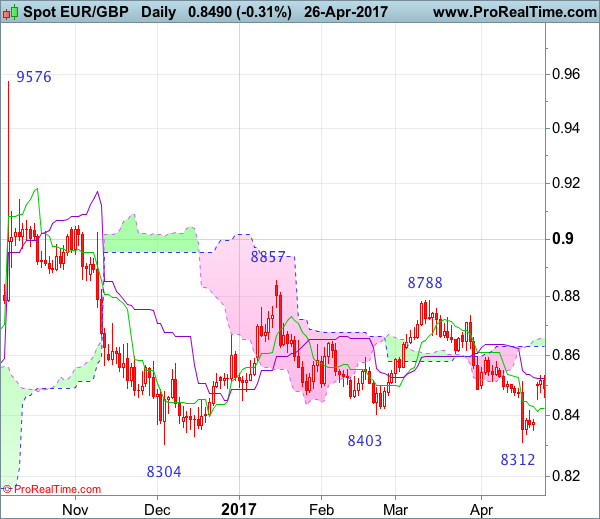
EURGBP – 0.8445
Although the single currency fell briefly to 0.8312 earlier this month, as euro has staged a strong rebound after holding above previous chart support at 0.8304, suggesting low has possibly been formed there and consolidation with mild upside bias is for another bounce, above 0.8530-35 would extend gain to 0.8592 resistance but a daily close above there is needed to signal recent decline has ended instead, bring further gain to the lower Kumo (now at 0.8630), then test of the upper Kumo (now at 0.8656), however, price should falter well below previous resistance at 0.8735, bring retreat later.
On the downside, whilst initial pullback to 0.8400-10 cannot be ruled out, if our view that low has been formed at 0.8312 is correct, downside would be limited to support at 0.8351 and bring another rebound later. A daily close below 0.8351 would abort and signal the rebound from 0.8312 has ended, bring retest of this level first. Looking ahead, only a drop below 0.8304 support would revive bearishness and signal early downtrend has resumed for weakness to 0.8270-75, then 0.8250 but price should stay well above 0.8200-10.
Recommendation: Buy at 0.8400 for 0.8600 with stop below 0.8300.
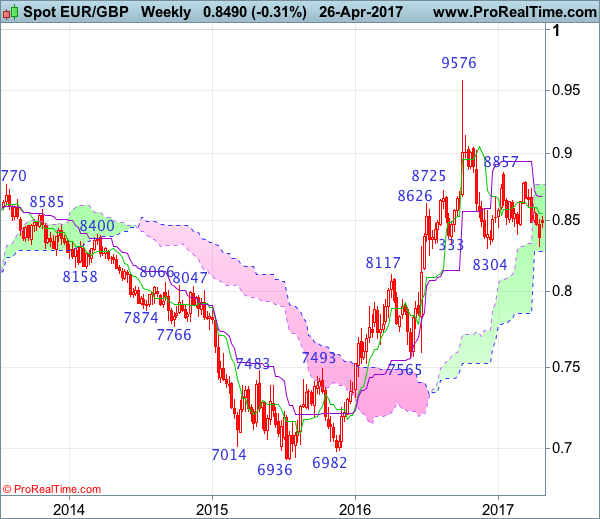
On the weekly chart, as the single currency found good support at 0.8312 last week and staged a strong rebound, suggesting consolidation above this level would be seen and initial upside risk remains, above this week’s high at 0.8531 would bring recovery to the Tenkan-Sen (now at 0.8550) but break of resistance at 0.8592 is needed to signal the fall from 0.8857 has ended, then test of the Kijun-Sen (now at 0.8677) would follow, however, as broad outlook remains consolidative, reckon upside would be limited to 0.8788 resistance, bring retreat later.
On the downside, although initial pullback to 0.8400 cannot be ruled out, as long as minor support at 0.8351 holds, prospect of another rebound remains. A drop below 0.8351 would bring test of indicated support at 0.8304-12, once this level is penetrated, this would signal decline from 0.9576 top has resumed for retest of 0.8304 but only break there would extend the fall from 0.9576 top for retracement of medium term upmove to previous support at 0.8251, then 0.8200.
EUR/USD Consolidating Above 1.0900, GBP/USD Strong Demand, USD/JPY Heading Towards Resistance At 112.20.
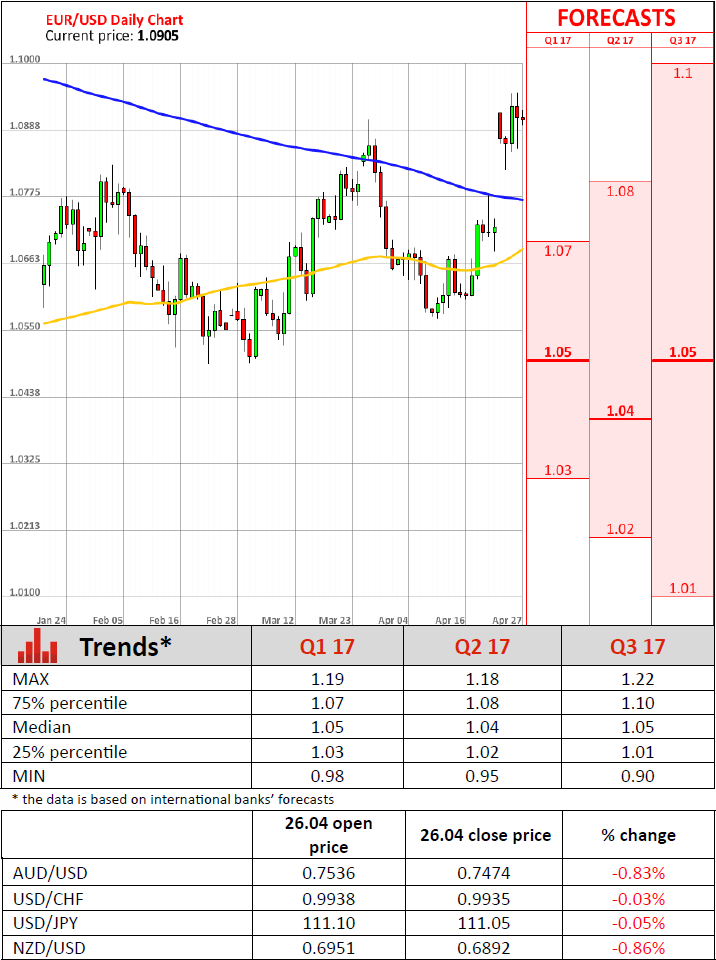
EUR/USD Consolidating above 1.0900.
EUR/USD is pushing higher. Hourly support is given at 1.0856 (26/04/2017 low) then 1.0682 (21/04/2017 base). Stronger support can be found at 1.0494 (22/02/2017 low). Hourly resistance is given at 1.0951 (26/04/2017 high).
In the longer term, the death cross late October indicated a further bearish bias. The pair has broken key support given at 1.0458 (16/03/2015 low). Key resistance holds at 1.1714 (24/08/2015 high). Expected to head towards parity
GBP/USD Strong demand.
GBP/USD is consolidating lower after sharp bullish rally. Resistance at 1.2905 (18/04/2017 low) has been broken. The pair has exited the short-term bearish momentum. Hourly support can be found at 1.2757 (21/04/2017 low). A break of this support would indicate further weakness.
The long-term technical pattern is even more negative since the Brexit vote has paved the way for further decline. Long-term support given at 1.0520 (01/03/85) represents a decent target. Long-term resistance is given at 1.5018 (24/06/2015) and would indicate a long-term reversal in the negative trend. Yet, it is very unlikely at the moment.
USD/JPY Heading towards resistance at 112.20.
USD/JPY is drifting higher. Hourly resistance given at 110.64 (23/04/2017 high) has been broken. Stronger resistance can be found at 112.20 (31/03/2017 high). Closest support can be located at 108.13 (17/04/2017 low). Other key supports lie at a distant 106.04 (11/11/2016 low). Expected to show continued bullish pressures.
We favor a long-term bearish bias. Support is now given at 96.57 (10/08/2013 low). A gradual rise towards the major resistance at 135.15 (01/02/2002 high) seems absolutely unlikely. Expected to decline further support at 93.79 (13/06/2013 low).
Canadian Retail Sales Fall 0.6% In February
'January's strong sales, as well as other recent positive data, still put the first quarter on track for growth of around 3%.' - Andrew Kelvin, TD Securities
A monthly report released by Statistics Canada showed that retail sales slipped more than experts estimated. In February, the amount of sales in the retail sector plunged 0.6% to C$47.8B ($35.1B) after a 2.3% spike in January. Negative growth was recorded in five out of 11 key sectors that represented 67% of the total retail sales. The largest contribution to the February drop was made by the gasoline stations sector, where sales tumbled 3.6% and marked the first decline in three months. The other key contributor was the motor vehicle and parts dealers sector, which posted a 1.8% sales fall for the first time in seven months. In the food and beverage shops sector the weakest sales were registered among liquor stores, which receipts plunged 1.7%. Meanwhile, the largest fall in February occurred in the jewellery, luggage and leather goods stores sub-sector, where sales declined 6.2% in the reported month. In contrast, sales at ordinary clothing and shoe stores soared 3.4% and 2.0%, respectively, and that was enough to offset the overall slip in the clothing sector. In addition, the health and personal care stores sector posted a sales increase of 2.0%. Furthermore, book and music stores also posted a 2.1% gain. Finally, e-commerce sales advanced 27.4% an annual basis, accounting for 2.4% of the total retail sector.
US Crude Oil Inventories Post Third Straight Weekly Decline
'Demand for refined products remains weak for this time of the year, which will be a cause for concern over the coming weeks if demand fails to recover.' - Abhishek Kumar, Interfax Energy's Global Gas Analytics
Last week, US crude oil inventories dropped more than expected, while gasoline and distillate stocks rose markedly, owing to increased production at refineries. The EIA reported on Wednesday that US crude stockpiles fell 3.6M barrels in the week ending April 21, following the preceding week's decline of 1.0M barrels and surpassing expectations for a 1.1M barrel decrease. It marked the third consecutive weekly decline in crude oil inventories and provided support to oil prices. At this time of the year refineries start boosting production ahead of the summer driving season. Therefore, crude inventories are set to fall further, pushing the oil price higher. Refineries' production rose 347,000 barrels per day to 17.3M barrels per day, while the utilisation rate climbed 1.2% to 94.1%, the highest since November 2015. Crude imports rose to 7.8M barrels per day, whereas exports climbed to 1.2M barrels per day, the highest since February 17. Nevertheless, consumption remained subdued, as total production demand dropped 2.2% on an annual basis to 19.5M barrels per day. The EIA also said that gasoline stockpiles advanced 3.4M barrels, while analysts anticipated a 1.0M barrel decline. Moreover, distillate stocks climbed 2.7M barrels, topping expectations for a 1.0M barrel fall.
Bank Of Japan (BoJ) Leaves Its Monetary Policy Unchanged But Cuts Its Inflation Forecast
'Consumer price growth is around zero, which makes all of these price forecasts look overly optimistic. The BOJ upgraded its economic assessment, but this is due more to overseas demand. Japan's labor market is tight, but retailers still want to cut prices.' - Shuji Tonouchi, Mitsubishi UFJ Morgan Stanley Securities
As markets expected, the Bank of Japan left its monetary policy unchanged at its meeting on Thursday; however, policymakers an optimistic and confident view on the economy in the future amid higher oversees demand. The Central bank voted to keep its short-term interest rate at -0.10% and asset purchases unchanged at about 80 trillion yen ($700B) annually. At yesterday's meeting, the Bank also cut its core inflation forecast for the year ending in March 2018 to 1.4% from 1.5%, due to low services and durable goods prices. Moreover, policymakers stated that their inflation projections remained weak and, therefore, the Bank's monetary policy could be kept on hold for an indefinite period of time. Although, the BoJ expressed hopes that inflation would reach its 2% target in the year ending March 2019. Nevertheless, a majority of economists doubt that inflation will pick up as the BoJ forecasts with subdued pay growth putting pressure on consumer spending. Furthermore, back in February, consumer prices rose just 0.2% on an annual basis amid weak consumption. Overall, the Japanese economy is expected to continue expanding at a moderate pace, according to the Bank's projections. However, the BoJ is unlikely to withdraw some of its stimulus in the near-term.

CAD And MXN Recover After Trump Says US Won’t Quit NAFTA
USD’s dead cat bounce
The euphoria that surrounded President Trump's tax plan announcement did not last long as, surprisingly, he failed to provide concrete policy details. After starting the day on the front foot, the US stock market reversed gains and pushed most indices into negative territory. European markets followed Wall Street leads and opened below the neutral threshold on Thursday, with the Euro Stoxx 600 sliding 0.40%. In the FX market, the US dollar was unable to consolidate pre-announcement gains and lost ground against most G10 currencies.
The Canadian dollar was the best performer this morning as it rose 0.35% against the greenback, erasing yesterday's losses completely. After tumbling earlier this week when Trump slapped tariffs on imported Canadian softwood lumber, the loonie got a breath of fresh air amid a declaration that the US will not terminate NAFTA 'at this time' but would rather try to re-negotiate the treaty.
Since the threat of the US leaving NAFTA was the biggest headache for Mexico and Canada, we anticipate that selling pressures on the CAD and the MXN will ease further. However, we believe that we won’t see a sharp rally as the unpredictability of Trump will keep investors on the defensive.
Draghi set to show optimism in Eurozone recovery
Today's European Central Bank meeting is in the middle of the French Presidential election and the European institution certainly welcomed Emmanuel Macron's victory in the first round as there were certainly fears of a second round pitting Jean-Luc Mélenchon against Marine Le Pen.
Now ECB President Mario Draghi, whose press conference will be given at 1.30pm CET, is going to discuss his views regarding the Eurozone recovery. For the time being, it is very likely that the current level of asset purchases (€60 billion) will continue until year-end. We believe that for some more time, the ECB will remain committed to low rates.
Financial markets are clearly not pricing anything else but a Macron victory in France, which seems to rule out any political risks for the ECB. In Europe, economic fundamentals are better, inflation is picking up and unemployment has decreased, even though it remains very high in peripheral countries. So this meeting will be useful to assess the degree of optimism that could lead to a tightening policy in the near future. Markets are likely to price in better confidence and we remain bullish on the Euro in the short-term.
Technical Outlook: AUDUSD Remains Under Strong Pressure, Limited Recovery Keeps Immediate Risk At The Downside
The pair is consolidating on Thursday after suffering heavy losses earlier this week. Wednesday's strong bearish acceleration extended below key supports at 0.7490/70 and dipped to 0.7453 (50% retracement of 0.7159/0.7747 rally) where it found temporary footstep.
Recovery attempts were so far capped by last week's low at 0.7490, which is guarding weekly cloud top at 0.7518 and signaling limited upside. Near-term risk remains turned lower for renewed attempts below cracked 100SMA (0.7463) and yesterday's low (0.7453) to extend bear-phase from 0.7747 (21 Mar high) towards next target at 0.7384 (Fibo 61.8% of 0.7159/0.7747).
Res: 0.7490, 0.7518, 0.7531, 0.7553
Sup: 0.7463, 0.7453- 0.7384, 0.7329