
Sample Category Title
Daily Technical Analysis: EUR/USD Bearish Momentum Could Break Bullish Channel
Currency pair EUR/USD
The EUR/USD is in a channel (red/blue lines) which is struggling to break above the 61.8% Fibonacci retracement level of wave 2 (green) near the round level of 1.10. A breakout above or below a trend line could indicate the next direction. A bullish break indicates a continuation within wave C (purple) whereas a bearish break indicates a potential reversal.
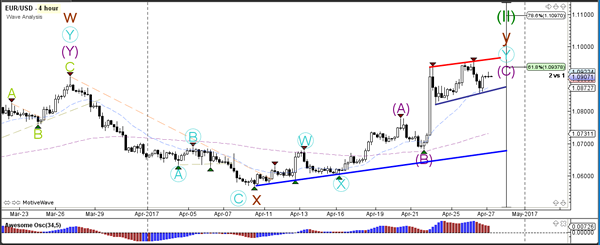
The EUR/USD could have completed waves 5 (grey/pink) within wave C (purple) if price manages to break below the support trend line (blue). If that occurs, price could be building either an ABC (orange) or 12345 (red).
Currency pair GBP/USD
The GBP/USD broke the bull flag chart pattern (dotted orange) but the larger sideways zone (red/blue lines) remains intact. A potential bullish breakout could challenge 1.30.
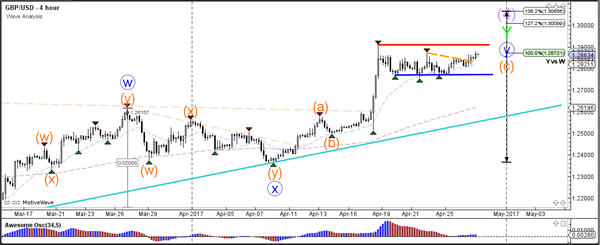
The GBP/USD seems to be in a wave 5 (purple) and its first target is 1.2925 at the 200% Fibonacci level.
Currency pair USD/JPY
The USD/JPY could have completed wave 3 (brown) due to the bearish engulfing twins, which is the candlestick pattern that emerged near the 112 resistance. Price could now be building a potential wave 4 (brown) retracement if price stops at one of the shallow Fibonacci levels (23.6-50%).
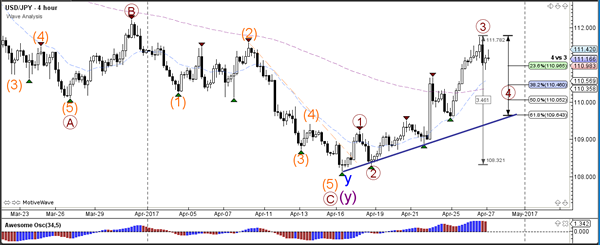
The USD/JPY has already made a retracement to and bounce at the 23.6% Fibonacci retracement level of wave 4 (brown). A break below the support trend line (green) could see a larger retracement unfold.

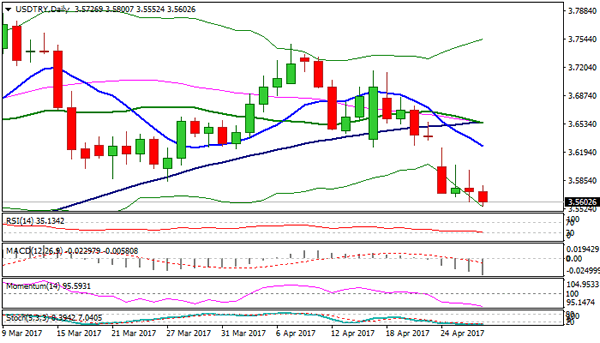
Technical Outlook: TRY Remains Well Supported And Attacks Key Support At 3.5555
Turkish lira continues to trend higher against the dollar after starting the week with gap-higher opening and being on track for strong bullish weekly close.
Weaker dollar and positive economic environment boosted lira which is attacking key support at 3.5555 (23 Feb trough) which lies near another pivot at 3.5489 (Fibo 38.2% of 2.9137/3.9416 Aug-Jan rally). Break here would generate strong bearish signal for extension of pullback from fresh record high at 3.9416 (11 Jan peak) and expose targets at 3.5159 (weekly Kijun-sen) and psychological 3.5000 support. Pair's session high at 3.5800 and former low of 27 Mar at 3.5850 mark initial resistances, followed by 3.6000 (round-figure barrier) and week's high at 3.6245.
Res: 3.5660, 3.5800, 3.5850, 3.6000
Sup: 3.5555, 3.5489, 3.5301, 3.5159
Market Update – European Session: ECB Expected To Hold Off Any Any Hawkish Tendencies, Riksbank Extends QE For Another...
Notes/Observations
Unlikely that ECB would alter its policy language at the April meeting ahead of France 2nd round elections
Sweden Central Bank (Riksbank) surprises with dovish stance; extends govt bond buying for another six months citing global uncertainties
German State Apr CPI data rebounds from month ago levels to around the ECB target area
Overnight:
Trump Tax plan highlights:
Reduces 7 tax brackets to 3 tax brackets of 10%, 25% and 35%; cuts business rate to 15%
Repeals estate tax would be an immediate repeal not a phase out
Repeals deductions on state and local taxes; repeals 3.8% ACA tax
Doubles the standard deduction ($12K for individuals, $24K for families)
Provides tax relief for families with child and dependent care expenses
Repeals Alternative Minimum Tax; repeals inheritance tax "death tax"
Maintains home ownership and charitable gift tax deductions
Offers one-time tax on trillions of dollars of corporate money held overseas
Eliminates tax breaks for special interests
Territorial tax system to level the playing field for American companies
Asia:
(KR) South Korea Q1 Preliminary GDP Q/Q: 0.9% v 0.8%e; Y/Y: 2.7% v 2.6%e
(JP) Bank of Japan (BOJ) keeps policy steady (as expected); Leaves Interest Rate on Excess Reserves (IOER) unchanged at -0.10%; maintained its policy framework of "QQE with Yield Control" and asset purchases at annual pact of ¥80T; Economic Assessment was tweak to economy has been turning towards a moderate expansion (prior continued to recover moderately as a trend); BOJ Outlook Report raised FY17/18 GDP growth outlook from 1.5% to 1.6% and FY18/19 GDP growth outlook from 1.1% to 1.3% (as speculated); Lowered FY17/18 core CPI outlook from 1.5% to 1.4% (as speculated)
US looking at putting North Korea on list of state sponsors of terrorism
Europe:
EU Commission: Juncker and UK PM May had constructive meeting in London on Wed about the Brexit process
Americas:
White House: President Trump agrees to not terminate NAFTA at this time after conversations with Mexico's Nieto and Canada's Trudeau
Economic Data
(DE) Germany Apr GfK Consumer Confidence: 10.2 v 9.9e (matched highest level since Oct 2001)
(CH) Swiss Mar Trade Balance (CHF): 3.1B v 3.1B prior; Real Exports M/M: +2.5 v -1.5% prior; Real Imports M/M: -1.4 v +2.7% prior
(FI) Finland Mar Unemployment Rate: 9.6% v 9.2% prior
(FI) Finland Apr Consumer Confidence: 21.5 v 22.9 prior; Business Confidence: 5 v 4 prior
(DE) Germany Apr CPI Saxony M/M: -0.1% v +0.2% prior; Y/Y: 2.1% v 1.8% prior
(ES) Spain Apr Preliminary CPI M/M: 1.0% v 0.9%e; Y/Y: 2.6% v 2.5%e
(ES) Spain Apr Preliminary CPI EU Harmonized M/M: 0.9% v 0.7%e; Y/Y: 2.6% v 2.3%e
(ES) Spain Q1 Unemployment Rate: 18.8% v 18.6%e
(TR) Turkey Apr Economic Confidence: 99.5 v 96.0 prior
(SE) Sweden Central Bank (Riksbank) left its Repo Rate unchanged at -0.50% (as expected) but extended its govt bond buying program (QE) by SEK15B during the H2 of 2017
(DE) Germany Apr CPI Brandenburg M/M: -0.1% v 0.3% prior; Y/Y: 1.8% v 1.4% prior
(DE) Germany Apr CPI Hesse M/M: 0.0% v 0.0% prior; Y/Y: 2.1% v 1.7% prior
(DE) Germany Apr CPI Bavaria M/M: -0.1% v +0.4% prior; Y/Y: 1.9% v 1.7% prior
(IT) Italy Apr Consumer Confidence: 107.5 v 107.4e; Manufacturing Confidence: 107.9 v 107.3e v 107.1 prior, Economic Sentiment: No est v 105.1 prior
(AT) Austria Apr Manufacturing PMI: 58.1 v 56.8 prior (16th month of expansion and highest since March 2011)
(DE) Germany Apr CPI North Rhine Westphalia M/M: 0.1 v 0.1% prior; Y/Y: 2.1% v 1.7% prior
(PT) Portugal Apr Consumer Confidence: -1.8 v -3.4 prior; Economic Climate Indicator: 1.8 v 1.6 prior
(EU) Euro Zone Apr Business Climate Indicator: 1.09 v 0.82e; Consumer Confidence (Final): -3.6 v -3.6e , Economic Confidence: 109.6 v 108.2e , Industrial Confidence: 2.6 v 1.3e, Services Confidence: 14.2 v 12.9e
Fixed Income Issuance:
(DK) Denmark sold total DKK700M in 1-month and 4-month Bills
(SE) Sweden sold SEK750M in I/L 2019 bond; Yield: -2.0521% v -0.165% prior; Bid-to-cover: 5.0x v 9.84x prior
(IT) Italy Debt Agency (Tesoro) sold total €5.25B vs. €4.25-5.25B indicated range in 5-year and 10-year BTP Bonds
Sold €2.5B vs €2.0-2.5B indicated in 1.20% Jan 2022 BTP; Avg Yield: 1.04% v 1.04% prior; Bid-to-cover: 1.59x v 1.51x prior
Sold €2.75B vs €2.25-2.75B indicated in 2.2% June 2027 BTP; Avg Yield: 2.29% v 2.25% prior; Bid-to-cover: 1.32x v 1.36x prior
(IT) Italy Debt Agency (Tesoro) sold €3.5B vs. €3.0-3.5B indicated in Feb 2024 CCTeu (Floating Rate Bond); Avg yield: 0.93% v 0.70% prior; Bid-to-cover: 1.29x v 1.33x prior
SPEAKERS/FIXED INCOME/FX/COMMODITIES/ERRATUM
Index snapshot (as of 10:00 GMT)
Indices [Stoxx50 -0.5% at 3,560, FTSE -0.5% at 7,250, DAX -0.4% at 12,428, CAC-40 -0.4% at 5,264, IBEX-35 -0.9% at 10,668, FTSE MIB -0.6% at 20,703, SMI -0.2% at 8,815, S&P 500 Futures flat]
Market Focal Points/Key Themes: European equity indices are trading lower after a raft of corporate earnings pre-market and as market participants await the ECB's monetary policy decision due later today; Banking and financial stocks trading notably lower in the major European indices with shares of Deutsche Bank and BBVA leading sector losses after releasing their respective Q1 results, shares of insurer Munich Re the notable laggard in the Eurostoxx; shares of Nokia and Bayer notably outperforming in the index after releasing respective Q1 results; shares of Legal & General the laggard in the FTSE 100 after Credit Suisse initiated with underperform; shares of Lloyds however outperforming trading positive after releasing their Q1 results; Energy stocks trading lower as oil prices trade sharply lower intraday.
Upcoming scheduled US earnings (pre-market) include American Airlines, AllianceBernstein, AbbVie, Asbury Automotive, American Electric Power, Applied Industrial Technologies, Allegion, Ally Financial, Alexion Pharmaceuticals, American Tower, AO Smith, Air Products and Chemicals, Avnet, Brunswick, Bemis, Bristol-Myers Squibb, Boston Scientific, BorgWarner, CBRE Group, Celgene, Check Point Software, Cliffs Natural Resources, Comcast, CME, Carter's, Carpenter Technology, Constellium, Cooper Tire, Deluxe Corp, Dow Chemical, Dominos Pizza, DST Systems, EMCOR Group, EQT Corp, Ford Motor, First American, FTI Consulting, Franklin Electric, Generac, Helmerich & Payne, MarineMax, Intelsat, ICON, International Paper, Iron Mountain, Invesco, Johnson Controls, KKR, Lazard, LKQ, L-3 Technology, Southwest Airlines, Milacron Holdings, Meredith, MGM Resorts, Marsh & McLennan, Marathon Petroleum, MPLX, Maritage Homes, Nord Anglia, Oaktree Capital, Old Dominion, Old Republic, Penn National Gaming, Pinnacle Foods, Parker Hannifin, PolyOne, Potash, Patterson-UTI, Praxair, Radian Group, Reliance Steel and Aluminum, Raytheon, Servicemaster Global Holdings, Sirius XM, Simon Property Group, Extended Stay America, Teradata, Gentherm, Taylor Morrison, Under Armour, Domtar, Universal Logistics, Union Pacific, UPS, USG, Visteon, WESCO International, WEX, West Pharmaceuticals, Xcel Energy, Yandex, and Zimmer Biomet.
Equities (as of 09:50 GMT)
Consumer Discretionary: [Beiersdorf BEI.DE +0.5% (Q1 sales), Hermes RMS.FR +1.0% (Q1 sales), Lufthansa LHA.DE -1.9% (Q1 results), Persimmon PSN.UK +1.1% (trading update), WPP WPP.UK -2.1% (Q1 sales)]
Energy: [Total FP.FR -0.1% (Q1 results)]
Financials: [BBVA BBVA.ES -1.8% (Q1 results), Deutsche Bank DBK.DE -3.2% (Q1 results), Legal & General LGEN.UK -5.7% (analyst action), Lloyds Banking LLOY.UK +3.7% (Q1 results), Skandinaviska Enskilda Ban SEBA.SE +0.2% (Q1 results)]
Healthcare: [AstraZeneca AZN.UK -1.2% (Q1 results), Bayer BAYN.DE +3.2% (Q1 results, CFO to step down), Roche ROG.CH +0.8% (Q1 sales)]
Industrials: [Airbus AIR.FR -0.8% (Q1 results), BASF BAS.DE -2.5% (Q1 results), Kion Group KGX.DE -2.4% (Q1 results), Meggitt MGGT.UK -1.3% (Q1 sales), Taylor Wimpey TW.UK +0.2% (trading update)]
Materials: [Clariant CLN.CH +2.1% (Q1 results), Svenska Cellulosa SCAB.SE +1.6% (Q1 results), Wacker Chemie WCH.DE -2.4% (Q1 results)]
Technology: [STMicroelectronics STM.FR +1.7% (Q1 results), Wirecard WDI.DE -1.2% (prelim Q1 results)]
Telecom: [Com Hem COMH.SE +7.6% (Kinnevik acquires 18.5% stake), Nokia NOK1V.FI +6.4% (Q1 results), Orange ORA.FR -1.3% (Q1 results)]
Speakers
German Chancellor Merkel spoke in her in Parliament ahead of EU Brexit Summit noting that Brexit negotiations would be demanding on both sides during the 2-year window. She expected strong signal of unity from EU27 and shared EU's Juncker view that Brexit negotiations could only properly get going after the Jun 8th UK elections. Germany to press for clarity status of Germans living in Britain during negotiation period and added that was ready to give fair offer to Britains living in EU
Sweden Central Bank (Riksbank) policy statement noted that it would take longer before inflation stabilized around 2%, It noted that to support the upturn in inflation, monetary policy needed to be somewhat more expansionary and announced the expansion of its govt bond buying program (QE) by SEK15B into H2 2017 (**Note: program was set to expire in June). - Still considerable uncertainty over political and economic developments abroad. Members Floden, Ohlsson and Skingsley entered reservations against the decision to extend QE bond buying scheme. Believed that monetary policy did not need to be more expansionary. Repo Rate now not expected to be raised until Mid-2018 (pushed out further) and reiterated that saw likelihood of a rate cut over a hike
Sweden Central Bank (Riksbank) Gov Ingves post rate decision press conference reiterated that SEK currency (Krona) should gradually appreciate. Noted that recent wage agreements had been lower than expected
Eurogroup chief Dijsselbloem commeted from EU Parliament that he was confident that an agreement on a full Greek package would be reached soon. Expected Greece payout deal by end of May and foresaw renewed IMF contribution to the Greek bailout rescue
Czech Fin Min Babis: PM Sobotka taking steps to remove him from position
BOJ Gov Kuroda post rate decision press conference noted that the virtuous economic cycle was strengthening and that BOJ would continue with QQE until prices hit its inflation target. Reiterated view to achieve the 2% inflation target during FY18/19 as momentum remained in place but not sufficiently strong. Reiterated view to adjust policy if needed to maintain momentum towards price target. Needed to achieve 2% inflation target before discussing exit strategy as any premature discussion on exit strategy would confuse markets
China PBoC Dep Gov Fan Yifei reiterated govt stance to take measures preventing financial risks; confident it would maintain stability
RBA Gov Lowe: China needs to strike a balance while tightening capital outflows as it runs counter to its longer-run goal of liberalization
Iraq Oil Min Al-Luaibi stated that he supported extension of oil production cuts in H2 'in principle'. OPEC-led production cuts was gradually leading to market balance. He noted that possibility of deeper cuts was not on the table
Libya Sharara oil field said to be back online after pipeline protests end
Currencies
EUR/USD was steady around the 1.09 area ahead of the ECB rate decision. The pair did test a 5-month high earlier in the week at 1.0950. German State Apr CPI data rebounded from month ago levels to around the ECB target area and added to optimism that Europe continued to improve in its recovery. Focus of the ECB meeting likely be on the recent run of stronger growth and inflation data out of the Euro Zone and possibility that the taper argument could be revisited as the fundamental picture in Europe was improving. Dealers believed that it was unlikely that ECB would alter its policy language at the April meeting. There had been speculation that ECB could discuss removing some of its easing biases in the June statement. Outcome of French first round election on Sunday with Macron expected to win outright in May seemed have eased some concerns at ECB thus its overall tone could be more optimistic
The EUR/SEK was higher after the Riksbank surprised with an extension of its QE bond buying program for another 6 months. Dealers had believed that monetary policy did not need to be more expansionary at this time. EUR/SEK higher by 0.5% and approaching the 9.60 area.
USD/JPY was marginally higher after BOJ kept its policy steady and slightly amended its economic assessment upwards. Pair at 111.30 just ahead of the NY morning.
The CAD currency (Loonie) and MXP (peso) were firmer after President Trump noted that he would not scrap NAFTA but renegotiate the trade agreement.
Fixed Income
Bund futures trade at 161.30 up 2 ticks trading at the upper end of the today's range with the slight risk off tone helping put a bid in futures. A move lower targets week low at 160.65 followed by 160.15. Resistance moves to 161.63 then 162.02 with eventual target of 162.52 gap fill.
Gilt futures trade at 128.16 down 2 ticks trading off the lows in rangebound trade. Continuation to the downward trend eyes 127.94 followed by 127.74. Resistance stands at 128.58 then 128.81 followed by 129.14. Short Sterling futures trade flat to up 1bp with Jun17Jun18 flattening slightly to 12.0/12.5bp.
Thursday's liquidity report showed Wednesday's excess liquidity rose to €1.608T a rise of €4B from €1.604T prior. Use of the marginal lending facility rose to €313M from €120M prior.
Corporate issuance saw $6.2B come to market via 3 issuers with State Grid $5B 4 part offering accounting for the bulk of the issuance. Issuance for the week tops $12B and monthly issuance tops $68B.
Looking Ahead
(PT) Bank of Portugal Releases Bank Supervision Report
(BR) Brazil Mar Central Govt Budget Balance (BRL): -8.6Be v -26.3B prior
(CO) Colombia Mar Industrial Confidence: No est v -0.1 prior; Retail Confidence: No est v 23.2 prior
05:30 (HU) Hungary Debt Agency (AKK) to sell Bonds (3 tranches)
06:00 (CZ) Czech Republic to sell 6-month Bills
06:00 (UK) Apr CBI Retailing Reported Sales: 6e v 9 prior, Total Distribution: No est v 32 prior
06:00 (IL) Israel Mar Trade Balance: No est v -$1.4B prior
06:00 (IL) Israel Feb Manufacturing Production M/M: No est v 0.0% prior
06:45 (US) Daily Libor Fixing
(ES) Spain Mar YTD Budget Balance: No est v -€10.8B prior
07:00 (BR) Brazil Apr FGV Inflation IGPM M/M: -1.0%e v 0.0% prior; Y/Y: 3.5%e v 4.9% prior
07:45 (EU) ECB Interest Rate Decision: ECB expected to keep key rates unchanged
08:00 (BR) Brazil Mar PPI Manufacturing M/M: No est v -0.3% prior; Y/Y: No est v +0.3% prior
08:00 (DE) Germany Apr Preliminary CPI M/M: -0.1%e v +0.2% prior; Y/Y: 1.9%e v 1.6% prior
08:00 (DE) Germany Apr Preliminary CPI EU Harmonized M/M: -0.1%e v +0.1% prior; Y/Y: 1.9%e v 1.5% prior
08:15 (UK) Baltic Dry Bulk Index
08:30 (US) Initial Jobless Claims: 245Ke v 244K prior; Continuing Claims: 2.02Me v 1.979M prior
08:30 (US) Mar Advance Goods Trade Balance: -$65.2Be v -$64.8B prior
08:30 (US) Mar Preliminary Wholesale Inventories M/M: 0.2%e v 0.4% prior; Retail Inventories M/M: No est v 0.4% prior
08:30 (US) Mar Preliminary Durable Goods Orders: 1.3%e v 1.8% prior; Durables Ex-Transportation: 0.4%e v 0.5% prior; Capital Goods Orders (Non-defense ex aircraft): +0.5%e v -0.1% prior, Capital Goods Shipments (non-defense/ex-aircraft): 0.1%e v 1.0 prior; Durables Ex-Defense: No est v 2.2% prior
08:30 (US) Weekly USDA Net Export Sales
08:30 (EU) ECB chief Draghi post rate decision press conference
09:00 (RU) Russia Gold and Forex Reserve w/e Apr 21th: No est v $398.4B prior
09:00 (MX) Mexico Mar Trade Balance: $1.0Be v $0.7B prior
10:00 (US) Mar Pending Home Sales M/M: -1.0%e v +5.5% prior; Y/Y: No est v -2.4% prior
10:30 (US) Weekly EIA Natural Gas Inventories
11:00 (US) Apr Kansas City Fed Manufacturing Activity: 17e v 20 prior
11:00 (BR) Brazil to sell Fixed Rate 2023 and 2027 Bonds
11:00 (BR) Brazil to sell LTN 2017, 2019 and 2020 LTN Bills
13:00 (US) Treasury to sell 7-Year Notes
Trump Sends Peso Loonie
A Trump NAFTA backtrack sees an aggressive rally in both the Mexican Peso (MXN) and the Canadian Dollar (CAD) during the Asia session.
It's been a tough couple of days for America's NAFTA partners, Mexico and Canada. Both had been feeling the pinch from lower oil prices before President Trump decided to slap a tariff on Canadian Lumber. The picture got even muddier with President Trump's announcement yesterday that he intended to withdraw from NAFTA and renegotiate. This saw both the CAD (the Loonie in FX speak) and the MXN come under sustained pressure.
Most particularly the MXN dream run since late January looked in danger. The central bank intervened to sell USD/MXN above 22.0000 and since, the MXN had rallied all the way back to the 18.4500 regions. The peso had sunk from there back to 19.2950 as off last night with a 1+ % move lower alone yesterday as the U.S. administration tightened the screws.
USD/CAD has been threatening to break out of the topside of its last six months range as well, threatening a sustained break of the 1.3600 level as Mr Trump said lumberjacks are not ok and then said NAFTA was becoming No-FTA.
This all came to an abrupt end this morning in Asia with a Trump volte-face after what must have been an interesting three-way phone call between the respective leaders of each country.
10:35 (US) White House: President Trump agrees to not terminate NAFTA at this time after conversations with Mexico's Nieto and Canada's Trudeau – All leaders agree to “enable renegotiation of NAFTA deal” at a later date. – Source TradeTheNews.com
One suspects the renegotiation will be more USFTA than NAFTA, but the effect was immediate, with both the MXN and CAD rallying 2300 points and 100 points respectively. USD/MXN was dropping from 19.2350 to 18.9950 and USD/CAD from 1.3650 to 1.3550 in about the length of time it has taken me to type this. (I use two fingers)
Both currencies will be clearly vulnerable to headlines going forward as they enter the “renegotiation.” The price action illustrates the market's perception of how intrinsically linked economically, to the whims of the United States, the troublesome neighbours to the North and South are.
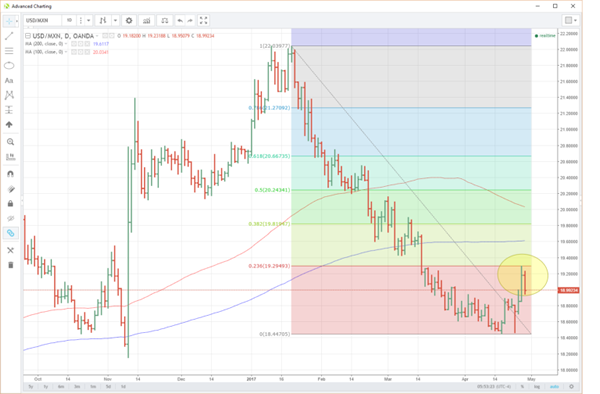
USD/MXN
The Peso has been on a stellar run since mid-January as Trump-flation gave way to Trump-fatigue and noise about paying for a border wall faded.
Looking at the chart below all is not lost for the peso, however. Yesterdays USD/MXN rally stopped exactly at the 23.6% retracement level of the entire Jan-April move. Thus, 19.2950 becomes the first major resistance followed by the 200-day moving average at 19.6117.
Support is clearly denoted by the double bottom formed this month at 18.4470. Behind this are the lows of the Trump election day at 18.1606 which shows just how impressive the Peso rally has been.
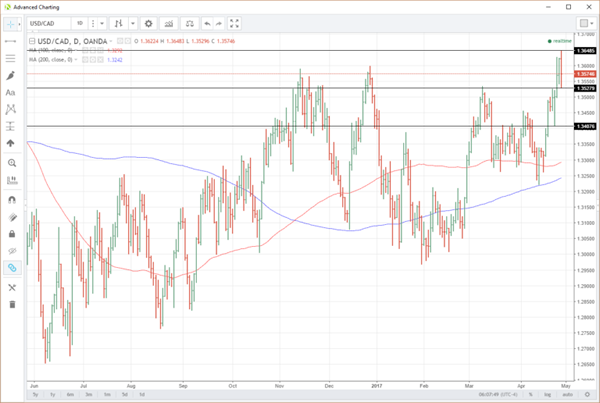
USD/CAD
The Loonie has been mired in a 1.3000 to 1.3600 from September last year. Oil prices, a weaker USD in the new year, and asthmatic economic data have combined to cancel each other out. This has all changed in the last week or so, as the three amigos combined to push in one direction, most particularly a stronger USD and weaker oil prices following last week's CPI undershoot.
The technical picture is less clear in this currency pair. USD/CAD has support at the overnight low at 1.3528 with a break suggesting a move back into the range and drifts to the 1.3400 regions. Interestingly if USD/CAD closes below 1.3542 today (yesterday's low), it will have traced out an outside reversal day. In this case, a bearish formation.
Resistance sits at today's high around 1.3650 with a break and consolidation above 1.3600 suggesting a technical move to 1.4000 will occur going forward.
Summary
Both the MXN and CAD will be vulnerable to NAFTA-driven headlines going forward. Particularly due to the penchant of the U.S. President's penchant for policy u-turns at short notice. The MXN has enjoyed an amazing multi-month rally and the price action of this week in itself is but a flesh wound to the overall move. The CAD, however, could be potentially more vulnerable to the bad news suddenly being priced in is really only just possibly beginning.
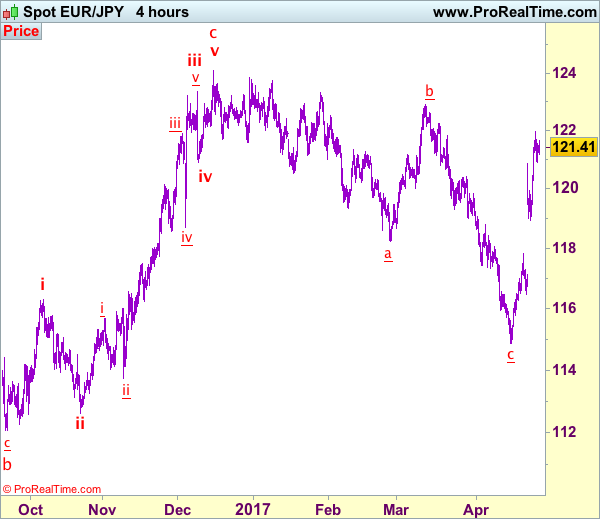
Trade Idea: EUR/JPY – Buy at 120.30
EUR/JPY - 121.37
Recent wave: wave v of (C) ended at 94.12 and major correction in wave A has ended at 149.79
Trend: Near term up
Original strategy:
Buy at 120.20, Target: 122.20, Stop: 119.60
Position: -
Target: -
Stop: -
New strategy :
Buy at 120.20, Target: 122.20, Stop: 119.60
Position: -
Target: -
Stop:-
As the single currency has maintained a firm undertone after rising to 121.98 yesterday, adding credence to our bullish view that the rise from 114.85 low (wave c trough) is still in progress and upside bias is seen for further gain to resistance at 122.26, above there would encourage for headway to 122.50-60 but loss of momentum should prevent sharp move beyond 123.00-10, risk from there is seen for a retreat to take place later.
In view of this, would not chase this rise here and would be prudent to buy euro on pullback as 120.20-30 should limit downside. Only below 119.45-50 would abort and suggest top is formed instead, risk weakness to support at 118.92, break there would add credence to this view and suggest at least the first leg of 114.85 has ended, bring weakness to 118.40-50 first.
Our latest preferred count is that wave (ii) is ABC-X-ABC which ended at 123.33 and wave (iii) is unfolding with wave iii ended at 100.77, followed by wave iv at 111.57 and wave v as well as the wave (iii) has ended at 97.04, followed by wave (iv) at 111.43 and wave (v) has ended at 94.12 which is also the end of the larger degree v, this also implied the major wave (C) has also ended there, hence major correction has commenced from there with (A) leg unfolding in its lower degree wave c which has possibly ended at 145.69. Under this count, A-B-C wave (B) has commenced with A leg ended at 136.23, wave B at 143.79 and wave C has possibly ended at 149.79.
Our larger degree count is that the decline from 139.26 is wave (C) and is sub-divided into a diagonal triangle i-ii-iii-iv-v with wave i - 105.44, wave ii- 123.33, wave iii - 97.03, wave iv - 111.43, followed by the final wave v as well as the end of wave (C) at 94.12, this also mark the bottom of larger degree wave B. Under this count, major rise in wave C has commenced as an impulsive wave with minor wave III ended at 145.69, wave V is still in progress for further gain to 150.00. Having said that, this so-called wave V could well be the first leg of larger degree 5-waver wave C and this wave C should bring at least a retest of wave A top at 169.97 (July 2008).
GOLD Short-Term Bearish In A Bullish Mediumterm Trend, SILVER Continued Weakness, CRUDE OIL Consolidating Below 50.
GOLD Short-term bearish in a bullish mediumterm trend.
Gold keeps on weakening since the yellow metal has faded near the hourly resistance at 1295 (18/04/2017 high). Support can be located at 1261 (intraday low). The road is wideopen for further decline.
In the long-term, the technical structure suggests that there is a growing upside momentum. A break of 1392 (17/03/2014) is necessary ton confirm it, A major support can be found at 1045 (05/02/2010 low).
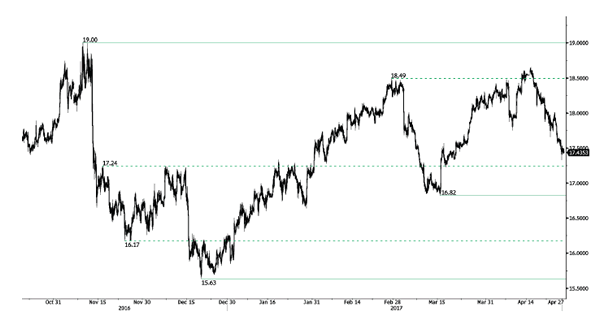
SILVER Continued weakness.
Silver has broken strong support at 18.16 (rising trendline) indicating further downside risk. Strong support is given far away at 16.82 (15/03/2017 low). Strong resistance is given at a distance at 19.00 (09/11/2017 high). Expected to see continued bearish pressures.
In the long-term, the death cross indicates that further downsides are very likely. Resistance is located at 25.11 (28/08/2013 high). Strong support can be found at 11.75 (20/04/2009).
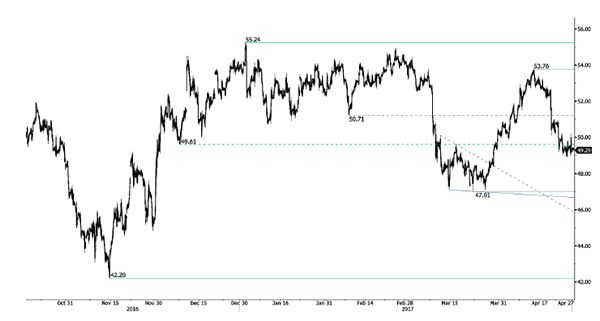
CRUDE OIL Consolidating below 50.
Crude oil has declined sharply, breaking the support at 50.71, yet now has paused. Support now lies at 48.87 (25/04/2017 low). Resistance for a short-term bounce can be found at 50.71 (old support) and 53.70 (12/04/2017 high).
In the long-term, crude oil has recovered after its sharp decline last year. However, we consider that further weakness are very likely. Strong support lies at 24.82 (13/11/2002) while resistance can now be found at 55.24 (03/01/2017 high).
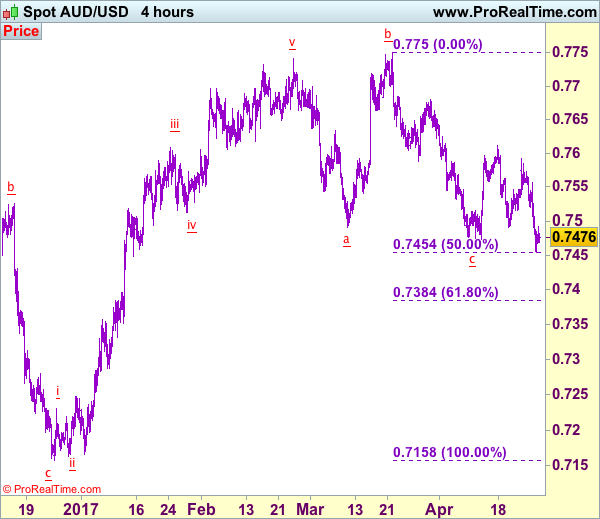
Trade Idea: AUD/USD – Stand aside
AUD/USD – 0.7476
Recent wave: Wave 5 ended at 1.1081 and major correction has commenced for fall to 0.7000 and then towards 0.6500-10
Trend: Near term down
New strategy :
Stand aside
Position: -
Target: -
Stop:-
As aussie has dropped again and broke below indicated previous support at 0.7473, adding credence to our bearish view that recent decline from 0.7750 has resumed and downside bias is seen for this move to extend weakness to 0.7450-55 (50% Fibonacci retracement of 0.7158-0.7750), then 0.7400-10 but reckon downside would be limited to 0.7380-85 (61.8% Fibonacci retracement) and 0.7350 should hold, risk from there is seen for a rebound later.
In view of this, would not chase this fall here and would be prudent to sell aussie on recovery as 0.7505-10 would limit upside. Only above resistance at 0.7556 would abort and suggest low is possibly formed, bring a stronger rebound to 0.7570-75 but break of resistance at 0.7592 is needed to provide confirmation.
On the 4-hour chart, the move from 0.8066 is the wave 5 with i: 0.8860, ii: 0.8315, wave iii is an extended move ended at 1.0183, iv: 0.9706 and wave v has ended at 1.1081 (also the top of entire wave 5). The subsequent selloff is the major correction which is unfolding as ABC-X-ABC and 2nd A leg has ended at 0.8848, followed by a-b-c wave B which ended at 0.9758, hence, 2nd C wave is now in progress and indicated downside target at 0.7000 and 0.6950 had been met, so further fall to 0.6710-20 cannot be ruled out.
ECB Decision, Data And Earnings Eyed
- ECB seen waiting for June meeting to announce any fresh changes to stimulus;
- Muted market response to Trump tax plans;
- Economic data and earnings eyed.
US equity markets are expected to open relatively unchanged on Thursday as investors eye the latest monetary policy decision from the ECB and respond to Donald Trump's tax reform plans, announced on Wednesday.
The ECB will announce its latest monetary policy decision shortly and is expected to leave everything unchanged, with the June meeting being seen as the most likely point at which the central bank will seriously consider a further removal of stimulus. While it's unlikely that another reduction in asset purchases or a rate hike will happen until the end of the year, the central bank may allude to such a move earlier but I think today's meeting is a little too soon.
Mario Draghi may have been keen to stress that the previous reduction is not tapering, but I think it's clear that the central bank has started a process of removing stimulus in much the same way that its US counterpart did. The only difference is that it's being less explicit with its plans and the process will be far more gradual. The problem that the ECB is facing is that core inflation is still well below its target of below but close to 2% and there still exists a two-tier eurozone with some countries in a far better position for monetary tightening and others still in need of substantial easing.
As far as today's meeting is concerned, very little is expected from the central bank. The meeting falls in between the first and second round of the French Presidential elections, with eurosceptic Marine Le Pen one of the two candidates set to battle it out for the Presidency on 7 May. While the central bank may want to avoid appearing to interfere in the election, it will be interesting to see whether the reference to downside risks is scaled back in order to avoid playing into Le Pen's hands, or whether they talk up the progress achieved this year and the improved prospects for the region.
There has been a relatively muted response to Trump's plans for tax reform that were announced on Wednesday, the prospect of which was one of the key drivers of the market rally that followed his election victory last November. With US equity markets near all-time highs and much of the details that were released already being known, it would appear everything was already priced in.
While it was interesting to see the plans being laid out, there are still a number of obstacles to overcome before the changes come into effect, which may explain the muted response. Investors may have also got a little carried away with the plans previously and the implementation of them could take longer than people were expecting which is taking a little bit of the shine off.
Still to come today we've got some US economic data being released as well as first quarter earnings reports from a number of companies including Amazon, Microsoft and Alphabet
DAX Flat Ahead Of ECB Rate Decision
The DAX posted considerable gains to start of the week, but the index has since been on pause. The trend continues in the Thursday session, as the DAX trades quietly at 12,437.50. Today’s highlight is the ECB policy meeting, with the markets expecting the benchmark rate to remain at 0.00%. On the release front, GfK German Consumer Climate climbed to 10.2, above the forecast of 9.9 points. Later in the day, Germany releases Preliminary CPI, with an estimate of -0.1%. Friday will be busy, with the release of German Retail Sales and Eurozone CPI Flash Estimate. Over in the US, we’ll get a look at Advance GDP.
ECB policymakers meet on Thursday for the monthly policy meeting. Although central bank meetings always attracts the attention of the markets, this could turn out to be a non-event, unless Mario Draghi makes some newsworthy comments in his press conference. The benchmark interest rate has been pegged at a flat 0.0% since March 2016, and no changes are expected. With the eurozone showing stronger inflation and growth numbers in the first quarter, there had been some pressure on the ECB to taper or shorten its asset-purchase program, which is scheduled to wind up in December. However, the ECB appears content to hold course, barring any significant change in growth or inflation numbers. There is also the political card to keep in mind, as the ECB does not want to be seen as intervening in the current French election, or when Germany holds elections in September.
It’s back to the ballot box for French voters on Sunday, in the second round of the presidential election. The markets have priced in a convincing victory by Emmanuel Macron over Marie Le Pen. Macron enjoys a comfortable margin of 60-40 in opinion polls, but round two of the campaign has not gone well for the front-runner. Macron was jeered by workers at a factory in his hometown of Amiens, only to have Le Pen show up unexpectedly, to the delight of the workers. A BFM TV poll showed that more voters feel that Le Pen’s campaign has been more successful in the second round than that of Macron. This may not change the expected outcome of a Macron win, but a strong showing by Le Pen on Sunday would show that her strident anti-EU stance has wide popularity, and this could sour investor sentiment and send the stock markets to lower ground.
President Trump announced his long-awaited tax plan on Wednesday. The proposal calls for sharp reductions for both individuals and corporations. The plans calls three tax brackets for individuals – 10%, 25% and 35%. The corporate sector would also see significant tax relief, with the corporate tax rate dropping from 35% to 15%, and the tax on multinationals’ overseas profits lowered from 35% to 10%. However, any tax reform proposals from the White House will require a stamp of approval from Congress, so Trump’s proposal should be viewed as a blueprint that is a long way off from becoming law. Trump’s proposal was short on details, although government officials are praising it as one of the largest tax cuts and broadest overhauls of the tax system in history. There hasn’t been much reaction from the euro, which has been subdued in Thursday trading.
Euro Unchanged Ahead Of ECB Rate Decision
The euro is unchanged in the Thursday session, as EUR/USD hugs the 1.09 level. The lack of movement could change during the day, as there is a host of indicators in the eurozone and the US. Germany will release Preliminary CPI, with an estimate of -0.1%. The ECB will announce its benchmark rate, which is expected to remain at a flat 0.0%. In the US, it's a busy day, with three key events – Core Durable Goods Orders, unemployment claims and Pending Home Sales. On Friday, we'll get a look at German Retail Sales and Eurozone CPI Flash Estimate. The US will release Advance GDP and Preliminary UoM Consumer Sentiment.
The ECB will meet for its monthly rate meeting on Thursday. Although central bank meetings always attracts the attention of the markets, this could turn out to be a non-event, unless Mario Draghi makes some waves in his press conference. The benchmark interest rate has been pegged at a flat 0.0% since March 2016, and no changes are expected. With the eurozone showing stronger inflation and growth numbers in the first quarter, there has been speculation that the ECB might taper its asset-purchase program, which runs until December, ahead of schedule. However, the ECB appears content to hold course, barring any significant change in growth or inflation numbers. There is also the political card to keep in mind, as the ECB does not want to be seen as intervening in the current French election, or when Germany holds elections in September.
The second round of the French election is only days away, and the markets have priced in a convincing victory by Emmanuel Macron over Marie Le Pen. Macron enjoys a comfortable margin of 60-40 in opinion polls, but round two of the campaign has not gone well for the front-runner. Macron was jeered by workers at a factory in his hometown of Amiens, only to have Le Pen show up unexpectedly, to the delight of the workers. A BFM TV poll showed that more voters feel that Le Pen's campaign has been more successful in the second round than that of Macron. This may not change the expected outcome, but a strong showing by Le Pen on Sunday would show that her strident anti-EU stance has wide popularity, and this could sour investor sentiment and hurt the euro.
President Trump announced his tax plan on Wednesday. The proposal calls for sharp reductions for both individuals and corporations. There would be three rates for individuals – 10%, 25% and 35%. The corporate sector would also see significant tax relief, with the corporate tax rate dropping from 35% to 15%, and the tax on multinationals' overseas profits lowered from 35% to 10%. However, any tax reform proposals from the White House will require a stamp of approval from Congress, so Trump's proposal should be viewed as a blueprint that is a long way off from becoming law. Trump's proposal was short on details, although government officials are praising it as one of the largest tax cuts and broadest overhauls of the tax system in history. There hasn't been much reaction from the euro, which has been subdued in Thursday trading.
US consumer confidence levels remain high, but there was some disappointment as CB Consumer Confidence dropped to 120.3 in April, missing the estimate of 123.7. The softer than expected reading boosted the euro in the Tuesday session. What is troubling analysts is that strong consumer confidence numbers have not translated into increased consumer spending, a key component of economic growth. This trend has been labeled the “hard/soft discrepancy” (confidence being ‘soft', while actual spending being ‘hard'). This was underscored in March retail sales numbers, which came in at a flat 0.0%, shy of the forecast. Next up is Advance GDP on Friday, which is expected at 1.3 percent. An unexpected GDP reading could have a sharp impact on EUR/USD.