
Sample Category Title
Bitcoin’s Reluctance Puts Pressure on Altcoins
Market Picture
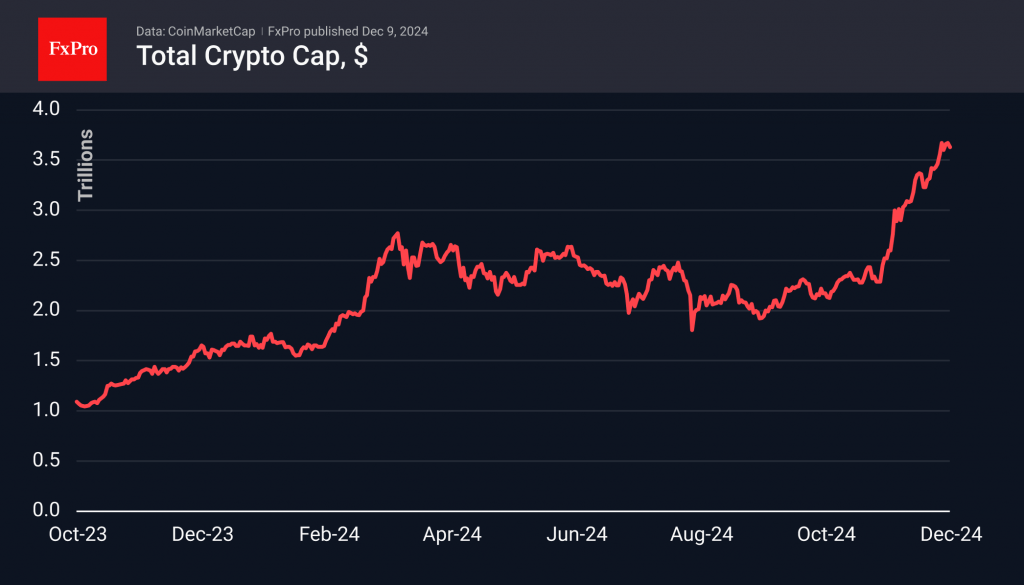
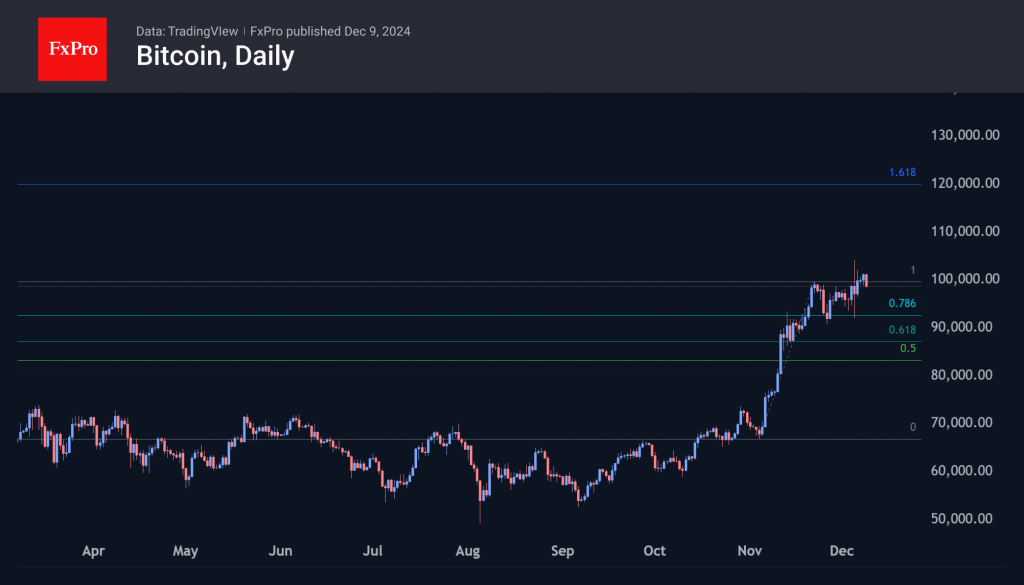
The cryptocurrency market corrected 1.2% in 24 hours, but the 5% gain for the week still indicates a strong bull market despite more frequent mini-corrections. Bitcoin is failing to consolidate above $100K, which is likely suppressing buying in the overall cryptocurrency market.
Bitcoin is trading just below $99K with minimal overnight movement. Its inability to grow has negatively impacted altcoins. We view Bitcoin’s lull as an important position correction that will help the market shake off short-term overbought conditions and move more reliably higher. The next upside momentum could take the price to the $120K area, working off the Fibonacci extension.
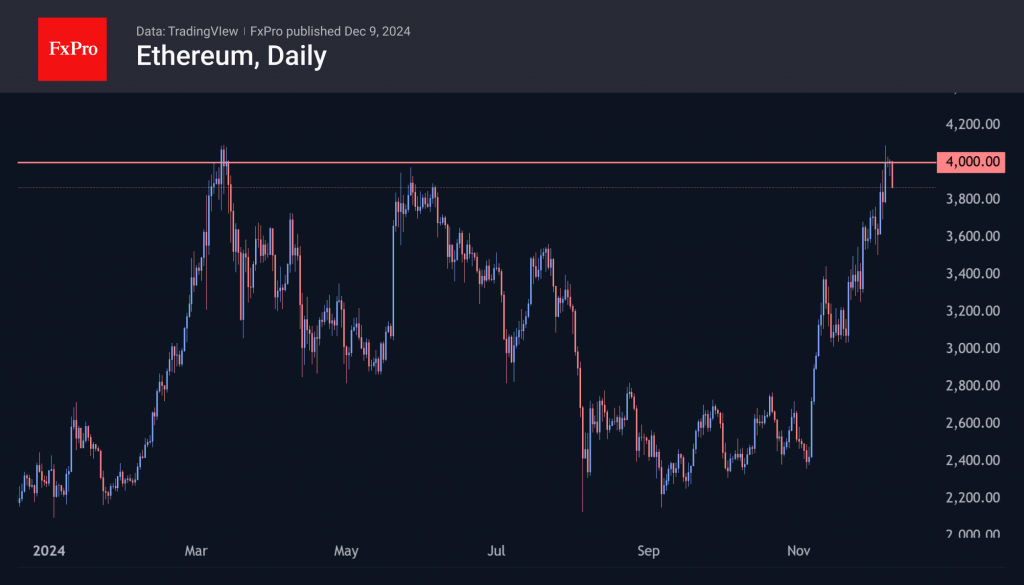
Ethereum loses 2%, also failing to consolidate above $4000 and falling just a few dollars short of updating the year’s highs. The coin doesn’t see meaningful support until the $3700-3800 area.
News Background
According to SoSoValue, net inflows into spot bitcoin ETFs in the U.S. totalled $2.73 billion last week, following outflows of $138.1 million the previous week. Cumulative inflows since bitcoin ETFs were approved in January rose to $33.43 billion.
Net inflows into the Ethereum ETF rose to a record $836.7 million last week after inflows of $446.5 million the previous week. Cumulative net inflows since the ETF’s launch in July rose 2.5 times to $1.41 billion for the week.
BlackRock and MARA Holdings bought 7,750 BTC and 1,423 BTC, respectively, as the former cryptocurrency’s price fell to $90,500.
Former US Treasury Secretary Lawrence Summers called Trump’s plan to create a strategic reserve in bitcoins “insane.” In his view, the only reason for such a move is “to coddle generous campaign donors.”
The SEC has notified at least two of the five issuers of spot Solana ETFs that it will reject their Forms 19b-4. The commission plans to consider new cryptocurrency ETFs once the agency’s leadership changes.
AUD/USD at a Critical Support Level
The AUD/USD chart reveals that since late October, the pair has been in a downtrend. This is largely driven by monetary policy differences: while the Federal Reserve has begun cutting interest rates, the Reserve Bank of Australia (RBA) has yet to initiate rate reductions.
Tomorrow, the RBA will announce its decision on interest rates. All 44 economists surveyed by Reuters expect the rate to remain at 4.35%, given persistently high core inflation (3.5%) and low unemployment.
Previously, experts forecasted rate cuts in the first quarter of 2025. However, most now anticipate reductions no earlier than the second quarter, as the RBA focuses on bringing inflation back to its 2–3% target range.
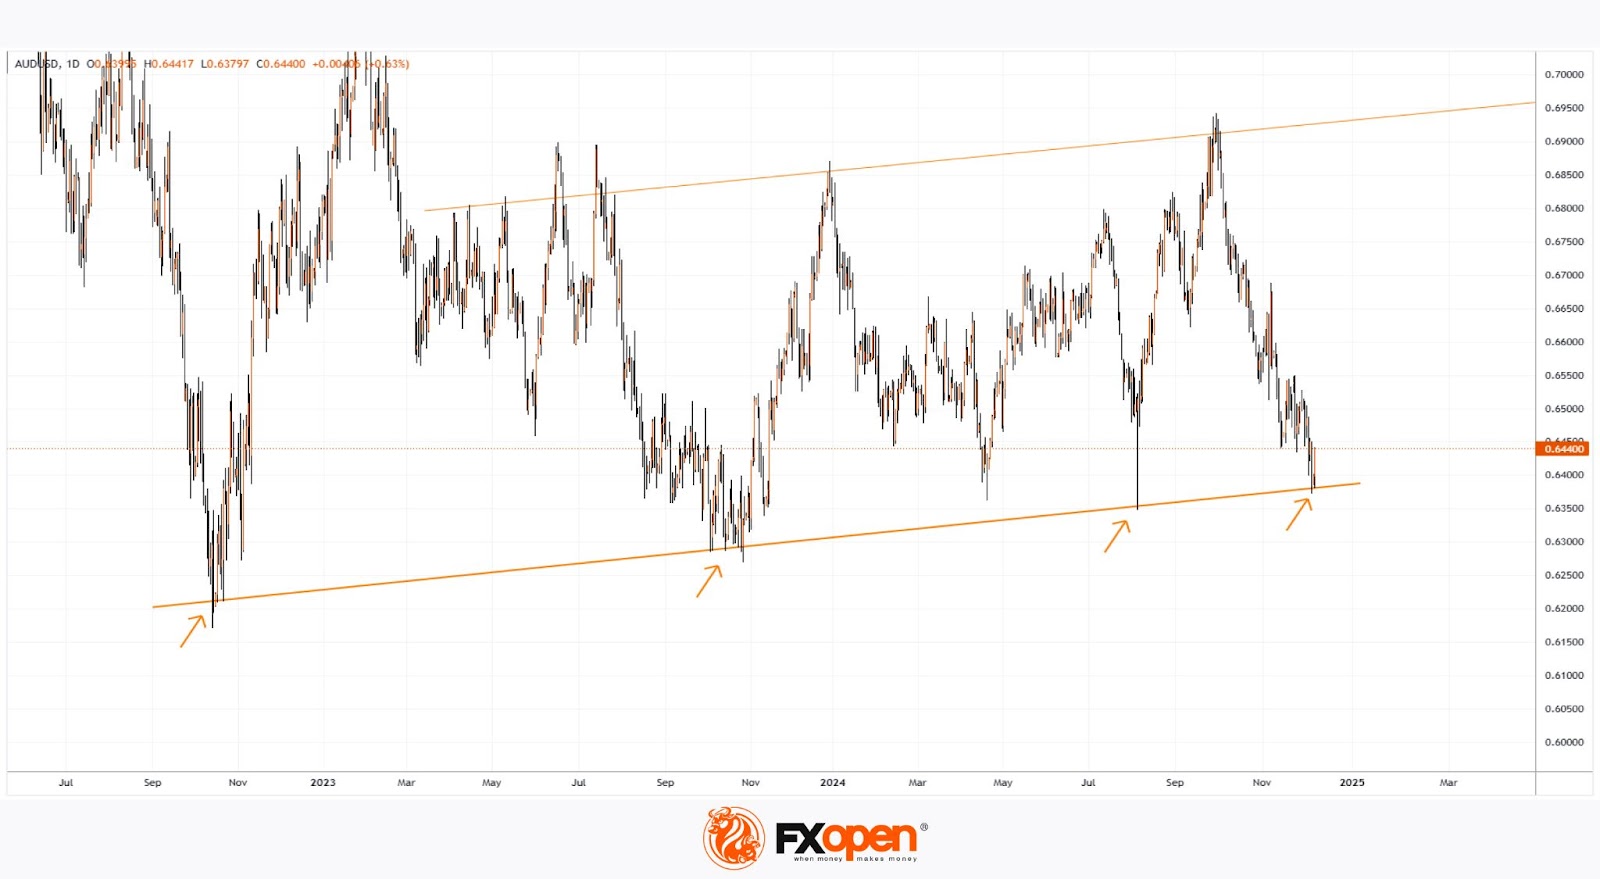
Meanwhile, the AUD/USD chart highlights that the price is sitting at a key support level (marked by a red line), which has already reversed the pair upward three times since the latter half of 2022 (indicated with arrows).
Tomorrow's crucial RBA decision is likely to strongly influence whether this support will manage to reverse the price upward for the fourth time. Monday's robust price action suggests that another upward reversal is possible.
Trade over 50 forex markets 24 hours a day with FXOpen. Take advantage of low commissions, deep liquidity, and spreads from 0.0 pips. Open your FXOpen account now or learn more about trading forex with FXOpen.
This article represents the opinion of the Companies operating under the FXOpen brand only. It is not to be construed as an offer, solicitation, or recommendation with respect to products and services provided by the Companies operating under the FXOpen brand, nor is it to be considered financial advice.
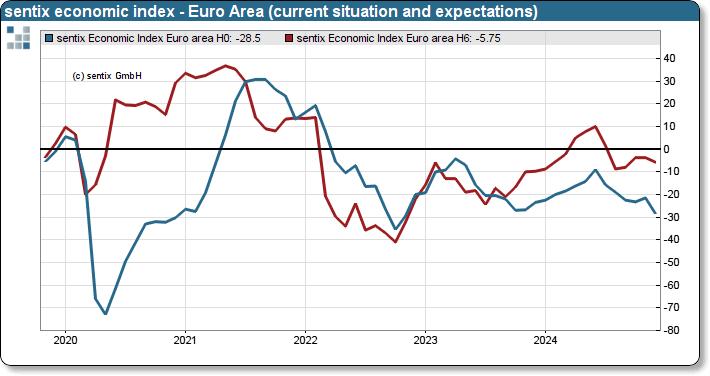
Eurozone Sentix plunges to -17.5 amid economic and political turmoil
Investor sentiment in the Eurozone deteriorated sharply in December, with the Sentix Investor Confidence Index dropping to -17.5 from -12.8, significantly below expectations of -13.1. This marks the weakest reading since November 2023. Current Situation Index fell to -28.5, the lowest since November 2022, while Expectations Index slipped to -5.8 from -3.8. .
Germany remains a key drag, with its Current Situation Index sinking to -50.8, the lowest since June 2020, reflecting the persistence of recessionary pressures. The announcement of new Bundestag elections failed to inspire optimism, while France's ongoing government crisis has added another layer of economic uncertainty. Sentix highlighted that “the two largest countries in the Eurozone are dragging down the EU economy.”
ECB faces increasing pressure as investors expect stronger monetary support for the faltering economy. However, inflation concerns persist, with Sentix's inflation barometer holding at -12 points, signaling continued unease. This dual challenge highlights a conflict for ECB as it balances the need for economic stimulus with inflationary risks.
Gold Consolidates While WTI Crude Oil Faces Continued Struggles
Gold price is consolidating above the $2,600 support zone. Crude oil is showing bearish signs and might decline below $66.80.
Important Takeaways for Gold and Oil Prices Analysis Today
- Gold price started a recovery wave from the $2,610 zone against the US Dollar.
- A key bearish trend line is forming with resistance at $2,650 on the hourly chart of gold at FXOpen.
- Crude oil prices failed to clear the $70.00 region and started a fresh decline.
- There is a connecting bearish trend line forming with resistance at $67.50 on the hourly chart of XTI/USD at FXOpen.
Gold Price Technical Analysis
On the hourly chart of Gold at FXOpen, the price found support near the $2,610 zone. The price remained in a bullish zone and started a recovery wave above $2,620.
There was a decent move above the 50-hour simple moving average and $2,635. The bulls pushed the price above the $2,640 zone. Finally, the price climbed as high as $2,650 before the bears appeared. The price is now consolidating below $2,650.
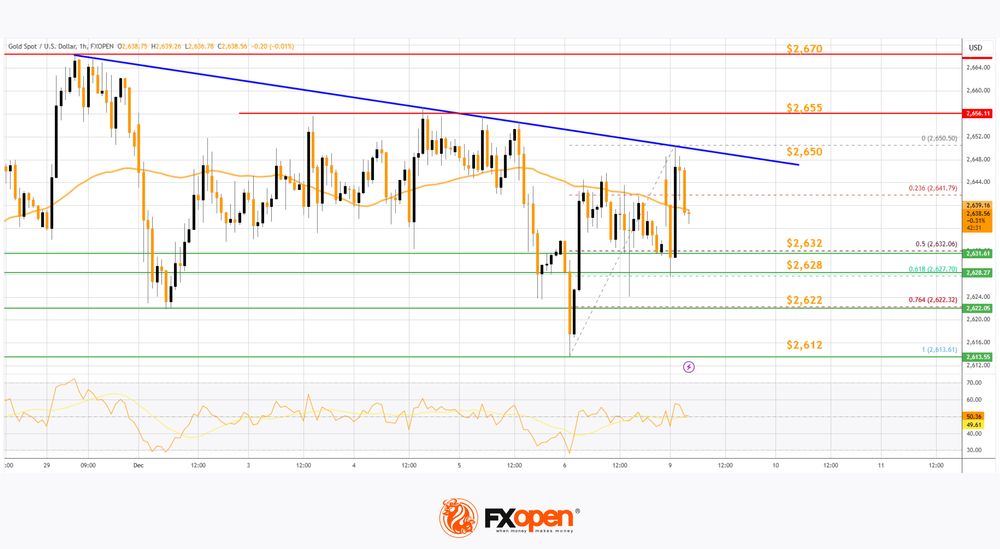
There was a move below the 23.6% Fib retracement level of the upward move from the $2,613 swing low to the $2,650 high, and the RSI is stable above 50.
Initial support on the downside is near $2,632. The first major support is near the $2,628 zone. It is near the 61.8% Fib retracement level of the upward move from the $2,613 swing low to the $2,650 high. If there is a downside break below the $2,628 support, the price might decline further.
In the stated case, the price might drop toward $2,612. Any more losses might push the price toward the $2,600 level. Immediate resistance is near the $2,650 level.
There is also a key bearish trend line forming with resistance at $2,650. The next major resistance is near the $2,655 level. An upside break above the $2,655 resistance could send Gold price toward $2,670. Any more gains may perhaps set the pace for an increase toward the $2,685 level.
Oil Price Technical Analysis
On the hourly chart of WTI Crude Oil at FXOpen, the price struggled to clear the $70.00 resistance zone against the US Dollar. The price started a fresh decline below the $68.80 support.
The price even dipped below the $67.80 level and the 50-hour simple moving average. The bulls are now active near the $66.80 level. A low was formed at $66.78 and the price is now consolidating losses. If there is a fresh increase, it could face resistance near the 23.6% Fib retracement level of the downward move from the $70.10 swing high to the $66.78 low.
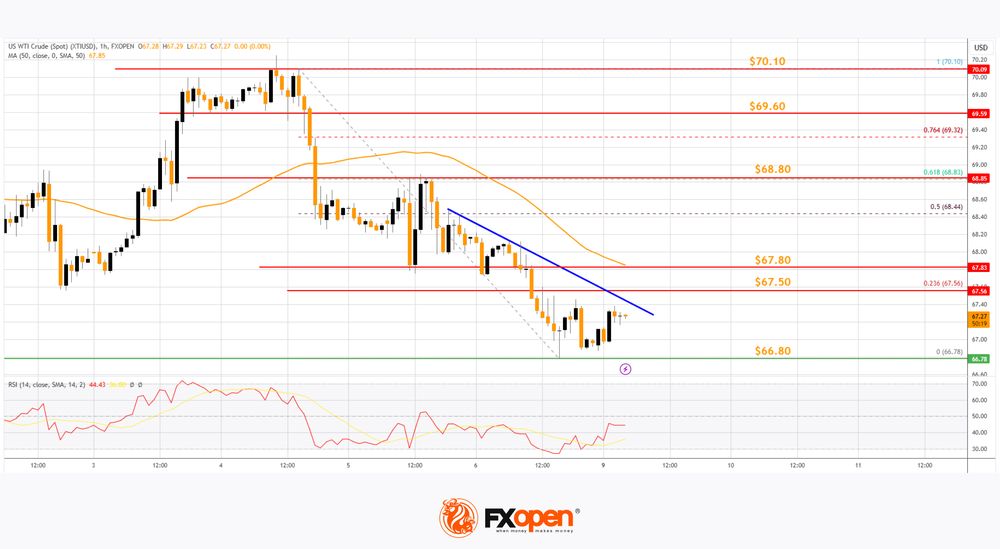
There is also a connecting bearish trend line forming with resistance at $67.50. The first major resistance is near the $67.80 level, above which the price could rise and test the 61.8% Fib retracement level of the downward move from the $70.10 swing high to the $66.78 low at $68.80.
Any more gains might send the price toward the $69.60 level. Conversely, the price might continue to move down and revisit the $66.80 support. The next major support on the WTI crude oil chart is $66.00.
If there is a downside break, the price might decline toward $63.50. Any more losses may perhaps open the doors for a move toward the $61.20 support zone.
Start trading commodity CFDs with tight spreads. Open your trading account now or learn more about trading commodity CFDs with FXOpen.
This article represents the opinion of the Companies operating under the FXOpen brand only. It is not to be construed as an offer, solicitation, or recommendation with respect to products and services provided by the Companies operating under the FXOpen brand, nor is it to be considered financial advice.
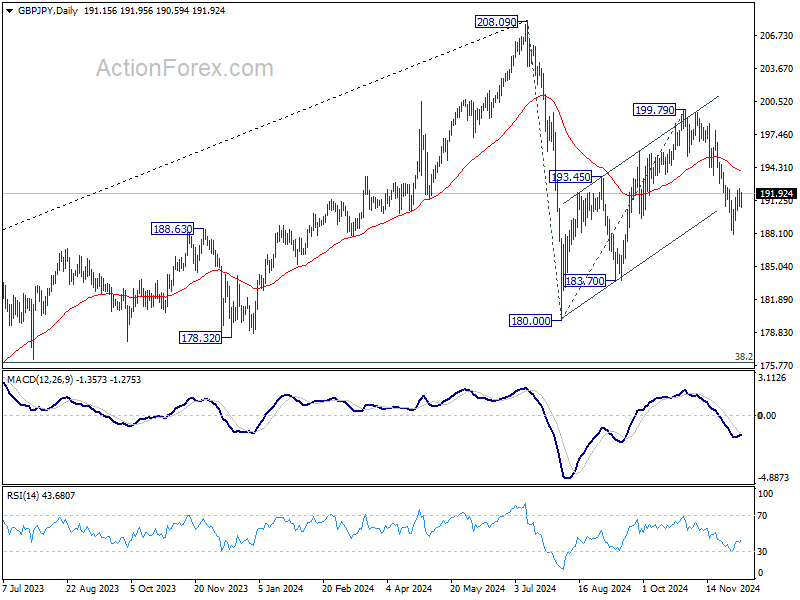
GBP/JPY Daily Outlook
Daily Pivots: (S1) 190.36; (P) 191.42; (R1) 192.12; More...
Intraday bias in GBP/JPY remains neutral at this point. Recovery from 188.07 might extend higher. But outlook will stay bearish as long as 55 D EMA (now at 193.97) holds. On the downside, below 190.33 minor support will bring retest of 188.07 first. Break there will target 183.70 support next.
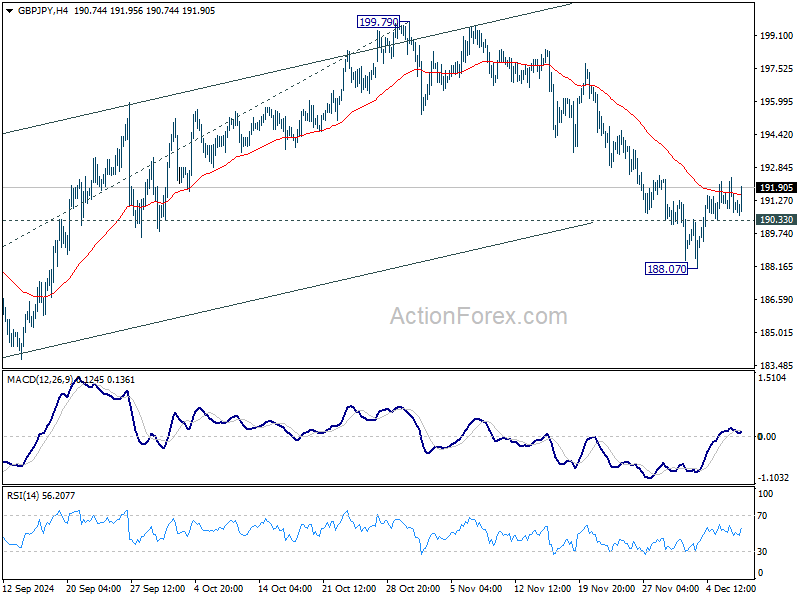
In the bigger picture, price actions from 208.09 are seen as a correction to whole rally from 123.94 (2020 low). The range of consolidation should be set between 38.2% retracement of 123.94 to 208.09 at 175.94 and 208.09. However, decisive break of 175.94 will argue that deeper correction is underway.
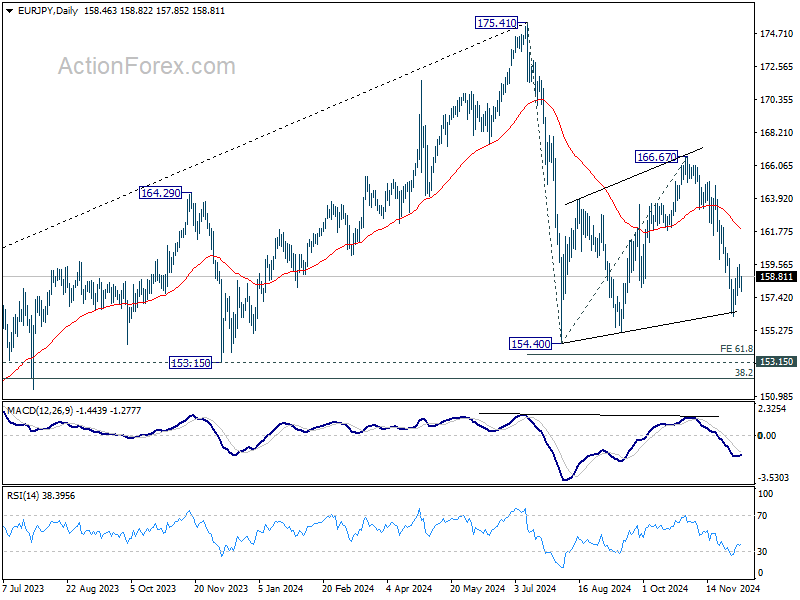
EUR/JPY Daily Outlook
Daily Pivots: (S1) 157.92; (P) 158.75; (R1) 159.40; More...
Intraday bias in EUR/JPY stays neutral for the moment. While recovery from 156.16 could extend higher, outlook will stay bearish as long as 55 D EMA (now at 161.87) holds. On the downside, below 157.54 minor support will bring retest of 156.16 first. Break there will target 154.40 low next.
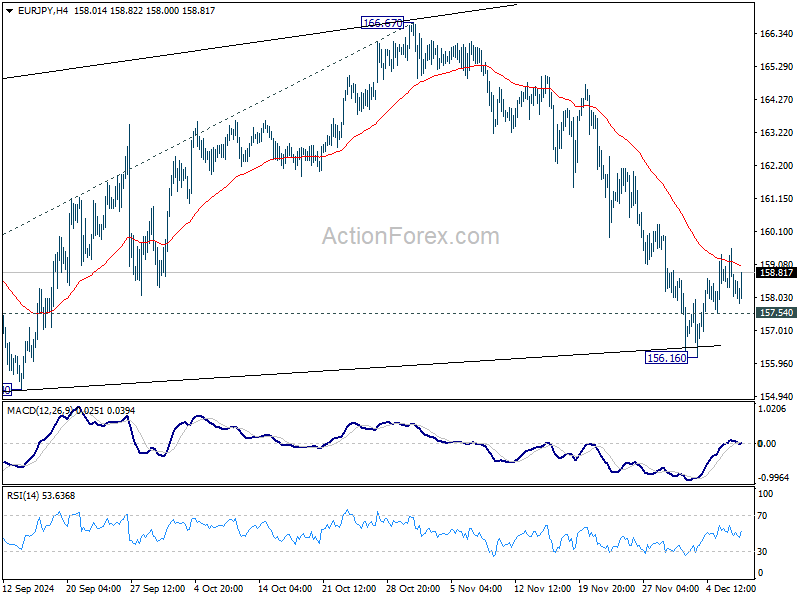
In the bigger picture, price actions from 175.41 are seen as correction to rally from 114.42 (2020 low). The range of consolidation should have been set between 38.2% retracement of 114.42 to 175.41 at 152.11 and 175.41 high. However, decisive break of 152.11 would argue that deeper correction is underway.
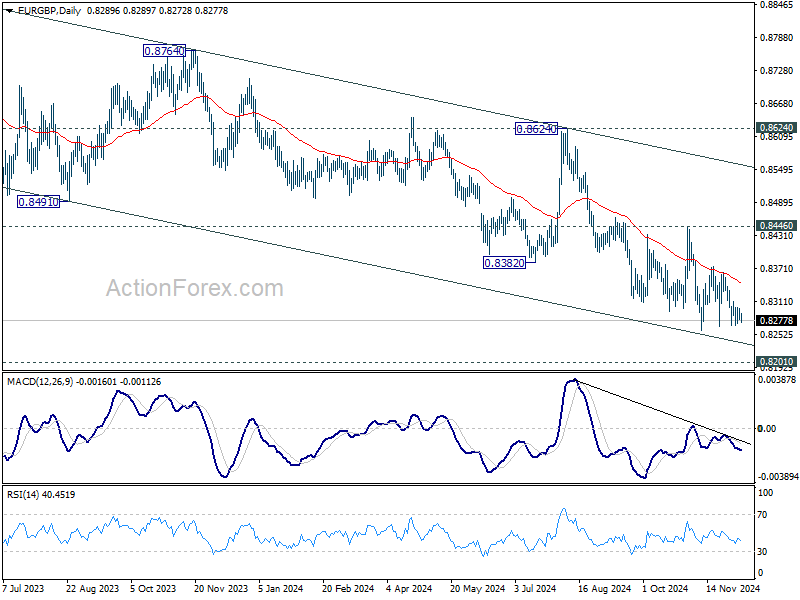
EUR/GBP Daily Outlook
Daily Pivots: (S1) 0.8282; (P) 0.8291; (R1) 0.8304; More...
Intraday bias in EUR/GBP remains neutral and more consolidations could be seen above 0.8259 support. On the downside, decisive break of 0.8259 will resume larger down trend to 0.8201 key support. On the upside, break of 0.8311 minor resistance will turn bias back to the upside for recovery. But still, outlook will stay bearish as long a 0.8446 resistance holds, and downside breakout is expected at a later stage.
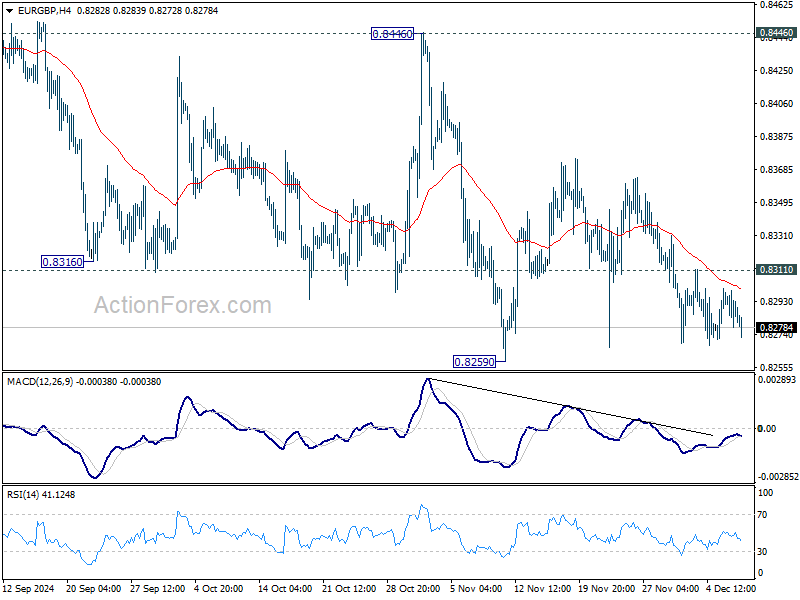
In the bigger picture, down trend from 0.9267 (2022 high) is in progress. Next target is 0.8201 (2022 low), but strong support should be seen there to bring rebound. However, outlook will remain bearish as long as 0.8624 resistance holds even in case of strong rebound. Decisive break of 0.8201 will indicate long term bearish reversal.
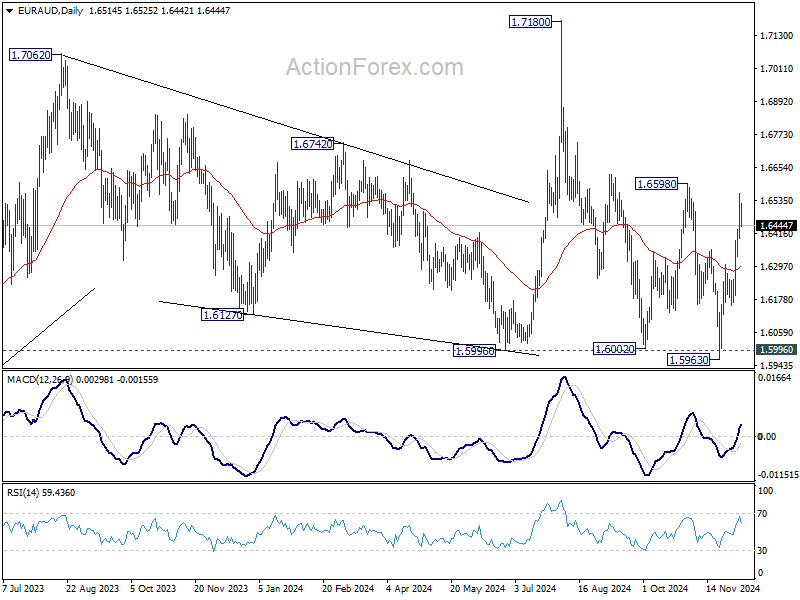
EUR/AUD Daily Outlook
Daily Pivots: (S1) 1.6433; (P) 1.6498; (R1) 1.6603; More...
Intraday bias in EUR/AUD is turned neutral first with current retreat. Some consolidations would be seen below 1.6559. But further rally is expected as long as 1.6305 resistance turned support holds. Above 1.6559 will resume the rise from 1.5963 to 1.6598 key resistance. Decisive break there will confirm that whole fall from 1.7180 has complete with three waves down to 1.5963, and target a test on 1.7180 next.
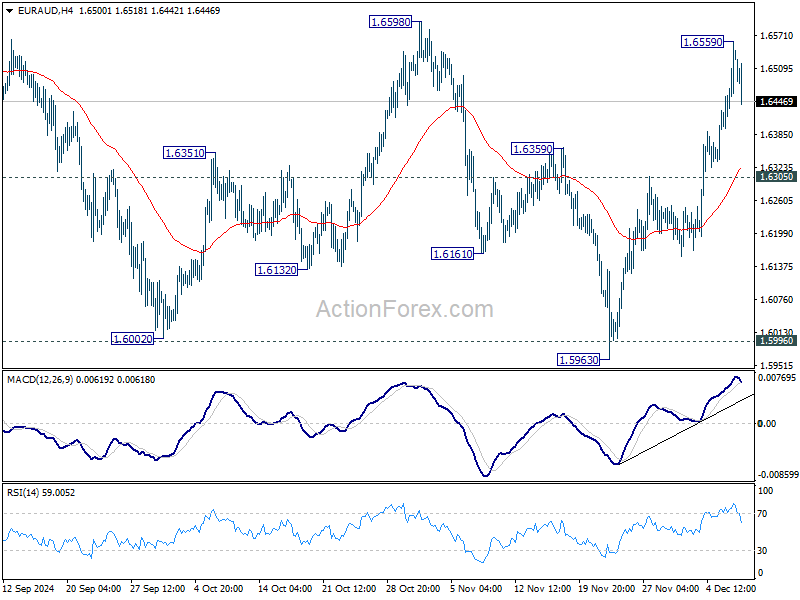
In the bigger picture, EUR/AUD is still holding on to 1.5996 key support despite brief breach. Larger up trend from 1.4281 (2022 low) is still in favor to resume through 1.7180 at a later stage. Nevertheless, sustained break of 1.5995 will indicate that such up trend has completed. Deeper decline would be seen to 61.8% retracement of 1.4281 to 1.7180 at 1.5388, even as a correction.
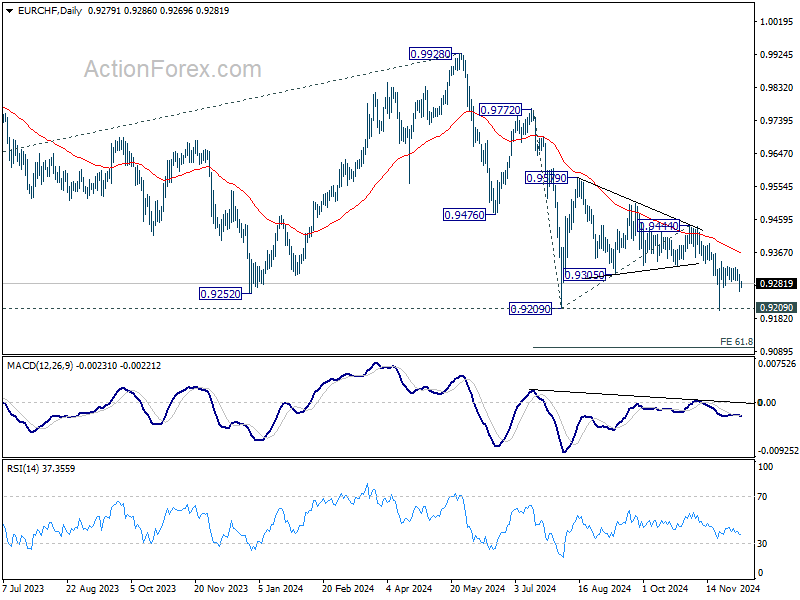
EUR/CHF Daily Outlook
Daily Pivots: (S1) 0.9259; (P) 0.9289; (R1) 0.9317; More....
Intraday bias in EUR/CHF stays mildly on the downside at this point. Recovery fro 0.9204 could have completed after repeated rejection by falling 55 4H EMA. Deeper fall would be seen to retest 0.9204 low. Firm break of 0.9204/9 will indicate larger down trend resumption. Nevertheless, break of 0.9321 resistance will turn bias back to the upside to resume the rebound from 0.9204 instead, and that would be an early sign of bullish reversal for the near term.
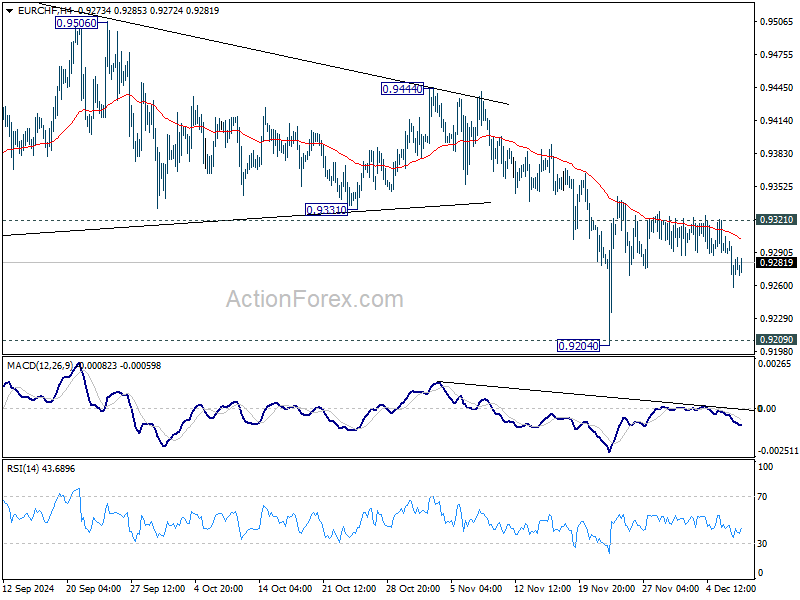
In the bigger picture, outlook will now stay bearish as long as 0.9444 resistance holds. Decisive break of 0.9209 low will resume long term down trend to 61.8% projection of 0.9772 to 0.9209 from 0.9444 at 0.9096 next.
US Treasuries’ Outperformance vs German Bunds Didn’t Help EUR/USD
Markets
US November payrolls cemented the case for a 25 bps rate cut by the Fed. That scenario wasn’t completely discounted (70%) ahead of the numbers. While headline payrolls growth rebounded to 227k (with an additional 56k upward revision to September & October figures), the accompanying household survey made a more grim reading. With a 193k decline in the workforce, a 355k decline in employment, a rise in the unemployment rate from 4.1% to 4.2% and a decline in the participation rate from 62.6% to 62.5%. US Treasuries spiked lower on the headline number, but rapidly looked higher. The move topped out after the release of December University of Michigan consumer confidence. A fifth consecutive increase brings the index at 74 (best since April) with details showing short term inflation expectations (1y) rising from 2.6% to 2.9% and ending the decline from 3.3% in May. Longer-term inflation expectations were broadly stable (3.1% from 3.2%). Fed governor Bowman, who dissented at the September meeting in favour of a smaller 25 bps rate cut, reiterated that she wants to proceed cautiously and gradually in lowering the policy rate as underlying inflation remains uncomfortably above the 2% target. She thinks that the neutral rate moved higher with the current policy rate not being restrictive. The US yield curve eventually bull steepened with yields losing up to 4 bps at the front end of the curve. The US Treasuries’ outperformance vs German Bunds (yields up to 2 bps lower) didn’t help EUR/USD. A brief uptick above 1.06 was rapidly undone with the pair closing at 1.0568. After market close, rating agency Fitch raised the outlook on the Hungarian BBB rating from negative to stable. They cite an easing of policy uncertainty, prudent monetary easing, a moderation of inflation, the balanced primary fiscal position, an improvement in the current account and a projected fall in debt as key reasons. At EUR/HUF 413.50, the forint remains weak.
The fall of Syrian president al-Assad’s government is omnipresent this morning. If any, it triggers some minor safe haven flows at the start of the trading week given uncertainty over how the power vacuum will be solved and what it will mean for the wider region. Both the dollar and US Treasuries eke out small gains. Today’s eco calendar is empty, suggesting that risk sentiment will continue dominating broader markets. The agenda turns more interesting later this week with US CPI numbers (Wednesday) and central bank meetings in Australia (tomorrow), Canada (Wednesday), Switzerland and EMU (both Thursday).
News & Views
Chinese consumer inflation unexpectedly eased from 0.3% to 0.2% y/y in November. Slowing food prices were among the key forces weighing down on the numbers. The 0.9% m/m increase came after a +/- 2% jump over the past few months which reflected the impact of heavy rain in the summer on food production. Core inflation picked up for a second month straight, be it to a very low 0.3% y/y still. Producer prices eased 2.5%, extending the deflation streak in place since October 2022. It was, however, a smaller drop than in October (-2.9%) and than expected (-2.8%). The inflation numbers suggest the range of stimulus measures have yet to show a significant impact on the economy. They raise the stakes for Wednesday’s Central Economic Work Conference. The meeting behind closed doors will be to discuss next year’s growth target, probably the same as 2024’s (+/- 5%) and additional stimulus measures to get it done. China’s yuan loses marginal ground this morning towards USD/CNY 7.28.
Rating agency Fitch said that the French government collapse threatens the country’s necessary fiscal consolidation efforts. It said the recently ousted Barnier’s 5% target for next year is now “very unlikely”. The developments also put serious question marks to France’s medium-term plan to reduce the deficit over an EC-approved 7-year term. Fitch now expects fiscal gaps above 5% to lead to a steep rise in government debt towards 118.5% of GDP by 2028, adding that the lack of a “credible medium-term fiscal consolidation plan that would lead to a stabilization of debt in the medium term is one of the main downgrade sensitivities for France’s ratings.” The rating agency recently lowered France’s growth forecasts from 1.2% to 0.9% and noted that slowing growth could hamper the fiscal tightening. While France faces no serious financing challenges, Fitch says, the political crisis has raised its borrowing costs. If permanently, these will further compound the challenges.