Sample Category Title
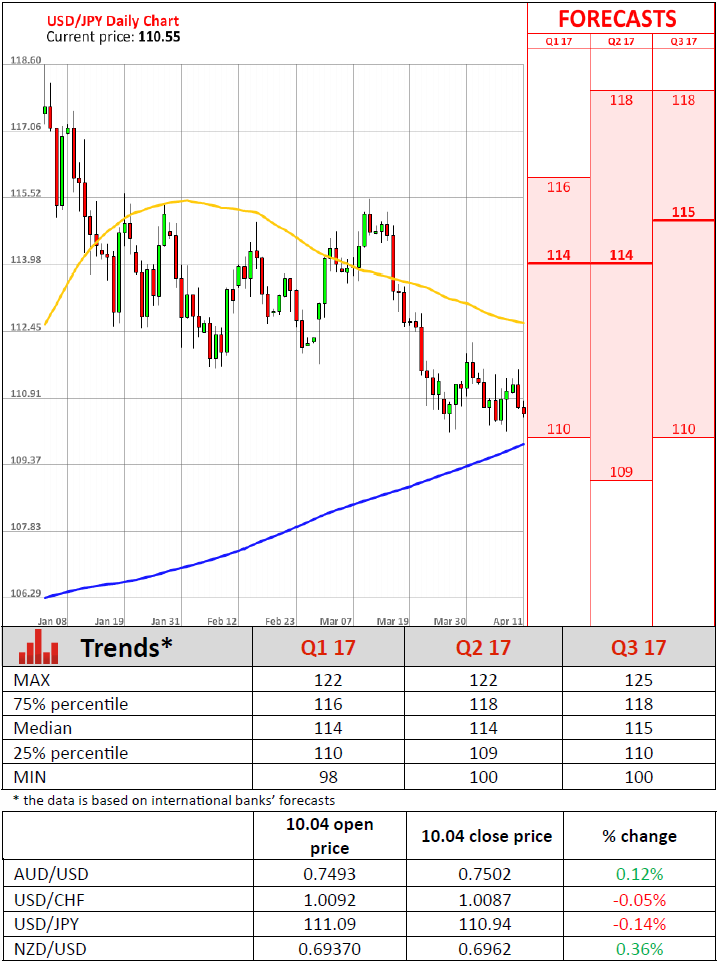
Daily Technical Analysis: USD/JPY Continuously Testing 110 Support And 112 Resistance
Currency pair USD/JPY
The USD/JPY is probably continuing with an ABC zigzag (brown) towards the 50% Fibonacci support level of wave 4 vs 3 (purple). Currently price action is building a sideways zone, which is indicated by the trend lines: support (green) at 110 and resistance (orange) at 112.
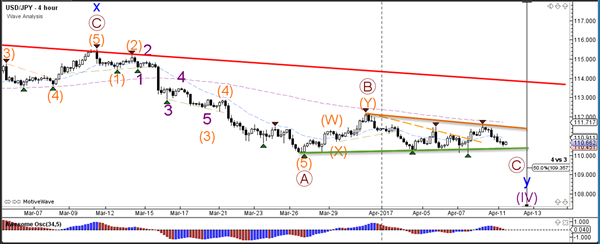
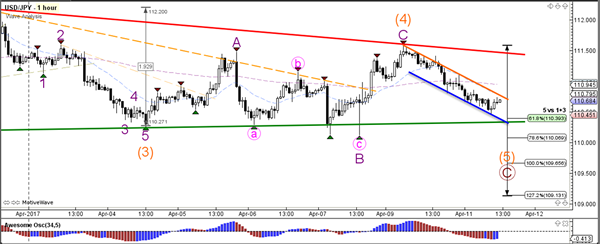
The USD/JPY is in a neat downtrend channel (orange/blue) that is testing a larger support (green) trend line. A break of that support zone could see price move lower towards the Fib targets whereas a break above resistance (orange/red) could indicate that wave 5 (orange) has been completed.
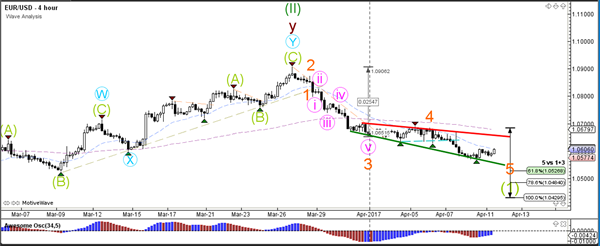
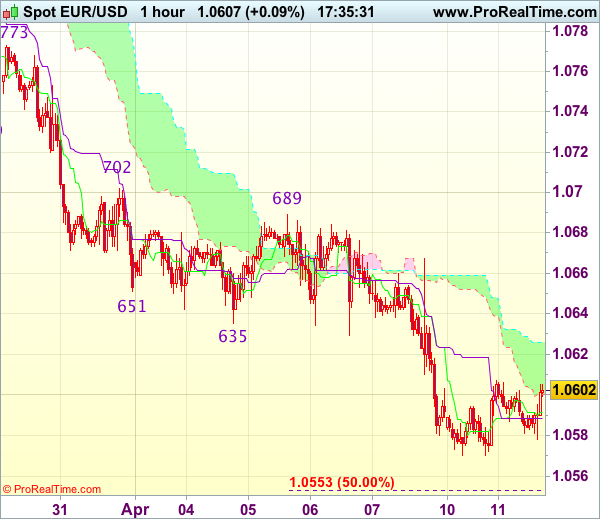
Currency pair EUR/USD
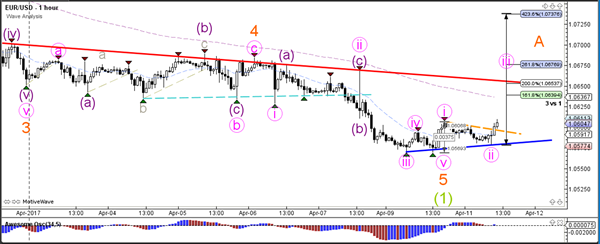
The EUR/USD could have completed the 5th wave (orange) within wave 1 (green) when considering the strong bullish 4 hour candle. A break below the 1.0570 bottom could see price continue towards the Fibonacci targets of wave 5 (orange).
The EUR/USD 1 hourly chart is confirming the potential bullish reversal. Price seems to have completed 5 waves (pink) and has broken above resistance (dotted orange). Price could now be building a wave 1 – 2 (pink).
Currency pair GBP/USD
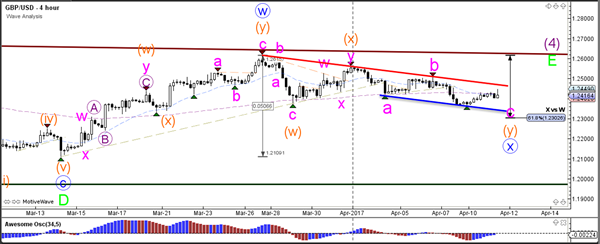
The GBP/USD could have completed an ABC (pink) zigzag correction within wave Y (orange) of wave X (blue). A bullish bounce could sent the pair higher to test resistance of the wave E (green) triangle.
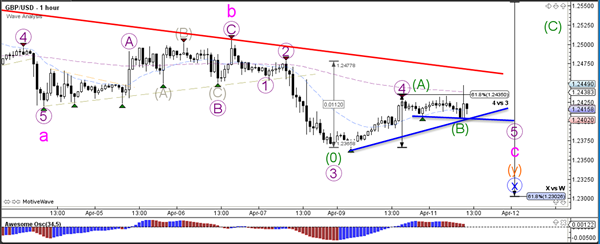
The GBP/USD is probably building an ABC zigzag (green) but technically it could still be a wave 4 (purple) too, as long as price stays below the 61.8% Fibonacci level of wave 4 vs 3 (purple).
Asia Stocks Slip Slide Away
Another subdued trading day in Asia sees regional indices slide slightly into the red on geopolitical concerns.
Geopolitical is certainly the new buzzword flying around the markets at the moment, as the fall-out from last week's Syria tough love shown by the U.S. continues to reverberate. It is really what they didn't say that continues to weigh on Asian bourses. With the U.S. Navy parked up of the Korean peninsula, and China apparently mobilising 150,000 troops towards the North Korea border to manage potential refugee flows, the Korean Won and the region's major indices slipped into the red and stayed there.
However, throw into the mix the French elections becoming a four-way race after the latest polls, and the danger of more conflagrations in the Middle-East interrupting supplies to energy-hungry Asia, then I guess it's no surprise the path of least resistance was down. With so many moving parts in the world stage, we can expect to hear geopolitics and risk aversion for the near future. Did I mention the G-7 is meeting today to discuss more sanctions on Russia?
Australia
Taking a look at the region's main boards, the one ray of light was the Australian ASX 200. The surge in oil and in mining stocks helping it to a small (0.3%) up day. The lucky country has been buoyed by the rally in commodities in recent times and is closing just shy of its two-year high at 5950 set a few days ago
Japan
The Nikkei spent most of the day under pressure. A resurgent Yen on those safe-haven flows I mentioned and the impending release of Toshiba's 3rd quarter results this afternoon (finally) weighed on the Nikkei. the Nikkei closes just above the four-month low at 18590, down 0.6% on the day.
Hong Kong
The Hang Seng also suffered. Firstly on the China troop movements mentioned above, and also as the PBOC continues to keep liquidity tight in the offshore CNH. This flowed through to the HKD forward market pushing funding rates up. The Hang Seng fell 0.9% on the day but in the bigger picture remains in an uptrend. Closing at 14060 and not too far away from the 18-month high of a few weeks ago at 24060.
China A50
The China A50 composite index also fell as Mr.Trump's none too subtle shot across the bows of President Xi continues to reverberate regarding trade issues. The PBOC's tighter onshore funding isn't helping either. The A50 continues to make heavy work of any move up to the 10550 regions with support below at 10305, the 100-day moving average. Political worries will continue with the index flat on the day after initially falling.
Market Update – European Session: UK Mar CPI Remains Above BOE Target For The 2nd Straight Month
Notes/Observations
Continental European inflation data moving off recent 4-year highs (Hungary, Sweden miss expectations) adding support to policy makers' calls to maintain loose monetary conditions
UK Mar CPI inflation remained above BOE target for 2nd straight month (2.3% v 2.3%e)
Overnight:
Asia:
BOJ Gov Kuroda express confidence that BOJ would be able to manage its exit smoothly from its monetary policy easing cycle including reducing the size of its balance sheet.
PBoC skipped its open market operations for 12th straight session citing liquidity remained relatively high level
Europe:
UK MAR BRC LFL SALES VALUE registered its biggest decline since Aug 2015 (Y/Y: -1.0% v -0.3%e)
Americas:
Fed Chair Yellen: Appropriate to gradually raise Fed Funds rate as US economy was now pretty healthy. Our estimate of neutral rate was really not that high; Could not wait too long to tighten.
President Trump held separate talks with UK PM May and German Chancellor Merkel on Syria. Both leaders expressed support for US action in Syria
White House official: Trump administration is open to additional strikes on Syria
Energy:
Kuwaiti Oil Min Ahmed: sees signs global crude stocks dropping, expects further declines in coming months; expects OPEC/Non OPEC compliance to be higher in March
Economic Data
(JP) Japan Mar Preliminary Machine Tool Orders Y/Y: 22.6% v 9.1% prior
(RO) Romania CPI M/M: 0.1% v 0.1%e; Y/Y: 0.2% v 0.3%e
(HU) Hungary Mar CPI (miss) M/M: 0.0% v 0.3%e; Y/Y: 2.6% v 3.1%e
(TR) Turkey Feb Current Account: -$2.5B v -$2.5Be
(SE) Sweden Mar CPI (miss) M/M: 0.0% v 0.2%e; Y/Y: 1.3% v 1.5%e; CPI Level: # v 320.26e
(SE) Sweden Mar CPI CPIF M/M: 0.0% v 0.1%e; Y/Y: 1.5% v 1.6%e
(UK) Mar CPI M/M: 0.4% v 0.3%e; Y/Y: 2.3% v 2.3%e; CPI Core Y/Y: 1.8% v 1.9%e;
(UK) Mar RPI M/M: 0.3% v 0.4%e; Y/Y: 3.2% v 3.2%e; RPI Ex Mortgage Interest Payments (RPIX) Y/Y: 3.4% v 3.5%e
(UK) Mar PPI Input M/M: +0.4% v -0.1%e; Y/Y: 17.9% v 17.0%e
(UK) Mar PPI Output M/M: 0.4% v 0.1%e; Y/Y: 3.6% v 3.4%e
(UK) Mar PPI Output Core M/M: 0.3% v 0.2%e; Y/Y: 2.5% v 2.5%e
(DE) Germany Apr Zew Current Situation Survey (beat): 80.1 v 77.5e ; Expectations Survey: 19.5 v 14.8e
(EU) Euro Zone Apr Zew Expectations Survey: 26.3 v 25.6 prior
(EU) Euro Zone Feb Industrial Production (miss) M/M: -0.3% v +0.1%e; Y/Y: 1.2% v 1.9%e
Fixed Income Issuance:
(AT) Austria Debt Agency (AFFA) opened its book to sell EUR-denominated 10-year RAGB bond; guidance seen -17bps to mid-swaps
(NL) Netherlands Debt Agency (DSTA) sold €950M vs. €1.25B indicated in 2.5% 2033 DSL bonds; Avg Yield: 0.680% v1.279% prior
(IT) Italy Debt Agency (Tesoro) sold €6.0B vs. €6.0B indicated in 12-month Bills; Avg Yield: -0.239% v -0.226% prior; Bid-to-cover: 1.76x v 1.58x prior
SPEAKERS/FIXED INCOME/FX/COMMODITIES/ERRATUM
Index snapshot (as of 10:00 GMT)
Indices [Stoxx50 -0.4% at 3,471, FTSE +0.4% at 7,375, DAX -0.2% at 12,181, CAC-40 -0.1% at 5,105, IBEX-35 -0.4% at 10,400, FTSE MIB -0.4% at 20,121, SMI flat at 8,617, S&P 500 Futures -0.1%]
Market Focal Points/Key Themes: European equity indices are trading generally lower despite the FTSE 100 outperforming and trading positive; Banking stocks weight heavily in the major indices with the peripheral lender weighted FTSE MIB and the IBEX underperforming; shares of BNP Paribas, Deutsche Bank, and Intesa Sanpaolo the notable sector laggards in the Eurostoxx; shares of LVMH the notable gainer in the index after releasing higher than expected results; Asian equity indices ending mixed overnight. Just the one notable scheduled US earning pre-market, Bank of the Ozarks.
Equities (as of 09:50 GMT)
Consumer Discretionary: [Accell Group ACCEL.NL +19.5% (receives non-binding offer of €32.72/shr cash), JD Sports JD.UK +7.9% (FY16 results), LVMH MC.FR +1.3% (Q1 sales)]
Financials: [Publity PBY.DE +0.5% (Receives a further mandate in a low billion euro range from a South American investor), Valartis VLRT.CH +0.7% (FY16 results, div)]
Industrials: [Vedanta Resources VED.UK +0.1% (Q4 production)]
Technology: [De La Rue DLAR.UK +6.9% (trading update, COO to step down)]
Speakers
German ZEW Economists noted that the domestic economic situation was fairly robust in Q1 and expected the positive momentum to continue
German Leading Economic Institutes (Advisors): Raises both 2017 and 2018 GDP growth forecasts. Raised 2017 GDP growth forecast from 1.4% to 1.5% and 2018 GDP growth forecast from 1.6% to 1.8%
Italy Fin Min Padoan: Domestic economy was on a gradual recovery path
Turkey Econ Min Zeybekci: Lack of supply is behind the root of the inflation issues
Russia Central Bank Dep Gov Yudaeva: End-2017 CPI could be under 4%
Russia Fin Min Siluanov: Inflation might fall below 4% by end 2017
Russia Energy Min Novak: To meet with oil companies to discuss extension of OPEC/Non-Opec oil production cut agreement. Russia to reach 250K bpd cut level by mid-April
Saudi Arabia Mar oil production reportedly poised to fall towards 9.9M bpd
Currencies
Several bits of Continental European inflation data came in below expectations and moved off multi-year highs thus adding support to policy makers' calls to maintain loose monetary conditions. EUR cross selling also emerging as a prevalent theme as markets assessed the upcoming French election and EMU political stability risks. Dealers noted that recent French election polls taking a risk bearish turn. EUR/JPY was softer and below its 200-day moving average as dealers cited that Japan-based entities hold around 12% of all outstanding French sovereign bonds
GBP/USD edged higher towards the 1.2450 area after UK Mar CPI inflation remained above BOE target for 2nd straight month (2.3% v 2.3%e).
Fixed Income
Bund futures trade at 163.15 up 15 ticks consolidating above the 163 level, although off the session highs as European Indices claw back earlier losses. Futures traded a high of 163.39 which marked a new contract high, with a break back above targeting 163.57 then 163.99. A reversal looks to 162.84 initially followed by 162.25.
Gilt futures trade at 128.09 up 4 ticks retracing the bulk of the gain seen this morning after slightly stronger UK inflation data put pressure on futures. Support remains at 127.75 then 127.34 followed by 127.05. A move above 128.45 high sees resistance at 128.63 followed by 128.96. Short Sterling futures trade flat to up 1bp with Jun17Jun18 flattening 10.5/11bp
Tuesday's liquidity report showed Monday's excess liquidity rose to €1.620T a rise of €20B from €1.600T prior. Use of the marginal lending facility rose to €185M from €131M prior.
Corporate issuance saw $4.4B come to market via 4 issuers headlined by General Motors 3 part $3B issuance. Issuance for the week is expected to be front loaded ahead of the Easter Holidays and estimated to be in the $10B region.
Looking Ahead
(US) Sec of State Tillerson travels to Italy and Russia
05.30 (UK) Weekly John Lewis LFL sales data
05:30 (EU) ECB allotment in 7-Day Main Refinancing Tender
05:30 (HU) Hungary Debt Agency (AKK) to sell 3-month Bills
05:30 (BE) Belgium Debt Agency (BDA) to sell €2.1-2.5B in 3-Month and 12-Month Bills
06:00 (US) Mar NFIB Small Business Optimism: 104.7e v 105.3 prior
06:30 (IS) Iceland to sell 6-month Bills
06:45 (US) Daily Libor Fixing
07:00 (ZA) South Africa Feb Manufacturing Production M/M: No est v -0.4% prior; Y/Y: 0.2%e v 0.8% prior
07:30 (CL) Chile Central Bank Economist Survey
07:45 (US) Weekly Goldman Economist Chain Store Sales
08:00 (PL) Poland Mar Final CPI M/M: No est v -0.1% prelim; Y/Y: No est v 2.0% prelim
08:00 (RU) Russia announces weekly OFZ bond auction
08:15 (UK) Baltic Dry Bulk Index
08:55 (US) Weekly Redbook Sales
09:00 (MX) Mexico Feb Industrial Production M/M: -0.1%e v +0.1% prior; Y/Y: -1/5%e v -0.1% prior; Manufacturing Production Y/Y: 1.2%e v 4.3% prior
09:00 (RU) Russia Q1 Preliminary Current Account: $18.8Be v $10.1B prior
09:00 (RU) Russia Feb Trade Balance: $10.3Be v $11.4B prior; Exports: $26.7Be v $25.1B prior; Imports: $15.2Be v 13.7B prior
09:00 (EU) Weekly ECB Forex Reserves: € v € prior
10:00 (US) Feb Jolts Job Openings: 5.650Me v 5.626M prior
11:00 (EU) ECB's Visco (Italy) speaks EP Committee in Brussels
11:30 (US) Treasury to sell 4-Week Bills
13:00 (US) Treasury to sell 10-Year Notes Reopening
13:45 (US) Fed's Kashkari (dove, dissenting vote) Q&A in Minneapolis
15:00 (AR) Argentina Mar National CPI M/M: 2.0%e v 2.5% prior
16:30 (US) Weekly API Oil Inventories
Gold Testing Uptrend Support, Silver Still Weak, Crude Oil Continued Bullish Move.
Gold Testing uptrend support.
Gold challenge to near term resistance has paused yet, momentum seems back to bullish despite some consolidation on trendline support. Resistance is located at 1263 (27/02/2017 high). Hourly support can be found at 1224.10 (16/03/2017 low).
In the long-term, the technical structure suggests that there is a growing upside momentum. A break of 1392 (17/03/2014) is necessary ton confirm it, A major support can be found at 1045 (05/02/2010 low).
Silver Still weak.
Silver is trying to find a new equilibrium after its massive sell-off, however, demand has not materialized. Strong resistance is given at a distance at 18.49 (27/02/2017 high). Key support is given at 16.82 (15/03/2017 low).
In the long-term, the death cross indicates that further downsides are very likely. Resistance is located at 25.11 (28/08/2013 high). Strong support can be found at 11.75 (20/04/2009).
Crude oil Continued bullish move.
Crude oil keeps on increasing. The commodity had been located in a bearish trend since the commodity had been unable to mount a serious challenge to resistance at 55.24 (03/01/2017 high) but now the pair is heading higher. Resistance is given at 51.88 (05/041/2017 high). Hourly support is given at 47.09 (22/03/2017 low).
In the long-term, crude oil has recovered after its sharp decline last year. However, we consider that further weakness are very likely. Strong support lies at 24.82 (13/11/2002) while resistance can now be found at 55.24 (03/01/2017 high).
EUR/CHF Weak Technical Signals, EUR/JPY Fade Buying, EUR/GBP Marginal Selling Pressure On Trendline.
EUR/CHF Weak technical signals.
EUR/CHF has paused near the key support at 1.0684 (see also the falling channel). However, the persistent succession of lower highs favours a bearish bias. Hourly resistances can be found at 1.0691 (07/04/2017 high). The medium-term pattern suggests us to see continued bearish pressures towards key support that can be found at 1.0623 (24/06/2016 low). Expected to see further decline.
In the longer term, the technical structure is mixed. Resistance can be found at 1.1200 (04/02/2015 high). Yet,the ECB's QE programme is likely to cause persistent selling pressures on the euro, which should weigh on EUR/CHF. Supports can be found at 1.0184 (28/01/2015 low) and 1.0082 (27/01/2015 low).
EUR/JPY Fade buying.
EUR/JPY recovery bounce off support was short lived. Resistance stands at 122.88 (13/03/0217 high). Support at 117.43 has held up so far however, break would trigger further weakness towards strong support given at 113.73 (09/11/2016 low)
In the longer term, the technical structure validates a medium-term succession of lower highs and lower lows. As a result, the resistance at 149.78 (08/12/2014 high) has likely marked the end of the rise that started in July 2012. Strong support at 94.12 (24/07/2012 low) looks nonetheless far away.
EUR/GBP Marginal selling pressure on trendline.
EUR/GBP is consolidating following sharp fall, yet further upside is likely. Hourly resistance is given at 0.8591 (05/04/2017 high). Strong resistance is given at 0.8787 (13/03/2017 high). Hourly support can be found at 0.8484 (31/03/2017 low). Expected to show continued weakness.
In the long-term, the pair has largely recovered from recent lows in 2015. The technical structure suggests a growing upside momentum. The pair is trading above from its 200 DMA. Strong resistance can be found at 0.9500 psychological level.
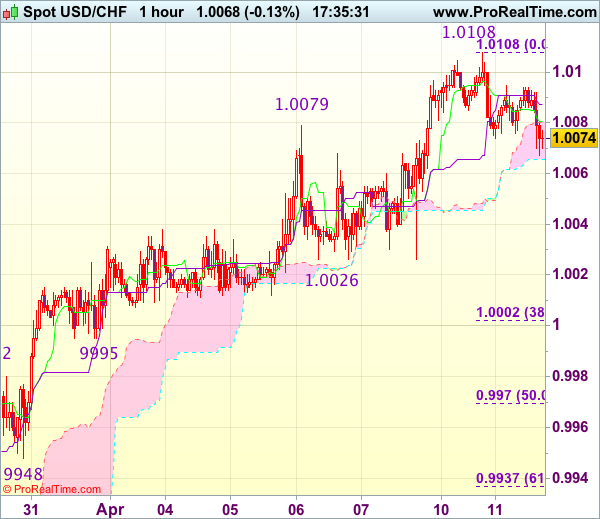
Trade Idea Update: USD/CHF – Buy at 1.0000
USD/CHF - 1.0069
Original strategy :
Buy at 1.0000, Target: 1.0100, Stop: 0.9965
Position : -
Target : -
Stop : -
New strategy :
Buy at 1.0000, Target: 1.0100, Stop: 0.9965
Position : -
Target : -
Stop : -
As the greenback has retreated after rising to 1.0108 yesterday, suggesting consolidation below this level would be seen and initial downside risk is for pullback to 1.0050, then towards support at 1.0026, however, reckon 0.9995 support would contain weakness and bring another rise later, above indicated resistance at 1.0108-09 would extend recent upmove from 0.9813 towards 1.0140-45 but loss of upward momentum should prevent sharp move beyond another previous resistance at 1.0171, risk from there has increased for a retreat to take place later.
In view of this, would not chase this rise here and would be prudent to buy dollar on subsequent pullback as support at 0.9995 should limit downside. Below 0.9970 (50% Fibonacci retracement of 0.9831-1.0108) would abort and signal top is formed instead, bring correction to support at 0.9948.
Fed’s Chairman Janet Yellen Delivers Speech At University Of Michigan
'Now the focus is different and we want to make sure that we sustain the progress that we have achieved, and that the appropriate stance of policy now is something closer to neutral.' - Janet Yellen, Federal Reserve
On Monday, Janet Yellen, the Chairman of the US Federal Reserve, delivered a speech on monetary policy at the University of Michigan. She noted that country went through a long and severe recession, as the Fed failed to identify growth of systemic risks, which made the country's financial system very vulnerable. Nevertheless, she believed that the Central bank's course of recovery was chosen correctly, with unemployment standing now at 4.5% and inflation fluctuating just above the targeted 2%. These figures showed that the economy was growing at a moderate pace. She noted that consumer spending remained the main driver of economic growth but added that there were significant improvements in housing and investment. The similar picture was observed in terms of the global economy, which also became more robust and healthier. Altogether, the Federal Reserve Chair suggested that the economy would continue developing at a modest pace. Thus, the Fed's main objective should be to sustain the achieved result, i.e. full employment, and stabilize inflation around 1.75%-2%. She noted that if the economy continues to perform in line with the Fed's objectives, it would gradually raise short-term interest rates in the upcoming months.
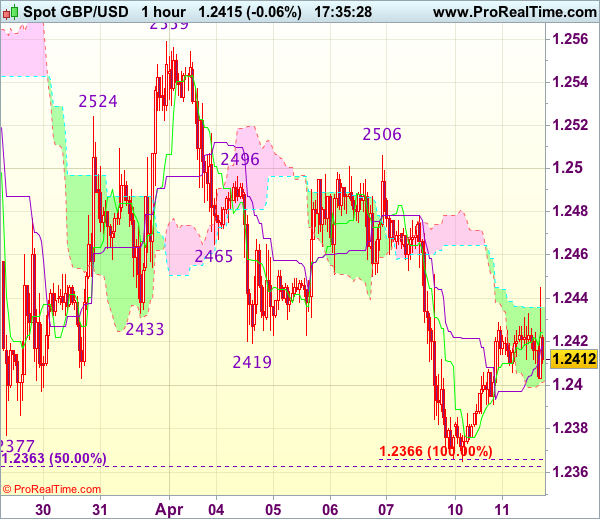
Trade Idea Update: GBP/USD – Sell at 1.2475
GBP/USD - 1.2417
Original strategy :
Sell at 1.2475, Target: 1.2375, Stop: 1.2510
Position : -
Target : -
Stop : -
New strategy :
Sell at 1.2475, Target: 1.2375, Stop: 1.2510
Position : -
Target : -
Stop : -
Cable’s rebound after finding good support around 1.2365-66 has retained our view that further consolidation above this level would be seen and gain to 1.2445-50 cannot be ruled out, however, reckon 1.2475-80 would limit upside and bring another decline later, below said support at 1.2365-66 would extend recent decline from 1.2616 to 1.2350, then towards 1.2325-30 but oversold condition should limit downside and reckon 1.2300 would hold from here.
In view of this, would not chase this fall here and would be prudent to sell cable on further subsequent recovery as 1.2475-80 should limit upside. Only break of resistance at 1.2506 would abort and signal low is formed, bring a stronger rebound to 1.2525-30 first.
Trade Idea Update: EUR/USD – Sell at 1.0665
EUR/USD - 1.0606
Original strategy :
Sell at 1.0665, Target: 1.0565, Stop: 1.0700
Position : -
Target : -
Stop : -
New strategy :
Sell at 1.0665, Target: 1.0565, Stop: 1.0700
Position : -
Target : -
Stop : -
As the single currency has continued trading defensively after recent selloff, suggesting recent decline may resume after consolidation, although corrective bounce to 1.0625-35 cannot be ruled out, however, reckon upside would be limited to 1.0667 resistance (Friday’s high) and bring another decline later, below support at 1.0570 would extend the decline from 1.0906 to 1.0550-55 (50% projection of 1.0906-1.0635 measuring from 1.0689), then 1.0525-30 but near term oversold condition should prevent sharp fall below 1.0500, risk from there is seen for a rebound later.
In view of this, would not chase this fall here and would be prudent to sell dollar on further recovery as 1.0667 resistance should limit upside. Only a firm break above said resistance at 1.0667 would abort and suggest low is formed instead, risk a stronger rebound to 1.0689, then 1.0702.
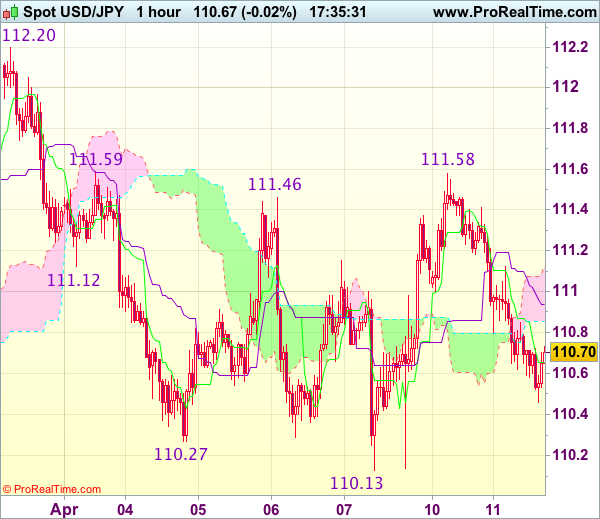
Trade Idea Update: USD/JPY – Hold long entered at 110.60
USD/JPY - 110.65
Original strategy :
Bought at 110.60, Target: 111.60, Stop: 110.25
Position : - Long at 110.60
Target : - 111.60
Stop : - 110.25
New strategy :
Hold long entered at 110.60, Target: 111.60, Stop: 110.25
Position : - Long at 110.60
Target : - 111.60
Stop : - 110.25
Although dollar has remained under pressure after retreating sharp from yesterday’s high of 111.58 and marginal weakness from here cannot be ruled out, reckon 110.25-30 would contain downside and bring another rebound later, above 111.10-15 would suggest the retreat from 111.58 has ended, bring test of 111.58-59 resistance, break there would add credence to our view that further consolidation above recent low at 110.11 would be seen and signal the fall from 112.20 has ended, then a stronger rebound to 111.90-00 would follow but said resistance at 112.20 should hold and choppy trading within 110.11-112.20 would continue.
In view of this, we are holding on to our long position entered at 110.60 but one should exit on such rebound. Below 110.25-30 would risk test of said support at 110.11-13 but only break there would confirm medium term decline has resumed for further subsequent fall to 109.80-85 (1.618 times projection of 112.20-111.12 measuring from 111.59), however, price should hold above 109.50-55 (100% projection of 112.20-110.27 measuring from 111.46).