Sample Category Title
Spot Gold Trades In Established Range
'Gold should retain a measure of support given the political tensions.' – Edward Meir, INTL FCStone (based on Reuters)
Pair's Outlook
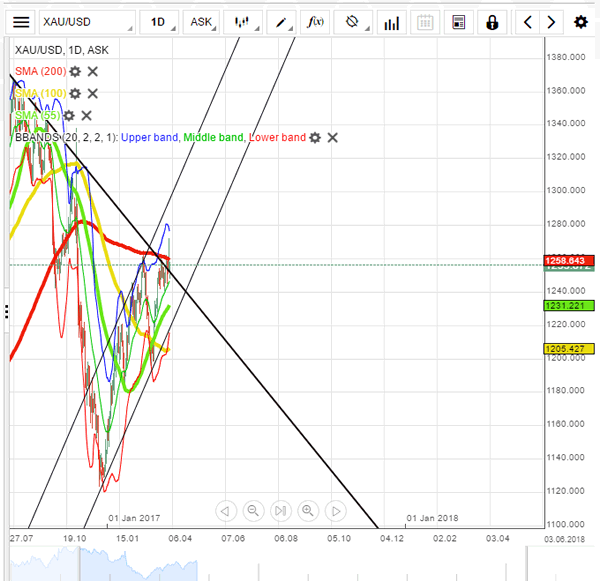
During the early hours of Tuesday's trading session the yellow metal continued to trade just below the resistance cluster, which is located near the 1,257 mark. Just as forecasted, on Monday the bullion bounced between the just mentioned cluster and the support provided by the 50.00% Fibonacci retracement level, which is located at the 1,248.96 mark. The fluctuations should continue. However, it is possible, if the political turmoil persists, that the commodity price breaks the resistance put up by the weekly PP at 1,256.96 and the 200-day SMA, which is located at the 1,256.67 mark.
Traders' Sentiment
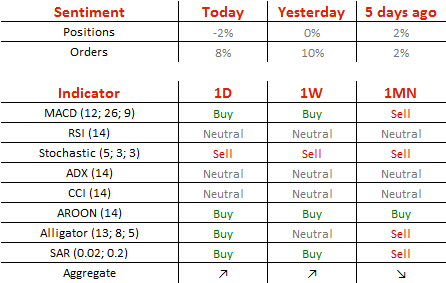
Traders are still near the neutral zone, as 51% of open positions are short. In the meantime, 54% of trader set up orders are to buy.
Technical Outlook: Cable Is Holding Between 10/30SMA’s And Awaiting UK Inflation Data For Signals
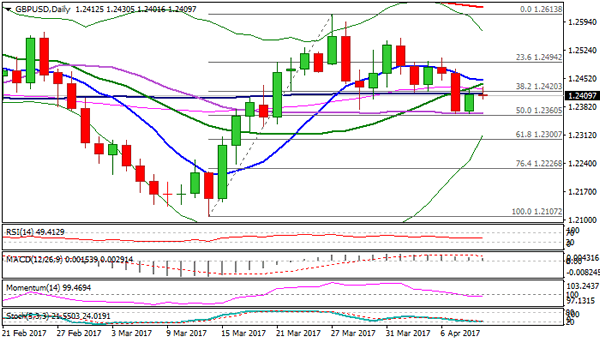
Cable is holding within narrowing daily cloud in early Tuesday and so far unable to break cloud top after bouncing from double downside rejection at 1.2360 (daily Kijun-sen/30SMA). Mixed studies suggest no clear direction, as the pair is stuck between 30 and 10SMA's. Support at 1.2360 also marks 50% retracement of 1.2107/1.2613 upleg and guards another pivotal support at 1.2345 (daily cloud base). The pair is awaiting release of UK inflation data for firmer direction signals. Forecast for annualized CPI for March stands at solid 2.3% and pound is looking for release above, to spark fresh acceleration towards upper pivot at 1.2500 zone. Better than expected inflation numbers today would also support scenario of BOE's early rate hike. Conversely, release below consensus would put sterling under fresh pressure and re-expose lower pivots at 1.2360/45.
Res: 1.2430, 1.2458, 1.2500, 1.2553
Sup: 1.2401, 1.2360, 1.2345, 1.2300
EUR/JPY Daily Outlook
Daily Pivots: (S1) 117.30; (P) 117.68; (R1) 117.91; More...
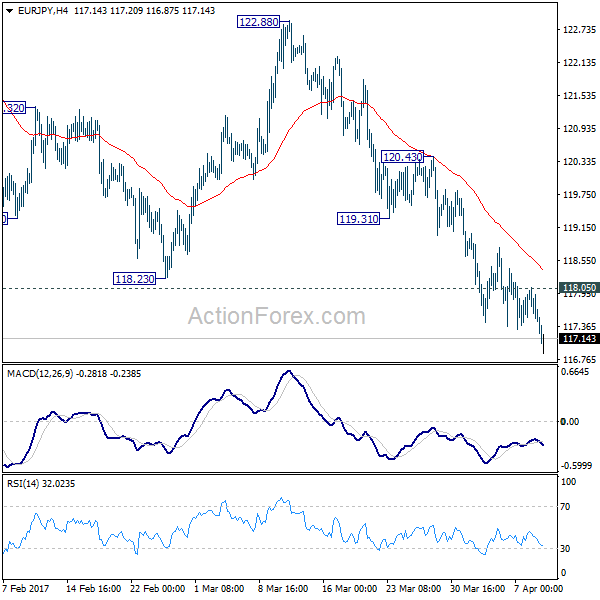
EUR/JPY's fall continues and reaches as low as 116.87 so far. Intraday bias remains on the downside. Whole fall from 124.08 should target 61.8% retracement of 109.20 to 124.08 at 114.88 next. On the upside, above 118.05 minor resistance will turn bias neutral and bring consolidations. But upside should be limited by 119.31 support turned resistance and bring another fall.
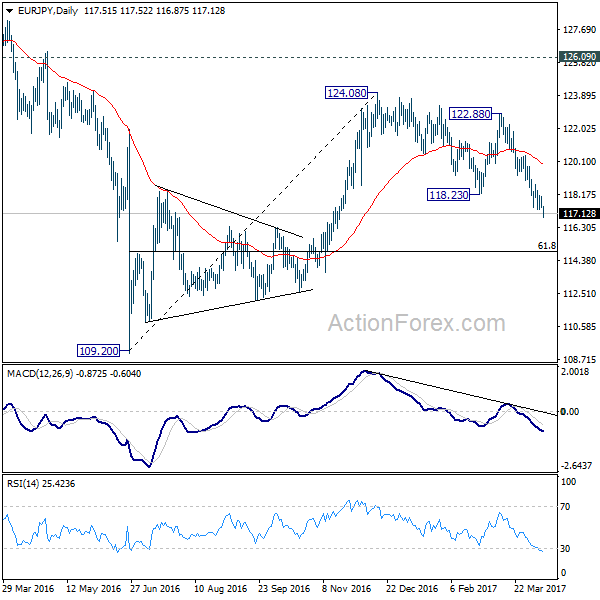
In the bigger picture, the firm break of 38.2% retracement of 109.20 to 124.08 at 118.39 indicates that medium term rise from 109.20 is completed at 124.08. That's well below 126.09 key support turned resistance. Also, EUR/JPY failed to sustain above 55 week EMA. Deeper decline would now be seen back to 109.20 low. Overall, the down trend from 149.76 (2014 high) is not completed yet. Break of 109.20 will resume such down trend towards 94.11 low. In any case, break of 126.09 is needed needed to confirm medium term reversal.
GBP/JPY Daily Outlook
Daily Pivots: (S1) 137.23; (P) 137.75; (R1) 138.21; More...
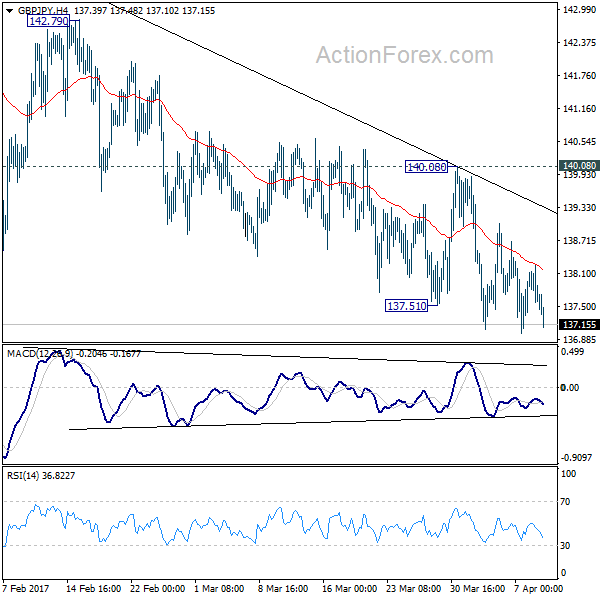
No change in GBP/JPY's outlook. Near term outlook stays mildly bearish and further decline is expected with 140.08 resistance intact. But still, choppy price actions from 148.42 are viewed as a corrective pattern. Hence, we'd anticipate strong support from medium term fibonacci level at 135.39 to bring rebound. On the upside, firm break of 140.08 resistance will now indicate near term reversal and turn bias back to the upside for 142.79 resistance first.
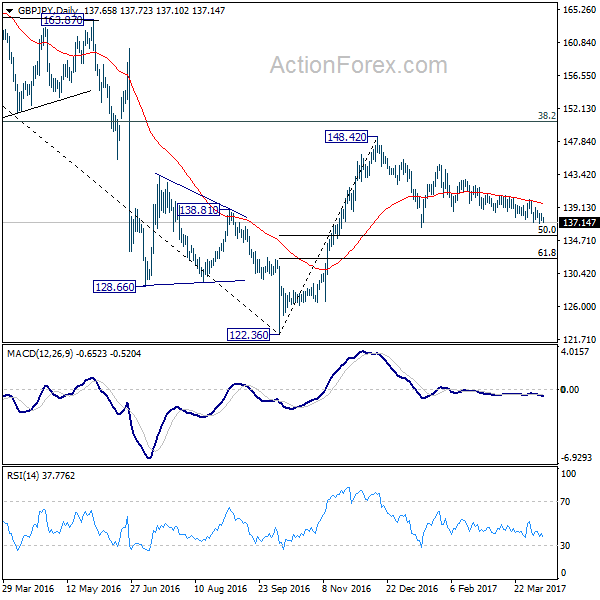
In the bigger picture, price actions from 122.36 medium term bottom are still seen as a corrective pattern. Main focus is on 38.2% retracement of 195.86 to 122.36 at 150.42. Rejection from there will turn the cross into medium term sideway pattern. Or, sustained break of 50% retracement of 122.36 to 148.42 at 135.39 will turn outlook bearish for a test on 122.36 low. Though, sustained break of 150.42 will extend the rebound towards 61.8% retracement of 195.86 to 122.36 at 167.78.
EUR/CHF Daily Outlook
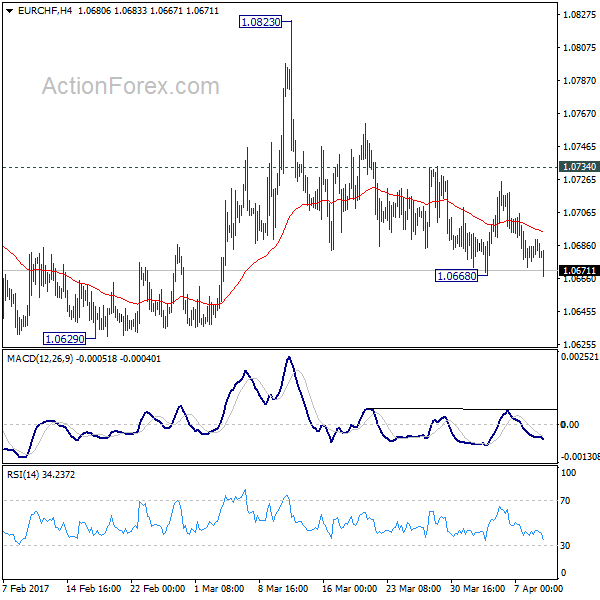
Daily Pivots: (S1) 1.0678; (P) 1.0684; (R1) 1.0692; More...
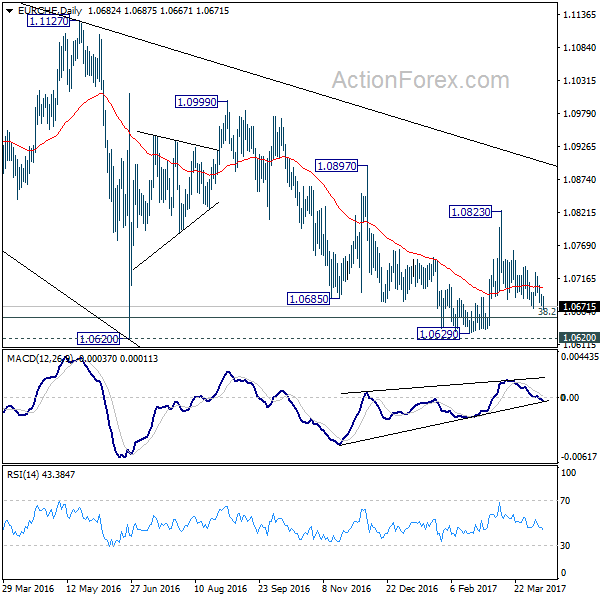
Intraday bias in EUR/CHF remains neutral first. But the bearish outlook is unchanged with 1.0734 resistance intact. That is, rebound from 1.0629 has completed at 1.0823. And the larger decline from 1.1198 is likely still in progress. On the downside, below 1.0668 will target 1.0620/29 key support zone. Decisive break there will resume whole fall from 1.1198 and target next long term fibonacci level at 1.0485. Nonetheless, break of 1.0734 will suggest that pull back from 1.0823 is completed and turn bias back to the upside for this resistance.
In the bigger picture, the decline from 1.1198 is seen as a corrective move. Current development suggests that it's not completed yet. Sustained trading below 38.2% retracement of 0.9771 to 1.1198 at 1.0653 will target 50% retracement at 1.0485. In any case, break of 1.0823 resistance is needed to be the first indication of reversal. Otherwise, deeper fall is still expected even in case of recovery.
Trade Idea : USD/CHF – Buy at 1.0030
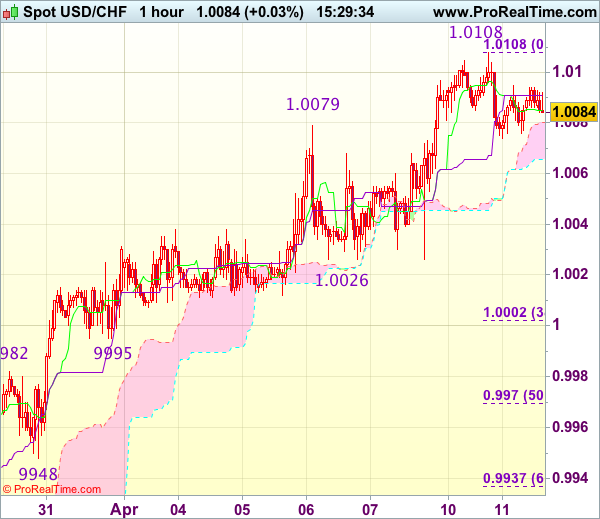
USD/CHF - 1.0074
Most recent candlesticks pattern : N/A
Trend : Near term up
Tenkan-Sen level : 1.0082
Kijun-Sen level : 1.0089
Ichimoku cloud top : 1.0080
Ichimoku cloud bottom : 1.0066
Original strategy :
Buy at 1.0000, Target: 1.0100, Stop: 0.9965
Position : -
Target : -
Stop : -
New strategy :
Buy at 1.0000, Target: 1.0100, Stop: 0.9965
Position : -
Target : -
Stop : -
As the greenback has retreated after rising to 1.0108 yesterday, suggesting consolidation below this level would be seen and initial downside risk is for pullback to 1.0050, then towards support at 1.0026, however, reckon 0.9995 support would contain weakness and bring another rise later, above indicated resistance at 1.0108-09 would extend recent upmove from 0.9813 towards 1.0140-45 but loss of upward momentum should prevent sharp move beyond another previous resistance at 1.0171, risk from there has increased for a retreat to take place later.
In view of this, would not chase this rise here and would be prudent to buy dollar on subsequent pullback as support at 0.9995 should limit downside. Below 0.9970 (50% Fibonacci retracement of 0.9831-1.0108) would abort and signal top is formed instead, bring correction to support at 0.9948.
EUR/AUD Daily Outlook
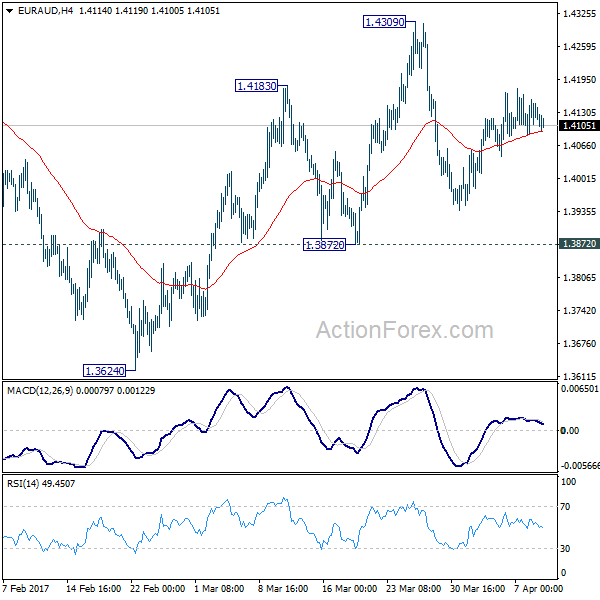
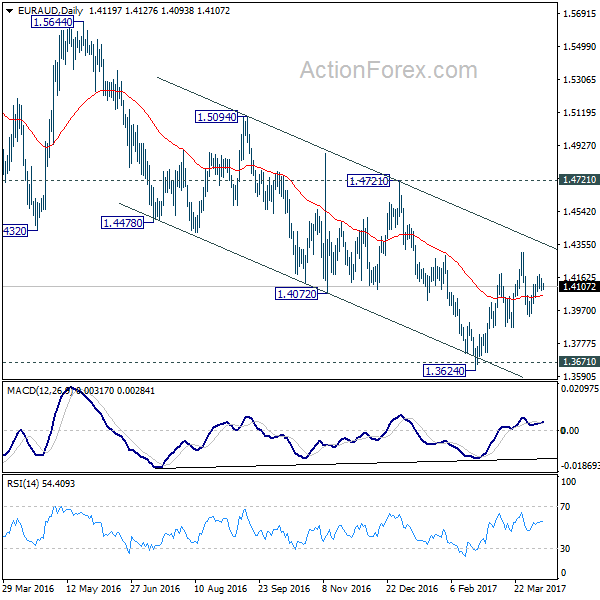
Daily Pivots: (S1) 1.4079; (P) 1.4128; (R1) 1.4160; More...
EUR/AUD is still bounded in range of 1.3872/4309 and intraday bias remains neutral for the moment. With 1.3872 support intact, further rise is in favor. And, we're mildly favoring the case of trend reversal after defending key support level at 1.3671. On the upside, break of 1.4309 will extend the rebound from 1.3624 to 1.4721 key resistance level next. Decisive break of 1.4721 should confirm larger trend reversal. However, firm break of 1.3872 support will dampen our bullish view. In such case, intraday bias will be turned back to the downside for 1.3624 low instead.
In the bigger picture, price actions from 1.6587 medium term top are viewed as a corrective pattern. Such correction could be completed after testing 1.3671 key support. Break of 1.4721 cluster resistance (38.2% retracement of 1.6587 to 1.3624 at 1.4756) should confirm this case and target 61.8% retracement at 1.5455 and above. Overall, we'd expect the up trend from 1.1602 to resume later. However, sustained break of 1.3671 will invalidate our bullish view and would turn extend the fall from 1.6587 towards 1.1602 long term bottom.
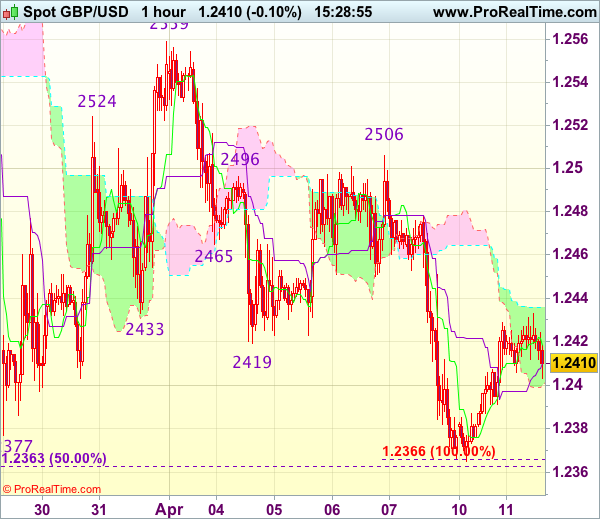
Trade Idea : GBP/USD – Sell at 1.2475
GBP/USD - 1.2413
Most recent candlesticks pattern : N/A
Trend : Near term down
Tenkan-Sen level : 1.2418
Kijun-Sen level : 1.2418
Ichimoku cloud top : 1.2410
Ichimoku cloud bottom : 1.2400
Original strategy :
Sell at 1.2475, Target: 1.2375, Stop: 1.2510
Position : -
Target : -
Stop : -
New strategy :
Sell at 1.2475, Target: 1.2375, Stop: 1.2510
Position : -
Target : -
Stop : -
Cable’s rebound after finding good support around 1.2365-66 has retained our view that further consolidation above this level would be seen and gain to 1.2445-50 cannot be ruled out, however, reckon 1.2475-80 would limit upside and bring another decline later, below said support at 1.2365-66 would extend recent decline from 1.2616 to 1.2350, then towards 1.2325-30 but oversold condition should limit downside and reckon 1.2300 would hold from here.
In view of this, would not chase this fall here and would be prudent to sell cable on further subsequent recovery as 1.2475-80 should limit upside. Only break of resistance at 1.2506 would abort and signal low is formed, bring a stronger rebound to 1.2525-30 first.
Technical Outlook: EURUSD – Bearish Technicals Favor Further Downside, Daily Cloud Base Is key
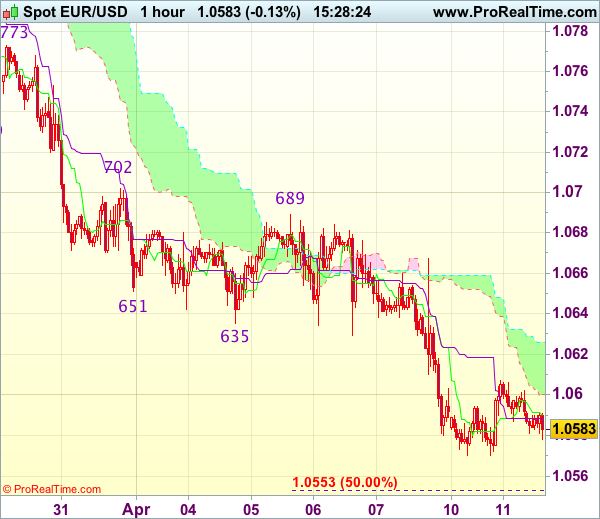
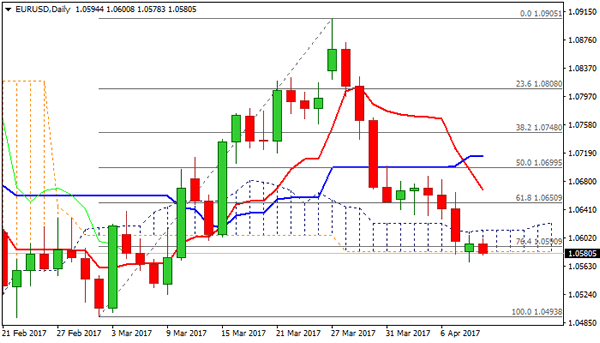
The Euro was in red in Asia but still holding above daily cloud base at 1.0583 that so far marks significant support, as Monday's probe below failed to sustain break.
Multiple daily MA's bear crosses continue to weigh, as bearish momentum is building up and favoring further easing.
Near-term action is also pressured by thick falling hourly cloud (spanned between 1.0598 and 1.0624) with bearish bias expected to remain while the price stays below the cloud.
On the other side, prolonged consolidation above fresh lows at 1.0570 could be expected while daily cloud top (1.0612) caps, as oversold slow stochastic on daily chart is struggling to break above oversold territory and generate bullish signal. However, talks of delay of US tax reform would support the Euro.
Good offers lay at 1.0600/25, with extended uptick not to exceed broken Fibo 61.8% barrier at 1.0650.
Resumption of downtrend from 1.0905 needs clear break below daily cloud base to expose interim support at 1.0524 and key short-term support at 1.0493 (02 Mar low).
The Euro is eyeing release of German/EU ZEW economic sentiment data for firmer signals
Res: 1.0598, 1.0612, 1.0625, 1.0650
Sup: 1.0578, 1.0568, 1.0524, 1.0493
Trade Idea : EUR/USD – Sell at 1.0665
EUR/USD - 1.0588
Most recent candlesticks pattern : N/A
Trend : Near term down
Tenkan-Sen level : 1.0590
Kijun-Sen level : 1.0589
Ichimoku cloud top : 1.0626
Ichimoku cloud bottom : 1.0600
Original strategy :
Sell at 1.0665, Target: 1.0565, Stop: 1.0700
Position : -
Target : -
Stop : -
New strategy :
Sell at 1.0665, Target: 1.0565, Stop: 1.0700
Position : -
Target : -
Stop : -
As the single currency has continued trading defensively after recent selloff, suggesting recent decline may resume after consolidation, although corrective bounce to 1.0625-35 cannot be ruled out, however, reckon upside would be limited to 1.0667 resistance (Friday’s high) and bring another decline later, below support at 1.0570 would extend the decline from 1.0906 to 1.0550-55 (50% projection of 1.0906-1.0635 measuring from 1.0689), then 1.0525-30 but near term oversold condition should prevent sharp fall below 1.0500, risk from there is seen for a rebound later.
In view of this, would not chase this fall here and would be prudent to sell dollar on further recovery as 1.0667 resistance should limit upside. Only a firm break above said resistance at 1.0667 would abort and suggest low is formed instead, risk a stronger rebound to 1.0689, then 1.0702.