Sample Category Title
GBP/JPY Daily Outlook
Daily Pivots: (S1) 136.73; (P) 137.54; (R1) 138.18; More...
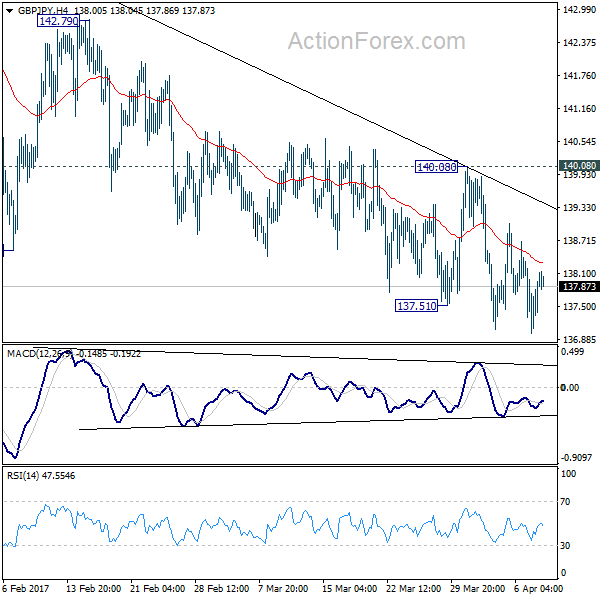
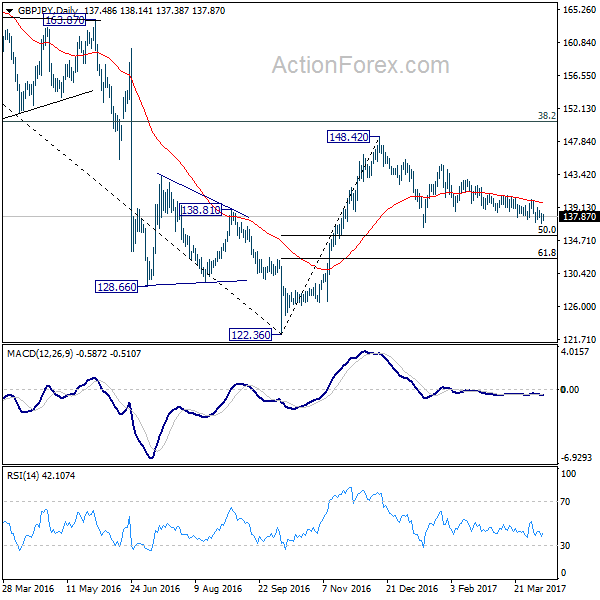
Further fall is expected in GBP/JPY with 140.08 resistance intact. But still, choppy price actions from 148.42 are viewed as a corrective pattern. Hence, we'd anticipate strong support from medium term fibonacci level at 135.39 to bring rebound. On the upside, firm break of 140.08 resistance will now indicate near term reversal and turn bias back to the upside for 142.79 resistance first.
In the bigger picture, price actions from 122.36 medium term bottom are still seen as a corrective pattern. Main focus is on 38.2% retracement of 195.86 to 122.36 at 150.42. Rejection from there will turn the cross into medium term sideway pattern. Or, sustained break of 50% retracement of 122.36 to 148.42 at 135.39 will turn outlook bearish for a test on 122.36 low. Though, sustained break of 150.42 will extend the rebound towards 61.8% retracement of 195.86 to 122.36 at 167.78.
EUR/JPY Daily Outlook
Daily Pivots: (S1) 117.23; (P) 117.70; (R1) 118.08; More...
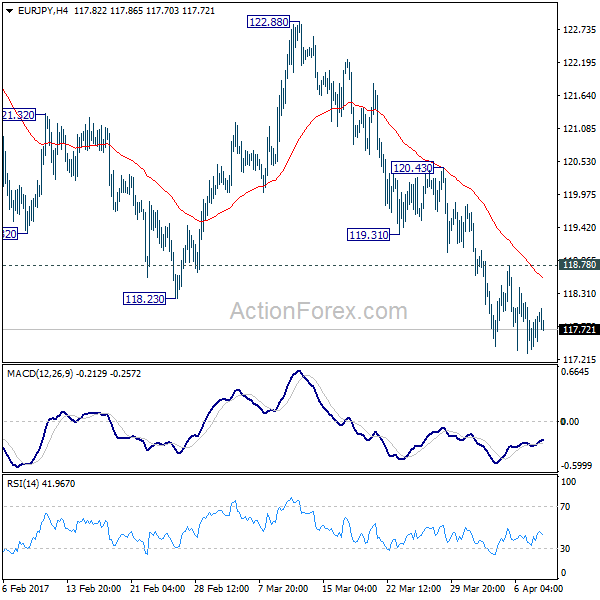
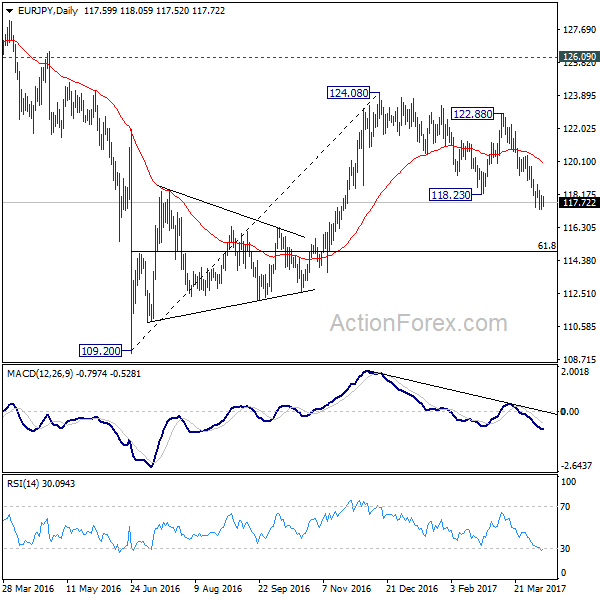
As long as 118.78 resistance holds, deeper decline is expected in EUR/JPY. As noted before, whole medium term rebound from 109.20 is completed at 124.08 already. Next target will be 61.8% retracement of 109.20 to 124.08 at 114.88. On the upside, above 118.78 will indicate short term bottoming and bring rebound back to 119.31/120.43 resistance zone. That also coincides with 55 day EMA (now at 120.19). In that case, we'll look at the reactions in this resistance zone to assess the outlook again.
In the bigger picture, the firm break of 38.2% retracement of 109.20 to 124.08 at 118.39 indicates that medium term rise from 109.20 is completed at 124.08. That's well below 126.09 key support turned resistance. Also, EUR/JPY failed to sustain above 55 week EMA. Deeper decline would now be seen back to 109.20 low. Overall, the down trend from 149.76 (2014 high) is not completed yet. Break of 109.20 will resume such down trend towards 94.11 low. In any case, break of 126.09 is needed needed to confirm medium term reversal.
USD/JPY Candlesticks and Ichimoku Analysis
Weekly
• Last Candlesticks pattern: Marubozu
• Time of formation: 14 Nov 2016
• Trend bias: Down
Daily
• Last Candlesticks pattern: Shooting star
• Time of formation: 15 Feb 2017
• Trend bias: Down
USD/JPY – 111.39
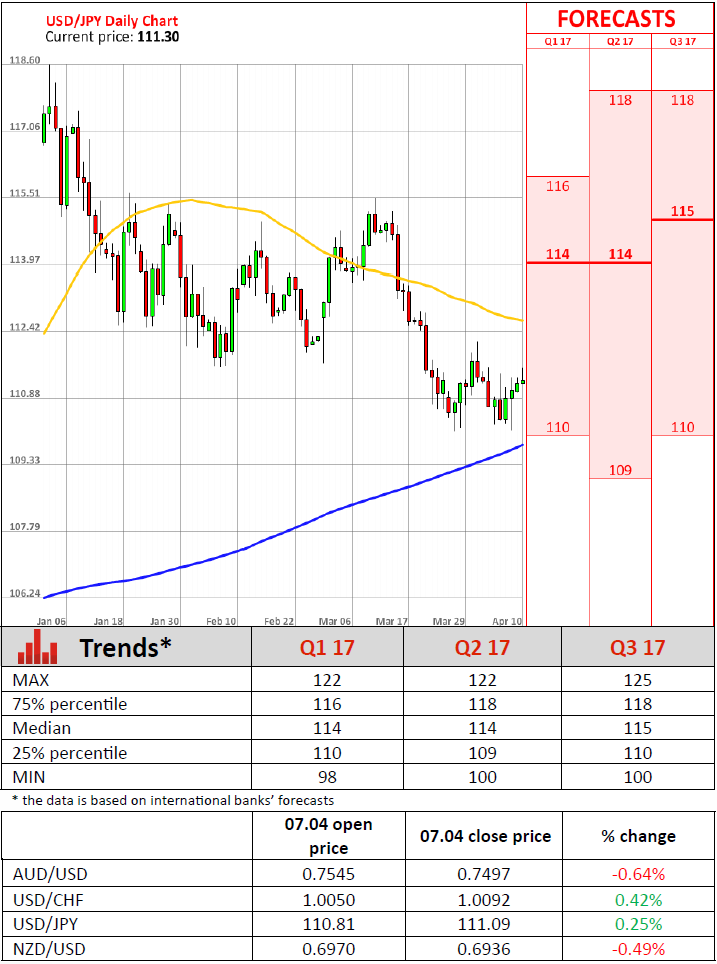
Although the greenback fell to as low as 110.13 late last week, as dollar has rebounded again after holding above indicated previous support at 110.11, suggesting further consolidation would take place and another bounce to 111.65-70 cannot be ruled out, however, as long as resistance at 112.20 holds, prospect of another decline remains, below said support at 110.11-13 would confirm downtrend from 118.66 has resumed and extend weakness to 109.90-95 (50% Fibonacci retracement of 101.19-118.66), then 109.50, however, downside would be limited to 109.00 and previous support at 108.55 should hold from here, price should stay well above dynamic support at 107.85-90 (61.8% Fibonacci retracement of 101.19-118.66) and bring rebound later.
On the upside, expect recovery to be limited to 111.65-70 and bring another decline. Above previous support at 112.26 (now resistance) would risk test of 112.81-90 (current level of the Kijun-Sen and previous resistance) but a daily close above there is needed to signal low is possibly formed, risk a stronger rebound to 113.54 resistance, a break above there would add credence to this view, then further gain to 114.00-10 would follow.
Recommendation : Hold short entered at 111.50 for 109.50 with stop above 112.30.
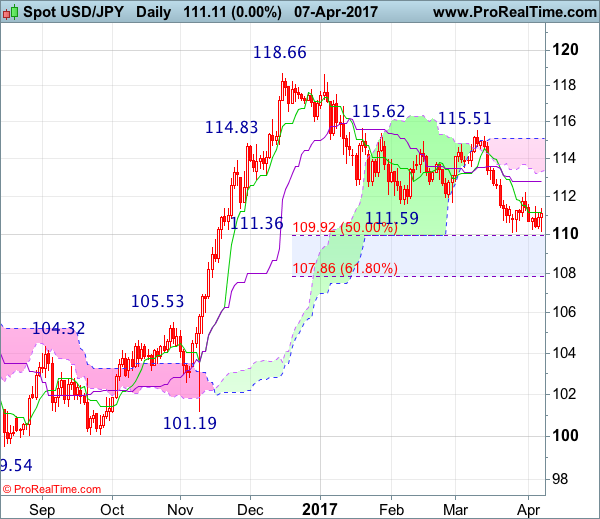
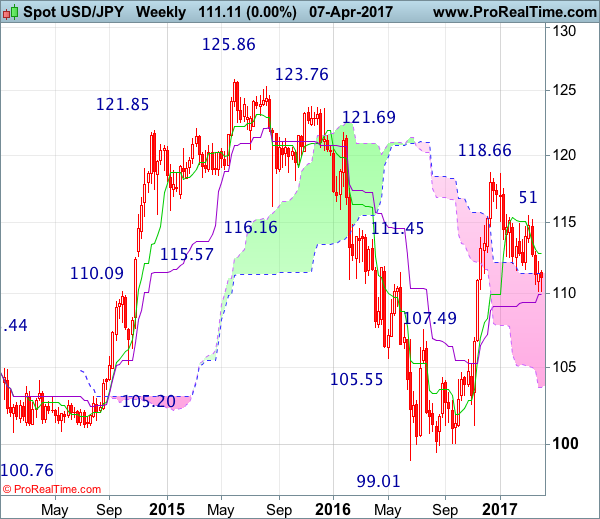
On the weekly chart, as the greenback has recovered again after finding support around the Kijun-Sen (now at 109.79), suggesting minor consolidation above this level would be seen, however, reckon upside would be limited to 112.26 (previous support) would limit upside and bring another decline later, below 109.90-95 (50% Fibonacci retracement of 101.19-118.66) would extend the retreat from 118.66 to 109.00 but reckon support at 108.55 would limit downside and price should stay above 107.85-90 (61.8% Fibonacci retracement), risk from there is seen for a rebound later.
On the upside, although initial recovery cannot be ruled out, reckon upside would be limited to 112.00-10 and bring another decline. Above previous support at 112.26 (now resistance) would defer and suggest a temporary low is formed, bring test of the Tenkan-Sen (now at 112.81), a weekly close above there would add credence to this view, then further gain to 113.54 resistance and then 114.00-10 would follow but price should falter well below resistance at 115.51.
Technical Outlook: USDJPY- Firmer Bullish Signals On Recovery Extension Above Daily Tenkan-Den/Weekly Cloud Top
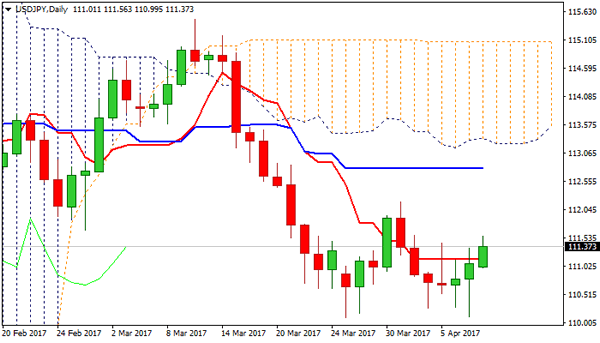
Strong bounce off key 110.00 support zone following repeated downside rejections, extended above upper pivot at 111.14 (daily Tenkan-sen), generating initial signals of double-bottom formation.
Fresh recovery extension on Monday is probing again above another key barrier at 111.36 (weekly cloud top/Fibo 61.8% of 112.18/110.11 downleg) clear break of which is needed for firmer bullish signal.
Near-term studies turned into bullish mode and support further recovery, however, daily technicals remain bearishly aligned and keep the downside vulnerable. Increased downside risk could be expected on close below daily Tenkan-sen line.
Res: 111.56, 111.69, 112.00, 112.18
Sup: 111.14, 110.99, 110.83, 110.69
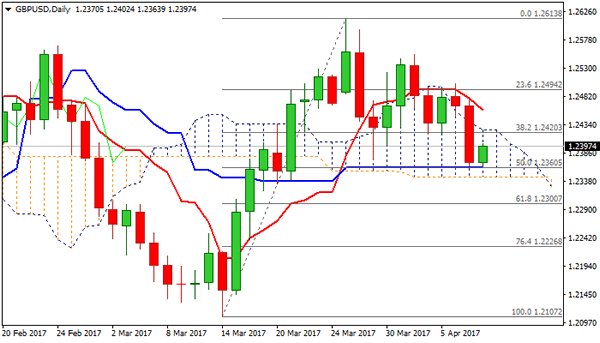
Technical Outlook: GBPUSD – Correction To Precede Fresh Attack At Daily Kijun-Sen/Cloud Base Pivots
Friday's strong fall met its target t 1.2360 (daily Kijun-sen) which is holding for now, with subsequent bounce on profit-taking being underway.
Close below pivots at 1.2420/13 (Fibo 38.2% of 1.2107/1.2613/100SMA) on Friday, generated strong bearish signal for final push below daily Kijun-sen and cloud base (1.2345), to confirm bearish continuation of bear-leg from 1.2613 towards next target at 1.2300 (Fibo 61.8%).
Descending cloud top (currently at 1.2424) should ideally cap, however, slow stochastic is entering oversold territory on daily chart and may signal stronger correction.
Falling daily Tenkan-sen (1.2458) marks upper pivot and break above here would neutralize immediate bears.
Res: 1.2413, 1.2424, 1.2458, 1.2476
Sup: 1.2360, 1.2345, 1.2300, 1.2246
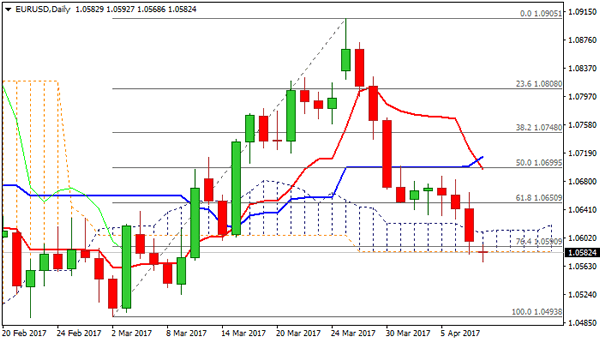
Technical Outlook: EURUSD – Probes Below Daily Cloud Maintain Downside Pressure
Long bearish daily candle that was left on Friday weighs on near-term action, as the Euro probed below daily cloud in early Monday's trading.
Overall strong bearish sentiment is also supported by the second consecutive bearish weekly close and formation of 10/30 SMA bear-cross, seeing risk of further downside on clear break below the cloud. Next target lies at 1.0524 (09 Mar trough), ahead of key short-term support at 1.0492 (22 Feb/02 Mar higher base).
Near-term price action is consolidating around daily cloud base (1.0583), with little support seen from oversold slow stochastic on daily chart that remains in negative territory for now.
Solid barriers at 1.0612/21 (daily cloud top/100 SMA) are expected to ideally cap upticks.
Res: 1.0592, 1.0612, 1.0621, 1.0650
Sup: 1.0568, 1.0524, 1.0492, 1.0452
USD Rallies As Unemployment Rate Hits A 10-Year Low
Last Friday US non-farm payrolls for March rose by only 98K, which was far below expectations of 180K, marking the lowest growth since May 2016. In addition, the previous figure was revised downwardly from 235K to 219K. The average hourly earnings also underperformed, falling by 0.1% to 2.7% in March, from 2.8% in February.
However, the unemployment rate for March fell to 4.5%, better than expectations of 4.7%, marking the lowest level since July 2007. Initially, the dollar index fell from 100.70 to 100.39 due to the underperforming non-farm payrolls. Dramatically, it was followed by a sharp reversal, lifted by the outperforming unemployment rate, hitting a 3-and-a-half-week high of 101.17.
The strengthening of USD weighed on gold prices. Spot gold fell by nearly 200 points last Friday, from a 5-month high of 1270.51. This morning, the dollar index hit the highest level of 101.24 since March 15.
Fed Chair Yellen will make a speech at 21:10 BST this evening at the University of Michigan. Be aware that her comments may give further clues about a rate hike in June and the shrinking of the Fed’s balance sheet. Per the CME’s FedWatch tool the latest probability of a rate hike in June has increased to 67.2%.
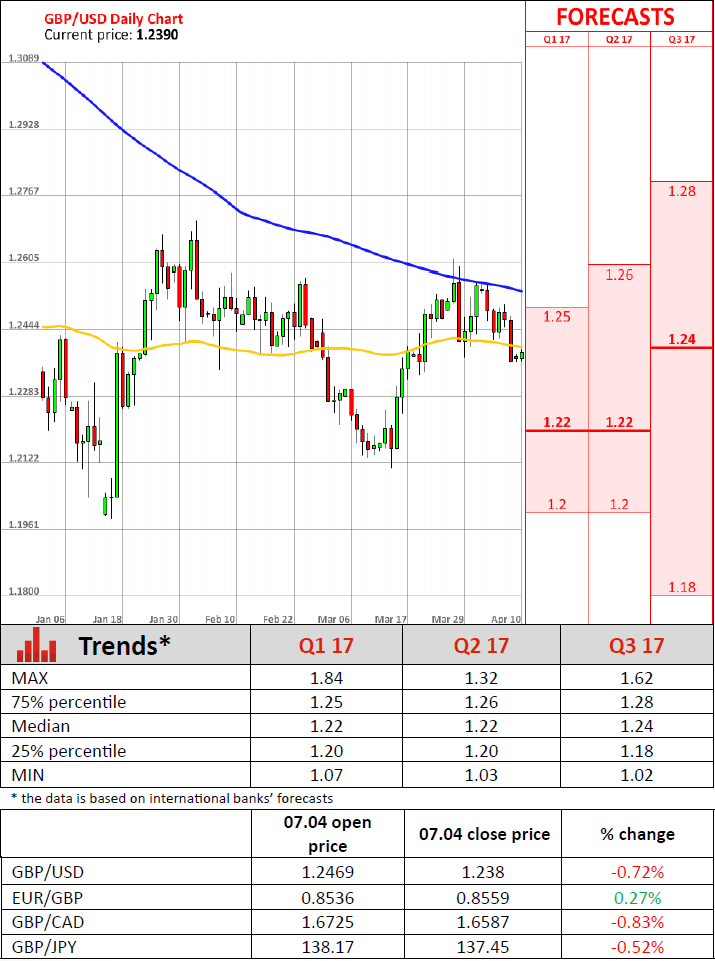
GBP/USD fell to a 2-and-a-half week low of 1.2358 last Friday because of the soft UK manufacturing data (Feb), BoE President Carney’s comment and the strengthening of USD. Carney stated that 'the Brexit negotiation would influence bank regulations and cooperation. The transition period poses a risk to the stability of financial system. The global financial system is at a 'fork in the road' going into the Brexit talks'.
Tuesday April 11, at 09:30 BST, will see the release of a series of UK inflation data for March, including CPI, core CPI, PPI and core PPI. It will likely cause volatility for GBP and GBP crosses.
Trump has condemned China for the theft of millions of US manufacturing jobs resulting in the shutdown of numerous US factories. The Trump-Xi meeting ended last Friday symbolising the start of a new bilateral relationship. The result was in line with Xi’s goal of cooperation for mutual benefits.
China will likely make a large amount of investment in the US which will create around 700,000 jobs, by placing an order to purchase Boeing airplanes, and opening of automotive, agriculture and consumer markets to US companies.
Geopolitical Risks, Additional Factor To Consider The Week Ahead
A U.S. missile strike in Syria, a weaker than expected jobs report, and Fed planning to shrink its balance sheet, all did little to move markets significantly last week.
U.S. stocks fluctuated between gains and losses throughout the week, Treasuries traded in a similar pattern, gold erased gains after jumping to a 5-month high, and the VIX was capped at 13.43.
Such a market behavior indicates that investors are not finding current geopolitical risks significant enough to move them into the defensive. But given Russia’s response on Friday that the missile strikes on the Syrian air base could have extremely serious consequences, investors will keep an open eye the week ahead on how the situation evolves, and the shift from risk appetite to risk aversion may occur in seconds if tensions escalated.
The U.S. earnings season also kicks off next week with banks taking the lead as usual. The financial sector is expected to post a double-digit earnings growth in Q1, the highest growth among all sectors. Given that the rally paused in recent weeks due to concerns about the U.S. administration’s ability to deliver on tax reforms, it requires strong positive surprise to refuel buying momentum.
On the U.S. data front, retail sales and CPI figures will be watched closely after the dollar rose to 3-week highs on Friday on mixed employment report. Markets expect retail sales to remain unchanged in March, but excluding automobiles, gasoline, building materials and food services, sales are projected to rise 0.4%. Inflation is also expected to show a similar trend with CPI figure remaining unchanged in March, but increase 0.2% when excluding food and energy. Fed Chair Janet Yellen will speak on Monday and given the debate around reducing the Fed’s balance sheet, any comments on the normalization process will be closely scrutinized. The key question dollar traders require an answer to, is whether shirking the balance sheet will impact the path of interest rates hikes.
On the other side of the Atlantic, UK economic data releases will take center stage. Sterling ended the week 1.4% lower against the dollar as manufacturing and construction activity unexpectedly slowed last month, in additional signs that the economy lost momentum by the end of first quarter. BoE’s GertjanVlieghe indicated last week that he is in no rush to demand an end to the loose monetary policy. Inflation, employment, and house prices data are all scheduled for release next week, and if the disappointment resumed, GBPUSD would be at a risk of further declines.
UK Manufacturing Production Experiences 0.1% Fall In February
'It is clear that industry does not have the momentum required to offset the consumer-led slowdown in the services sector this year.' - Samuel Tombs, Pantheon Macroeconomics
In February, British total production experienced a 0.7% decrease compared to the previous month, the Office for National Statistics reported on Friday. The revealed figures did not justify experts' forecasts, as they expected to see a 0.3% increase. The decline was registered in all four major sectors. Nevertheless, the largest drop occurred in the electricity and gas industry, where downfall reached 3.4%. It was attributable to lower electricity generation and gas supply amid unusually high temperatures. Another major fall happened in the pharmaceutical, chemical products and crude petroleum industries, where growth plunged 4.4%, 2.1% and 2.6%, accordingly. In contrast, the largest gains were posted by the textiles and electrical equipment industries, where production increased 3.0% and 2.3%, respectively. However, it was not enough to offset the overall negative output of the manufacturing sector, which lost 0.1%, due to the erratic performance of pharmaceutical industry. Nevertheless, on a yearly basis, total production advanced 2.8% in February. Three out of four major sectors showed positive results. Yet, the largest contribution was made by the manufacturing sector, which posted a 3.3% increase, following a gain of 2.6% in the previous month.
US Job Creation Slows In March While Jobless Rate Drops To Lowest Since May 2007
'If today's decline in the unemployment rate doesn't reverse itself they may be compelled not only to hike but also to signal a faster pace of future tightening.' - Michael Feroli, JPMorgan
US private companies created less positions than expected last month; however, a fall in the jobless rate suggested that the labour market remained on a strong footing. The Labour Department reported on Friday that nonfarm payrolls rose 98,000 in March, compared to the previous month's downwardly revised gain of 219,000. Meanwhile, analysts expected the economy to add 174,000 new jobs during the reported period. According to economists, nonfarm employments was hit by the weather-related effects of the big storm that hit the Northeast and Midwest. Meanwhile, the unemployment rate fell to 4.5%, the lowest since May 2007, from 4.7% in February, while analysts anticipated an unchanged reading. In order to keep up with growth in the US working age population, the economy needs to create at least 75,000 jobs each month. Job growth averaged 178,000 per month in the Q1 of 2017, suggesting that an expected 1.0% GDP rise for the Q1 could be temporary. Average hourly earnings advanced 0.2% in March, after climbing 0.3% in the prior month. Back in March, the Fed raised rates for the first time this year and promised two more hikes in 2017. With the economy expected to bounce back in the second quarter, analysts pegged June for the next rate hike.