
Sample Category Title
XAUUSD: Key Levels Amid USD Strength and Powell’s Remarks
Fundamental Analysis
Spot gold (XAU/USD) is steady near 2567.79 after rebounding from a two-month low of 2530, impacted by the strong US dollar and Jerome Powell’s recent speech. The US Dollar Index (DXY) reached a year-to-date high, bolstered by persistent inflation, a robust labour market, and Powell’s optimistic comments describing the US economy as "remarkably strong." This outlook strengthens the USD while weighing on gold due to its non-yielding nature.
The outlook for US interest rates remains pivotal for XAU/USD. Powell indicated the Fed would not rush to cut rates given the economy’s solid performance, diverging from prior expectations of monetary easing. Today’s US Retail Sales data could significantly influence the USD and gold. A result exceeding the projected 0.3% increase may further support the dollar, intensifying bearish pressure on the precious metal.
Other factors affecting gold include reduced positions by large hedge funds and outflows from ETFs, which have recorded a net drop of 12 tonnes in November according to the WGC. Nonetheless, gold retains support as a safe-haven asset amid elevated geopolitical risks. However, progress in ceasefire negotiations in Lebanon might limit this underlying support.
Technical Analysis
XAUUSD, H4
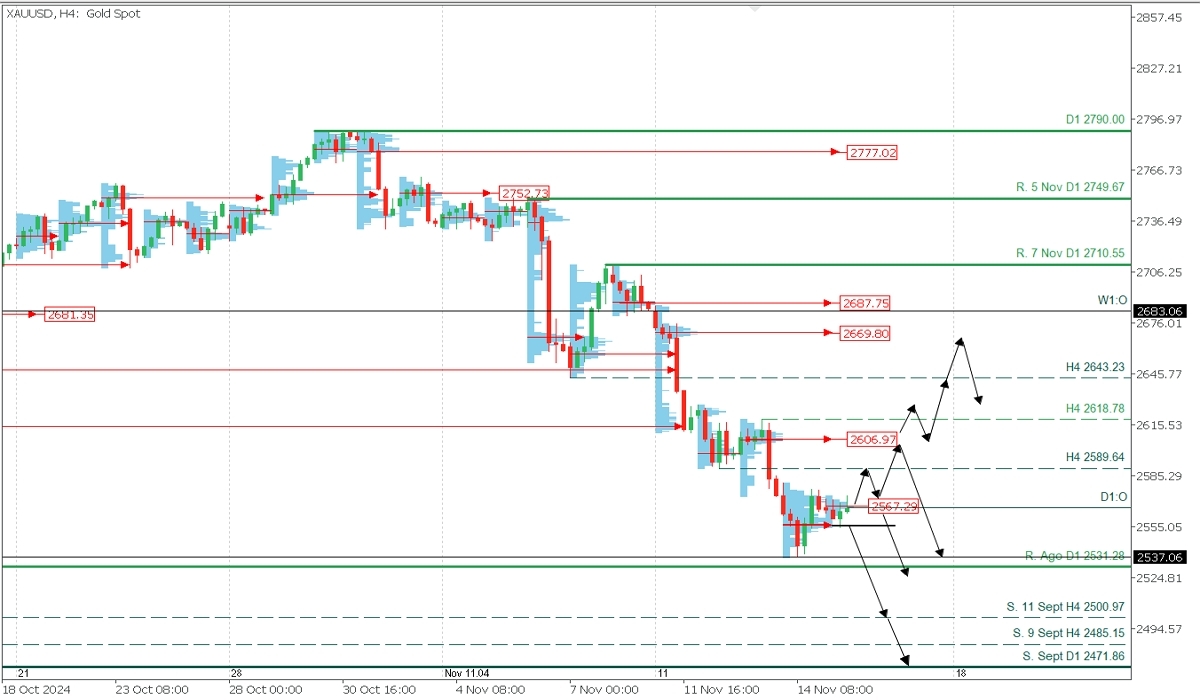
- Supply Zones (Selling): 2606.97 and 2669.80
- Demand Zones (Buying): 2567.29, 2556.43, and 2500
Gold has reached a key demand zone from September after breaking the August resistance. If prices stay above recent volume concentrations and the current demand zone (CDZ) between 2567.29 and 2556.43, a broader correction could be triggered.
Bullish Scenario (Correction):
If prices rise above 2568, expect a correction toward the broken support at 2589.64 or further to the uncovered POC from Wednesday at 2606.97, near the last intraday resistance at 2618.78. A decisive break of 2618.78 may shift the trend, targeting 2643.23, now acting as resistance, and the next supply zone at 2669.80.
Bearish Scenario (Post-Correction):
If resistance at 2618.78 holds, expect a continuation of selling, targeting support at 2537 and a break below 2530 toward the 2500 support from September 11. An early bearish scenario may emerge if prices fall below 2565, heading towards 2530, 2520, 2510, and 2500.
Technical Summary
- Bullish Correction Entry: Buy above 2574 with TP at 2589.64 and 2600. Only a break above 2618.78 justifies further upside to 2643, 2650, and 2669. Use a 1% SL with a low lot size for flexibility.
- Post-Correction Bearish Entry: Sell below 2600 after forming and confirming a PAR* on M5, with TP at 2567 and 2537. Use a 1% SL.
- Early Bearish Entry: Sell below 2565 after confirming a PAR*, with TP at 2530, 2520, 2510, and 2500. Use a 1% SL with a low lot size for flexibility.
Always wait for the formation and confirmation of a Pattern of Exhaustion/Reversal (PER) on M5 before entering trades in the indicated zones.
Glossary:
- Uncovered POC: The Point of Control (POC) is the level with the highest volume concentration. It acts as resistance if followed by a downward move or as support if succeeded by an upward move.
- PER: A Pattern of Exhaustion/Reversal used to validate entry points.
Sunset Market Commentary
Markets
Fed chair Powell laying the groundwork for a pause, possibly already in January, caused a late-session sprint in front-end US rates yesterday. In the first part of today’s trading, however, yields lost several basis points again, showcasing the fatigue that’s creeping in after a stellar October rebound. The US eco calendar had market-moving potential. US retail sales for last month came in weaker than expected. The headline series rose 0.4%, beating the 0.3% estimate, but the three core series at first sight underwhelmed. The control group (ex. food, auto dealers, building mats and gas stations) dropped 0.1% m/m vs expectations for a 0.3% rise. But that only happened because September’s reading was revised up sharply, from 0.7% to 1.2% - the biggest monthly advance since January 2023. It’s even more impressive when considering the fact that US retail sales are not adjusted for price developments: inflation in January 2023 was more than 2.5 times higher than it was in September 2024. All other gauges saw material upward revisions as well. Cyclically sensitive components such as auto sales rose at the quickest pace in three months. The NY Fed’s Empire State manufacturing index was published simultaneously and crushed expectations: 31.2 in November vs an expected flat outcome and compared to -11.9 in October. Prices paid eased slightly, but new orders and shipments surged after a poor last month. The employment component snapped a three-month recovering streak though (4.1 to 0.9). The six months ahead gauge fell from 38.7 to 33.2 but the uptrend remains intact amid strong expected demand. Employment came in at the highest level in more than a year, offsetting some of the weakness seen in the current conditions indicator. The data combo hurled US yields towards new intraday highs. They add between 2.6 to 6.2 bps in a bear steepening move. It even inspired German rates with the front adding 5.4 bps. The US dollar recoups (some of) its previous losses. The trade-weighted index holds below the 107 big figure. EUR/USD returned to yesterday’s close around 1.053. The Japanese yen outperforms (on risk-off) today, along with the Norwegian krone. EUR/NOK drops to 11.69, the lowest level in a month. We suspect that the recent uptick in gas prices has something to do with it. Dutch natural gas futures jumped to their highest level on a year amid supply concerns. Chilly weather and slumping energy production from renewal sources (sun, wind) causes (European) countries to dip into its gas storage faster than what is usually the case.
News & Views
“A gradual rebound in an adverse environment” is the title of today’s released Autumn forecasts by the European Commission. The EC projects this year’s EMU real GDP growth at 0.8%, unchanged from Spring forecasts. The conditions for a mild acceleration of domestic demand and investment appear in place, despite heightened uncertainty. For 2025 and 2026, the EC pencils in 1.3% and 1.6% respectively. Excluding the EU, global growth is projected to hover around 3.5% over the forecast horizon. Growth in the US is seen a bit stronger in 2024 (at 2.7%) before moderating to just above 2% in 2025 and 2026. The outlook for China is slightly weaker than previously expected at 4.9% this year and, notwithstanding the recent stimulus package, to continue slowing down to 4.4% in 2026. India is expected to remain the fastest growing major economy over the forecast horizon. Headline inflation is set to ease from 2.4% this year to 2.1% next year and 1.9% in 2026. Prices of both gas and electricity are expected to decline in 2026 from their 2025 levels.
The Czech National Bank published Minutes of its latest policy meeting at which they lowered the benchmark rate from 4.25% to 4% in a 5-1-1 decision. Vice governor Zamrazilova voted in favor of a pause in the cutting cycle that we might get that at the final meeting of this year, on December 19. She argued that the new forecast saw inflation rising slightly above the upper boundary of the tolerance band in the coming months, and that a potential correction of volatile price items could not be relied on. She additionally pointed out that the new inflation forecast was above the 2% target until mid-2026, a year longer than predicted by the previous forecast. Also the markedly weaker koruna was a reason for putting the rate-cutting process on hold. The combination of the interest rate path and the FX forecast would lead to expansionary monetary policy as early as the Q2 2025, which was another reason for caution given strong upside inflation risks (also housing prices for example). EUR/CZK is going nowhere today at 25.29.
US: Retail Sales Remained Solid in October, Led by Strong Vehicle Sales
Retail sales rose 0.4% month-on-month (m/m) in October, down from the upwardly revised September 2024 gain of 0.8%, but ahead of the consensus forecast calling for an increase of 0.3% m/m.
Trade in the auto sector rose 1.6% m/m, as the decline at automotive parts and accessory stores (-2.0%) was more than offset by the large increase at motor vehicle dealers (+1.9%).
Sales at gasoline stations rose 0.1 % m/m in October, driven by higher volumes as gas prices fell on the month. The building materials and equipment category rose by 0.5% m/m.
Sales in the "control group", which excludes the volatile components above (i.e., gasoline, autos and building supplies) and is used in the estimate of personal consumption expenditures (PCE), fell 0.1% m/m, a sizeable deceleration from the upwardly revised 1.2% monthly gain in September.
Modest gains were recorded at non-store retailers (0.3% m/m) and department stores (0.2% m/m).
Sizeable declines were recorded by miscellaneous stores (-1.6% m/m), sporting goods, hobby, book, & music stores (-1.1% m/m), and health & personal care stores (-1.1% m/m).
Food services & drinking places – the only services category in the retail sales report – rose 0.7% m/m. September's data was also revised up to 1.2% (previously 1.0%).
Key Implications
Retail sales were higher than expected in October due to an outsized uptick in motor vehicle sales, however if motor vehicles are excluded then retails sales were flat on the month. Nevertheless, the 3-month average for retail sales rose from 0.2% in September to 0.6% in October on the back of material upward revisions to the prior month's data. It's possible that Hurricane Milton may have distorted sales readings last month, although clean-up and recovery efforts may lead to higher readings in the months ahead.
U.S. consumption remains healthy on aggregate, supported by a stable labor market and solid real income gains. Our tracking currently puts fourth quarter annualized consumption growth above 3% and only slightly below the third quarter's strong reading. While we currently expect the Federal Reserve to cut by 25 basis points in December, risks surrounding a potential pause to end the year have risen, with markets pricing in roughly 40% odds of that outcome as of the time of writing.
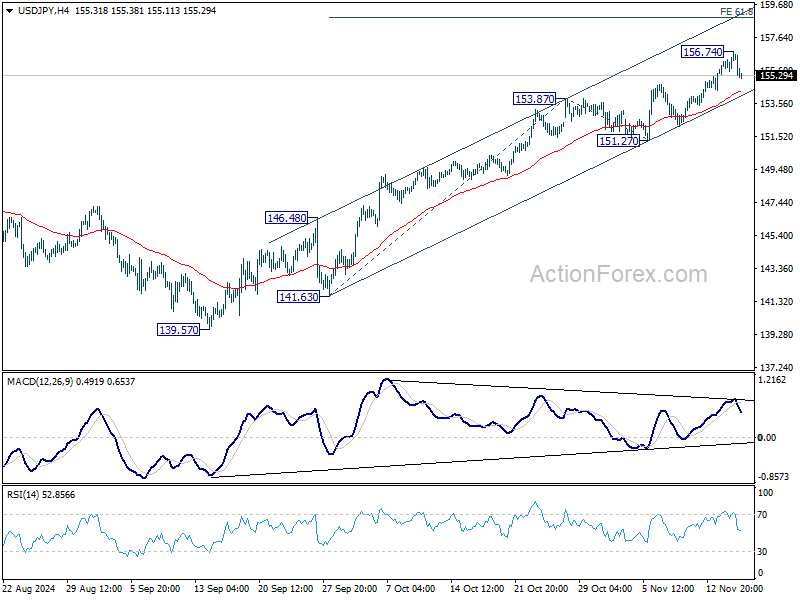
USD/JPY Mid-Day Outlook
Daily Pivots: (S1) 155.60; (P) 156.01; (R1) 156.68; More...
Intraday bias in USD/JPY is turned neutral first with current retreat, and some consolidations could be seen below 156.74 temporary top. Outlook will stay bullish as long as 151.27 support holds, in case of retreat. On the upside, above 156.74 will resume the rally from 139.57 to 61.8% projection of 141.63 to 153.87 from 151.27 at 158.8.
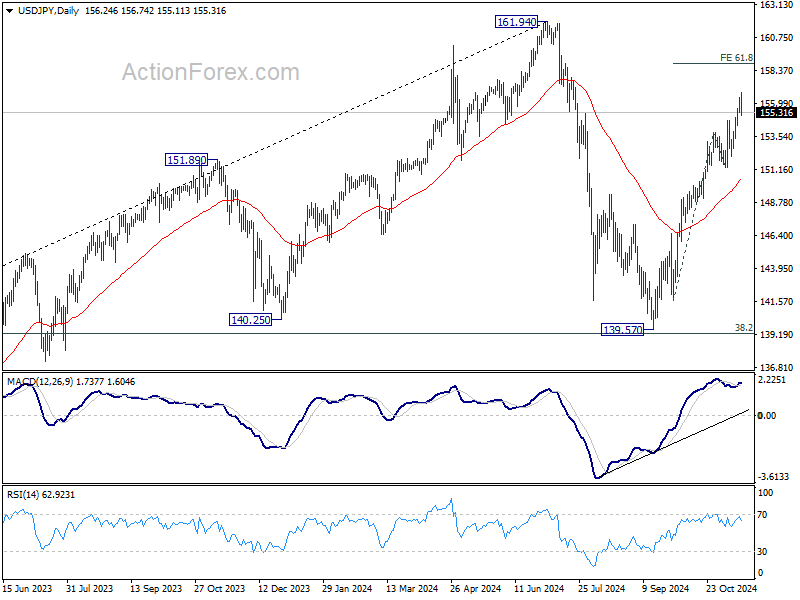
In the bigger picture, price actions from 161.94 are seen as a corrective pattern to rise from 102.58 (2021 low). The range of medium term consolidation should be set between 38.2% retracement of 102.58 to 161.94 at 139.26 and 161.94. Nevertheless, sustained break of 139.26 would open up deeper medium term decline to 61.8% retracement at 125.25.
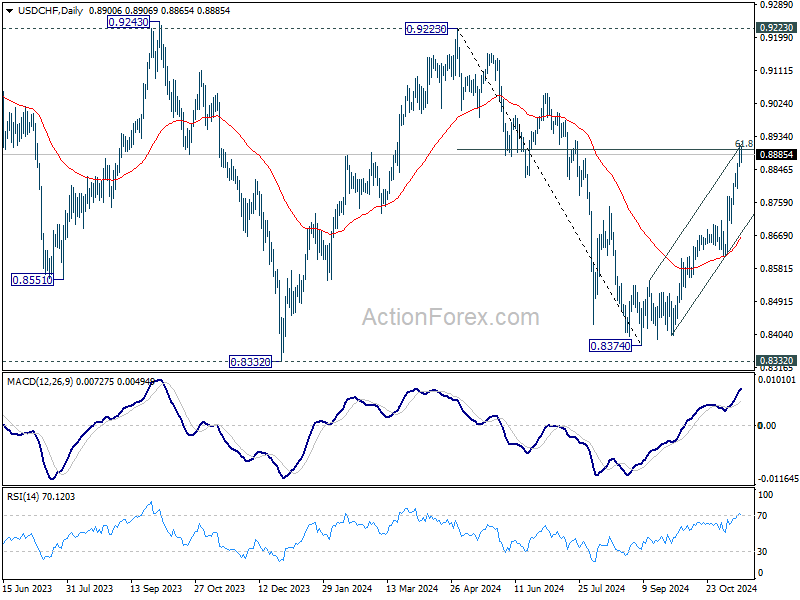
USD/CHF Mid-Day Outlook
Daily Pivots: (S1) 0.8861; (P) 0.8890; (R1) 0.8932; More…
Intraday bias in USD/CHF is turned neutral first with current recovery. Some consolidations would be seen first but outlook will stay bullish as long as 0.8773 support holds. On the upside, sustained break of 61.8% retracement of 0.9223 to 0.8374 at 0.8899 will pave the way to 0.9223 high.
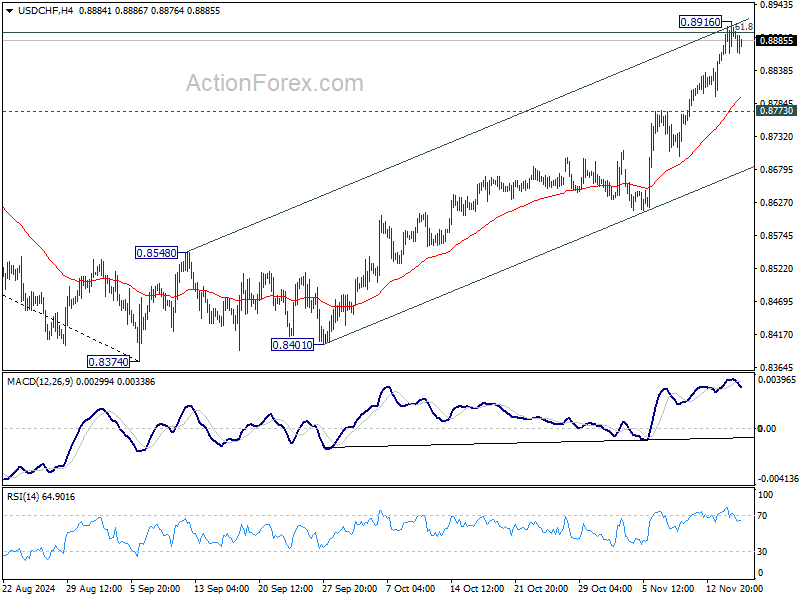
In the bigger picture, price actions from 0.8332 (2023 low) are currently seen as a medium term corrective pattern. Rise from 0.8374 is seen as the third leg. Overall outlook will continue to stay bearish as long as 0.9223 resistance holds. Break of 0.8332 low is in favor at a later stage when the consolidation completes.
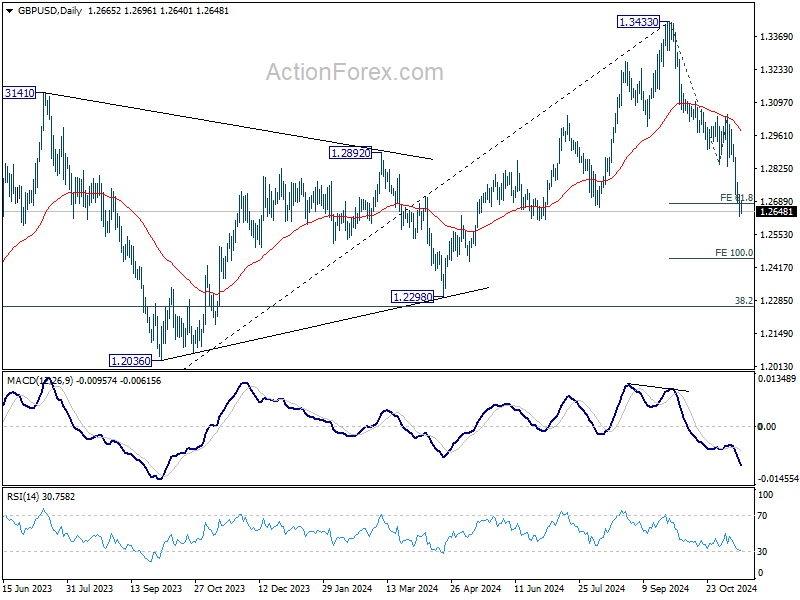
GBP/USD Mid-Day Outlook
Daily Pivots: (S1) 1.2623; (P) 1.2674; (R1) 1.2719; More...
No change in GBP/USD's outlook and intraday bias stays on the downside. CUrrent fall from 1.3433 should target 100% projection of 1.3433 to 1.2842 to 1.3047 at 1.2456. On the upside, above 1.2768 minor resistance will turn intraday bias neutral first. But outlook will stay bearish as long as 13047 resistance holds, in case of recovery.
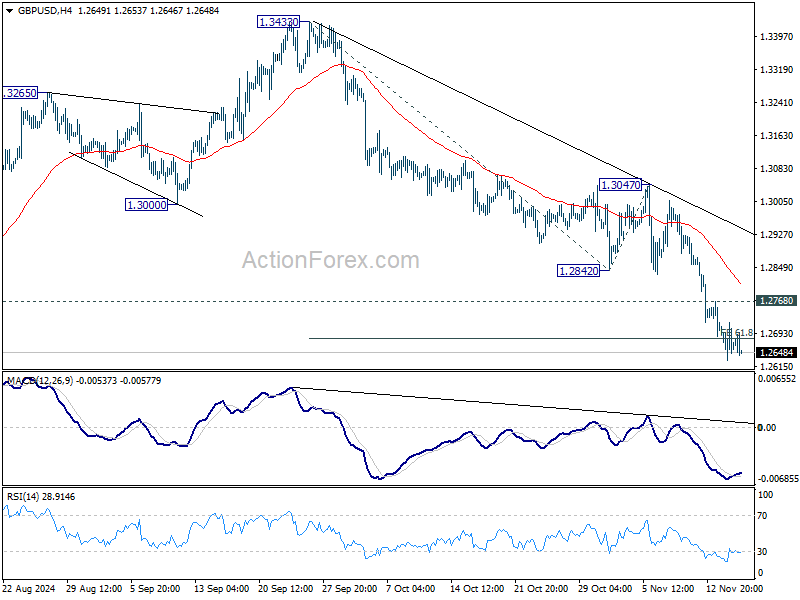
In the bigger picture, considering mildly bearish divergence condition in D MACD, a medium term top is likely in place at 1.3433 already. Price actions from there are seen as correction to whole up trend from 1.0351 (2022 low). Deeper decline would be seen to 38.2% retracement of 1.0351 to 1.3433 at 1.2256, which is close to 1.2298 structural support. Strong support should be seen there to bring rebound.
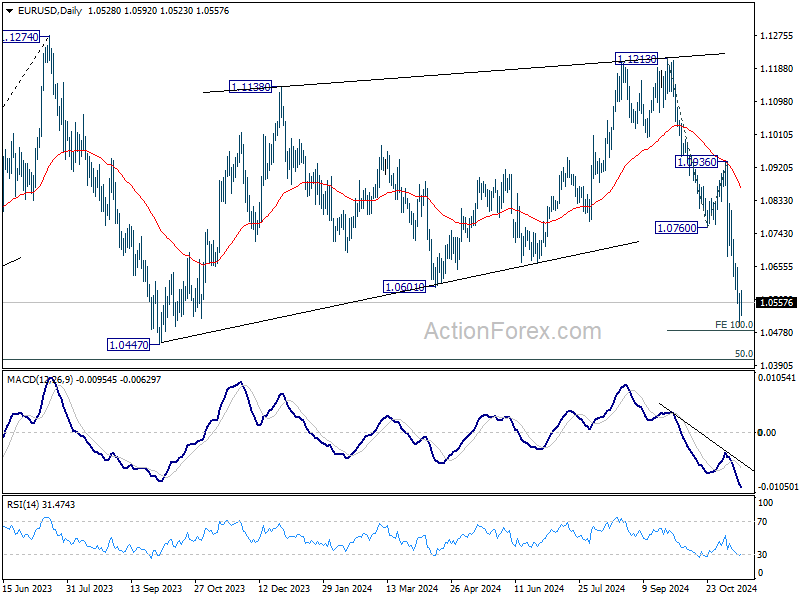
EUR/USD Mid-Day Outlook
Daily Pivots: (S1) 1.0490; (P) 1.0536; (R1) 1.0576; More...
Intraday bias in EUR/USD stays neutral for consolidations above 1.0495 temporary low. But outlook will remain bearish as long as 1.0760 support turned resistance holds. On the downside, firm break of 100% projection of 1.1213 to 1.0760 from 1.0936 at 1.0483 will target 1.0404 key fibonacci level next.
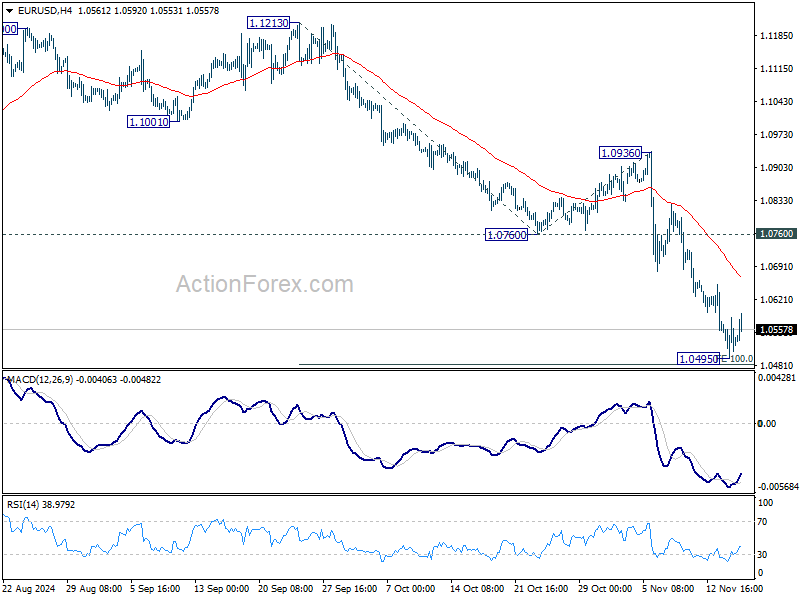
In the bigger picture, price actions from 1.1274 (2023 high) are seen as a consolidation pattern to up trend from 0.9534 (2022 low), with fall from 1.1213 as the third leg. Downside should be contained by 50% retracement of 0.9534 (2022 low) to 1.1274 at 1.0404, to bring up trend resumption at a later stage.
Dollar Holds Weekly Lead Despite Fading Momentum Amid Mixed Retail Data
Dollar is trading slightly lower as the market enters the final US session of the week, with mixed US retail sales data failing to provide fresh momentum for the greenback. The currency appears to be taking a breather as the initial impact of the "Trump Trade" begins to fade. Meanwhile, the likelihood of another rate cut next month has diminished, with futures markets pricing in around a 60% chance. This growing uncertainty adds to the Dollar's lack of immediate direction. In the absence of new political developments, the greenback may enter a consolidation phase until early December when significant economic data releases are expected to provide new catalysts.
Despite the current softness, Dollar remains the strongest performer for the week, followed by Canadian Dollar and Euro. Japanese Yen has moved up slightly but remains the second weakest currency. British Pound has fallen to the position of the worst performer following weaker-than-expected UK GDP data released today. Australian Dollar is the third weakest, with New Zealand Dollar not far behind. Swiss Franc is trading in the middle range.
In Europe, at the time of writing, FTSE is down -0.12%. DAX is down -0.30%. CAC is down -0.36%. UK 10-year yield is down -0.0017 at 4.486. Germany 10-year yield is up 0.011 at 2.353. Earlier in Asia, Nikkei rose 0.28%. Hong Kong HSI fell -0.05%. China Shanghai SSE fell -1.45%. Singapore Strait Times rose 0.17%. Japan 10-year JGB yield rose 0.0121 to 1.075.
US retail sales rises 0.4% mom in Oct, ex-auto sales up 0.1% mom
US retails sales rose 0.4% mom to USD 718.9B in October, above expectation of 0.3% mom. However, ex-auto sales rose 0.1% mom to US 528.5B, below expectation of 0.2% mom. Ex-gasoline sales rose 0.4% mom to USD 667.1B. Ex-auto & gasoline sales rose 0.1% mom to 621.6B.
Total sales for the August through October period were up 2.3% yoy from the same period a year ago.
Fed's Collins: December rate cut not guaranteed
Boston Fed President Susan Collins signaled in a WSJ interview that a rate cut in December is "certainly on the table. However, it remains far from being a "done deal".
She emphasized the importance of upcoming economic data in shaping the Fed’s decision-making process, noting, “There’s more data that we will see between now and December, and we’ll have to continue to weigh what makes sense.”
Collins underlined her pragmatic approach, explaining, “I don’t see an argument for maintaining restrictive policy when there is not evidence of new price pressures.”
However, she also acknowledged that the inflationary dynamics that have persisted over the past year are "perhaps unevenly and gradually resolving over time."
European Commission forecasts modest recovery and faster disinflation for Eurozone
The European Commission maintains its projection for Eurozone GDP growth at 0.8% in 2024, unchanged from its Spring forecast. However, it has slightly downgraded the 2025 growth projection to 1.3% from the previous 1.4% in Spring forecast, introducing a new projection of 1.6% growth in 2026. For the EU as a whole, GDP is expected to grow by 0.9% in 2024, 1.5% in 2025, and 1.6% in 2026.
Inflation is anticipated to decline significantly. In Eurozone, headline inflation is projected to more than halve from 5.4% in 2023 to 2.4% in 2024, slightly lower than the previous estimate of 2.5%. It is expected to ease further to 2.1% in 2025 and 1.9% in 2026. The EU is forecasted to see an even sharper disinflation, with headline inflation falling from 6.4% in 2023 to 2.6% in 2024, continuing to decrease to 2.4% in 2025 and 2.0% in 2026.
Executive Vice-President Valdis Dombrovskis highlighted that the EU economy is steadily recovering, with growth expected to gain momentum next year. Factors contributing to this acceleration include rising consumption driven by increased purchasing power, sustained record-low unemployment, and anticipated improvements in investment levels.
European Commissioner for Economy Paolo Gentiloni noted that as inflation continues to ease and private consumption and investment growth pick up, supported by unemployment at record lows, growth is set to gradually accelerate over the next two years.
UK GDP shrinks -0.1% mom in Sep; Q3 growth slows sharply to 0.1% qoq
UK economy contracted by -0.1% mom in September, falling short of market expectations for 0.2% mom growth. The contraction was driven largely by declines in manufacturing output and information and communication services, with monthly services output showing no growth. Meanwhile, production sector experienced a notable -0.5% drop, primarily due to a sharp decline in manufacturing. Construction output offered a slight silver lining, rising by 0.1%.
For Q3, GDP grew by a marginal 0.1% qoq, marking a steep slowdown from Q2’s 0.5% qoq growth and missing forecasts of 0.2% qoq. The services sector, which accounts for the largest share of economic activity, expanded by just 0.1%, while construction demonstrated resilience with a 0.8% increase. However, the production sector contracted by -0.2%, reflecting persistent weaknesses in the industrial base.
Japan's real GDP growth slows to 0.9% annualized, robust consumption but weak investment
Japan's economy expanded by 0.2% qoq in Q3 2024, aligning with market expectations but indicating a slowdown from the previous quarter's momentum. On an annualized basis, GDP grew by 0.9%, surpassing the anticipated 0.7%, yet decelerating from a downwardly revised 2.2% growth in Q2.
The second straight quarter of expansion was largely propelled by robust private consumption, which accounts for over half of the nation's GDP. Private consumption increased by 0.9% qoq, up from revised 0.7% in the prior quarter, driven by solid demand for automobiles and the influence of wage increases. Despite persistent high inflation, consumers are channeling funds into spending as a result of wage gains.
However, the economy faces challenges as capital investment declined by -0.2% qoq after previous growth, reflecting the impact of a global economic slowdown on sectors like chipmaking equipment. Exports inched up by 0.4% qoq, indicating some resilience in external demand. In contrast, imports surged by 2.1% qoq, which negatively affected GDP by subtracting 0.4 percentage points from growth.
China's industrial growth and investment lag, while retail sales outperform in Oct
China’s economic data for October showed a mixed performance, with retail sales surpassing expectations while industrial production and fixed asset investment slightly underperformed.
Industrial production grew by 5.3% yoy, just shy of the expected 5.4% yoy and holding steady from the prior month. Fixed asset investment also slowed, increasing by 3.4% ytd yoy compared to the forecasted 3.5%.
Real estate investment continued to struggle, declining by -10.3% from the previous year’s level over the January-October period, marking the sharpest annualized contraction since August 2021. This steeper drop reflects ongoing pressures in China’s real estate sector.
In contrast, retail sales surged 4.8% yoy, beating expectations of 3.8% yoy and accelerating from September’s 3.2% yoy. This stronger retail activity was largely driven by a week-long national holiday and an early start to the Singles' Day shopping festival, which boosted consumer spending.
NZ BNZ manufacturing falls to 45.8, further contraction but new orders show signs of recovery
New Zealand’s BusinessNZ Performance of Manufacturing Index dropped from 47.0 to 45.8 in, marking its lowest point since July and extending the sector's contraction for a 20th straight month. The reading underscores continued struggles in the manufacturing sector, despite recent RBNZ rate cuts.
A breakdown of the report reveals broad weakness across production and employment indicators, with production slipping from 47.9 to 44.5, and employment declining from 46.8 to 45.8. Deliveries also fell to 44.6 from 45.6, and finished stocks modestly increased to 47.4. However, new orders provided a rare bright spot, rising from 47.9 to 49.0, the highest level since May 2023.
Encouragingly, the proportion of negative comments from respondents fell to 53.5% in October, a marked improvement from the previous months, where negative sentiment had peaked at 76.3% in June.
BNZ’s Senior Economist Doug Steel noted, “Despite lower interest rates, the manufacturing sector continues to face significant headwinds. Recent business surveys show a sharp contrast between improved expectations for activity and weak current conditions.”
EUR/USD Mid-Day Outlook
Daily Pivots: (S1) 1.0490; (P) 1.0536; (R1) 1.0576; More...
Intraday bias in EUR/USD stays neutral for consolidations above 1.0495 temporary low. But outlook will remain bearish as long as 1.0760 support turned resistance holds. On the downside, firm break of 100% projection of 1.1213 to 1.0760 from 1.0936 at 1.0483 will target 1.0404 key fibonacci level next.
In the bigger picture, price actions from 1.1274 (2023 high) are seen as a consolidation pattern to up trend from 0.9534 (2022 low), with fall from 1.1213 as the third leg. Downside should be contained by 50% retracement of 0.9534 (2022 low) to 1.1274 at 1.0404, to bring up trend resumption at a later stage.
US retail sales rises 0.4% mom in Oct, ex-auto sales up 0.1% mom
US retails sales rose 0.4% mom to USD 718.9B in October, above expectation of 0.3% mom. However, ex-auto sales rose 0.1% mom to US 528.5B, below expectation of 0.2% mom. Ex-gasoline sales rose 0.4% mom to USD 667.1B. Ex-auto & gasoline sales rose 0.1% mom to 621.6B.
Total sales for the August through October period were up 2.3% yoy from the same period a year ago.
Fed’s Collins: December rate cut not guaranteed
Boston Fed President Susan Collins signaled in a WSJ interview that a rate cut in December is "certainly on the table. However, it remains far from being a "done deal".
She emphasized the importance of upcoming economic data in shaping the Fed’s decision-making process, noting, “There’s more data that we will see between now and December, and we’ll have to continue to weigh what makes sense.”
Collins underlined her pragmatic approach, explaining, “I don’t see an argument for maintaining restrictive policy when there is not evidence of new price pressures.”
However, she also acknowledged that the inflationary dynamics that have persisted over the past year are "perhaps unevenly and gradually resolving over time."