
Sample Category Title
EUR/JPY Weekly Outlook
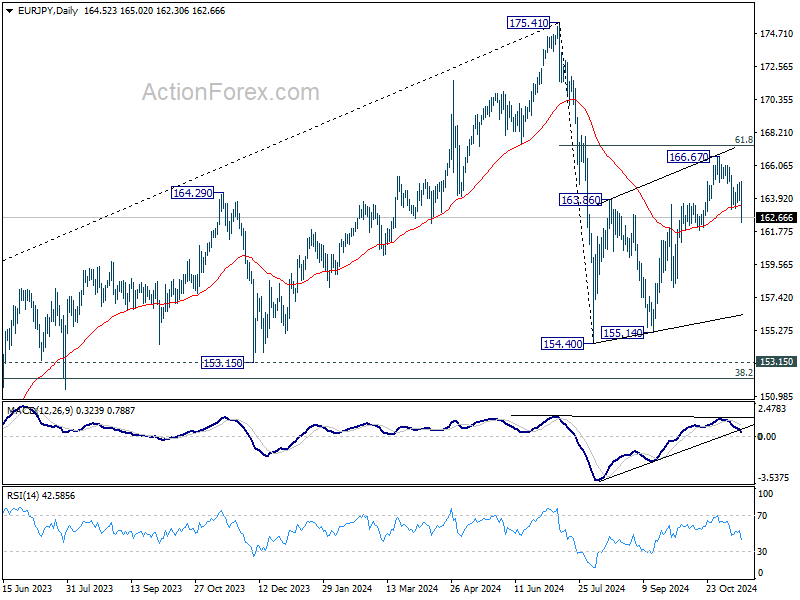
EUR/JPY's fall from 166.67 continued last week after interim recovery. The break of 55 D EMA (now at 163.41) argues that corrective rebound from 154.40 has completed with three waves up to 166.67. That came after rejection by 61.8% retracement of 175.41 to 154.40 at 167.38. Initial bias is now on the downside this week for 155.14 support next. For now, risk will stay on the downside as long as 165.02 resistance holds, in case of recovery.
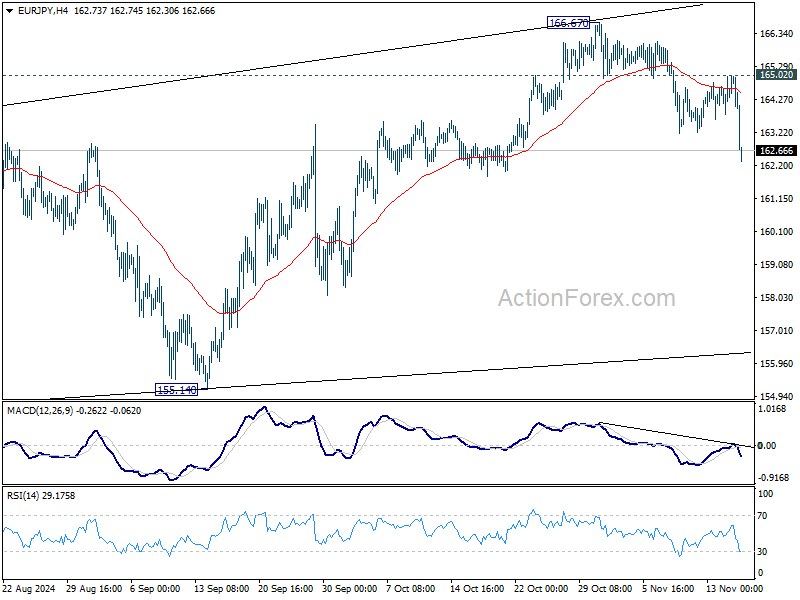
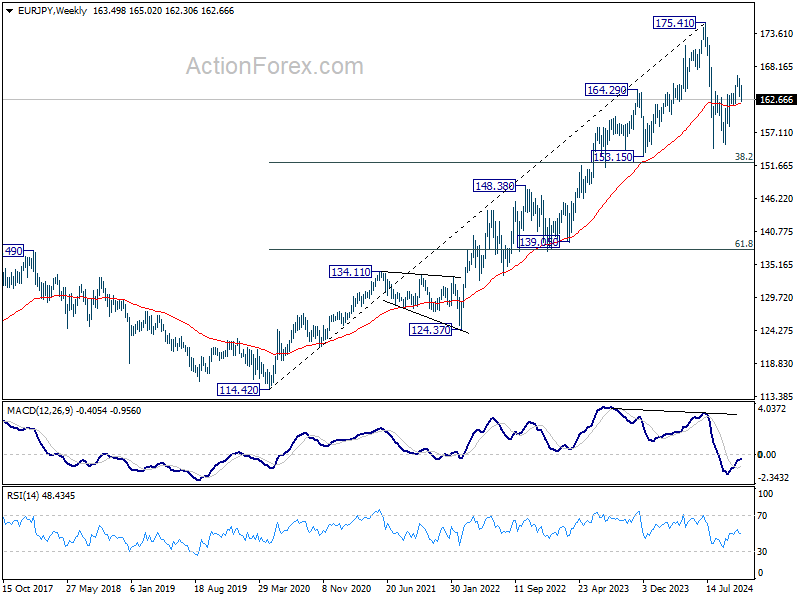
In the bigger picture, price actions from 175.41 are seen as correction to rally from 114.42 (2020 low). The range of consolidation should have been set between 38.2% retracement of 114.42 to 175.41 at 152.11 and 175.41 high. However, decisive break of 152.11 would argue that deeper correction is underway.
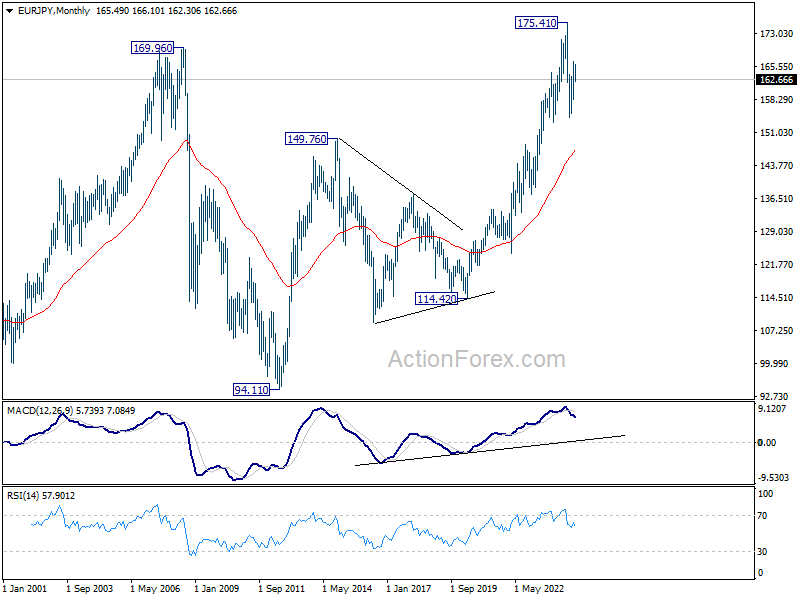
In the long term picture, considering bearish divergence condition in W MACD, 175.41 is at least a medium term top. It's still early to conclude that up trend from 94.11 (2012 low) has completed. But a medium term corrective phase is in progress with risk of deeper fall back to 55 M EMA (now at 147.33).
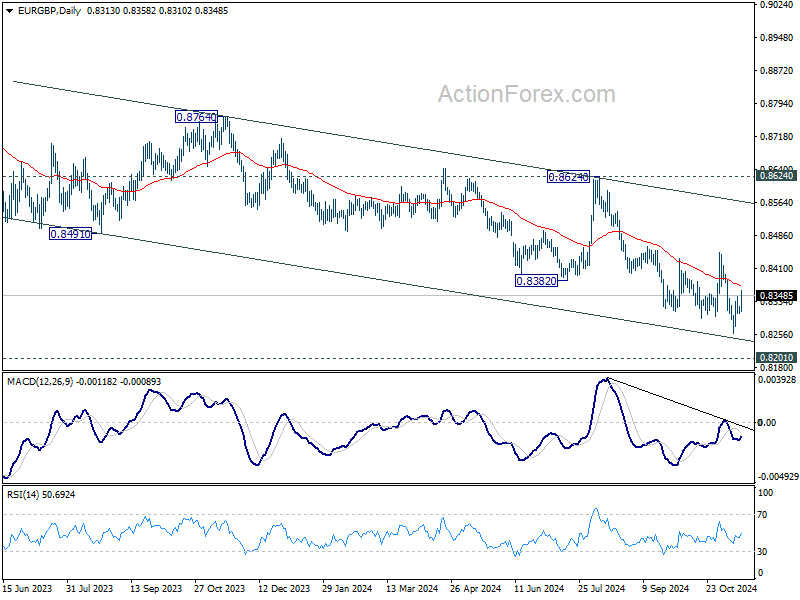
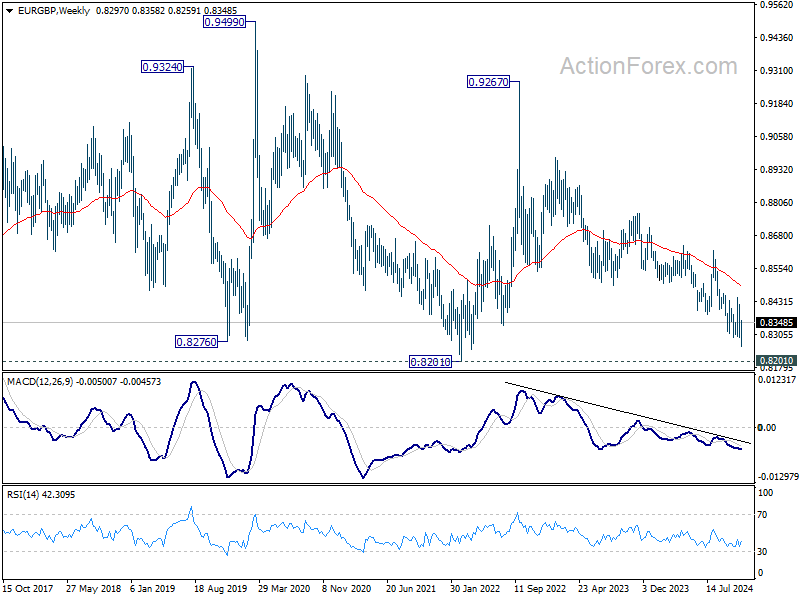
EUR/GBP Weekly Outlook
EUR/GBP edged lower to 0.8259 last week but recovered since then. Initial bias remains neutral this week and outlook stay bearish as long as 0.8446 resistance holds. On the downside, below 0.8306 minor support will turn bias back to the downside for 0.8259 first, and then 0.8201 key support. Nevertheless, firm break of 0.8446 will confirm short term bottoming.
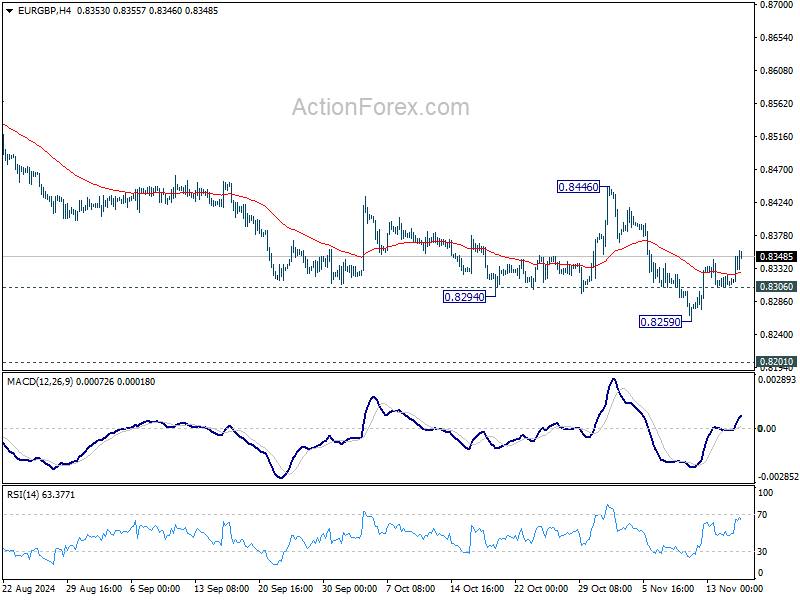
In the bigger picture, down trend from 0.9267 (2022 high) is in progress. Next target is 0.8201 (2022 low), but strong support should be seen there to bring rebound. However, outlook will remain bearish as long as 0.8624 resistance holds even in case of strong rebound. Decisive break of 0.8201 will indicate long term bearish reversal.
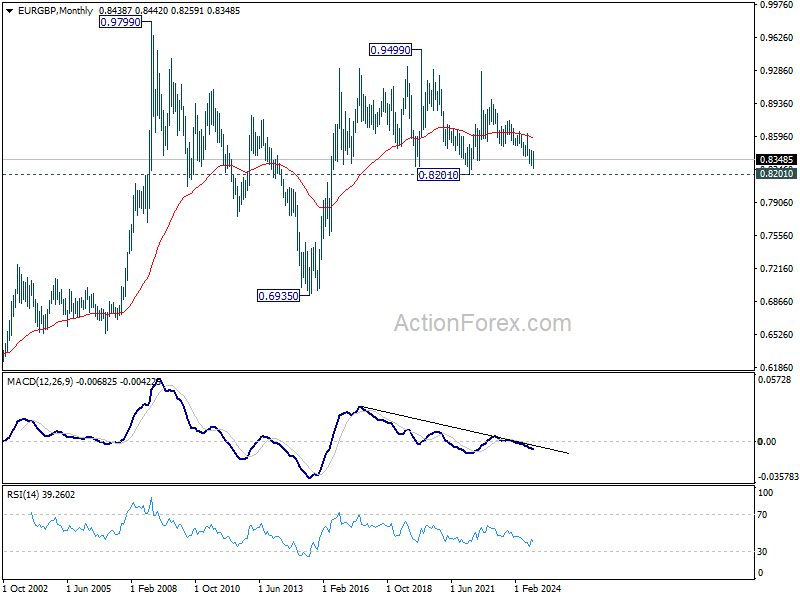
In the long term picture, price action from 0.9499 (2020 high) is seen as part of the long term range pattern from 0.9799 (2008 high). Range trading should continue between 0.8201 and 0.9499, until there is clear signal of imminent breakout.
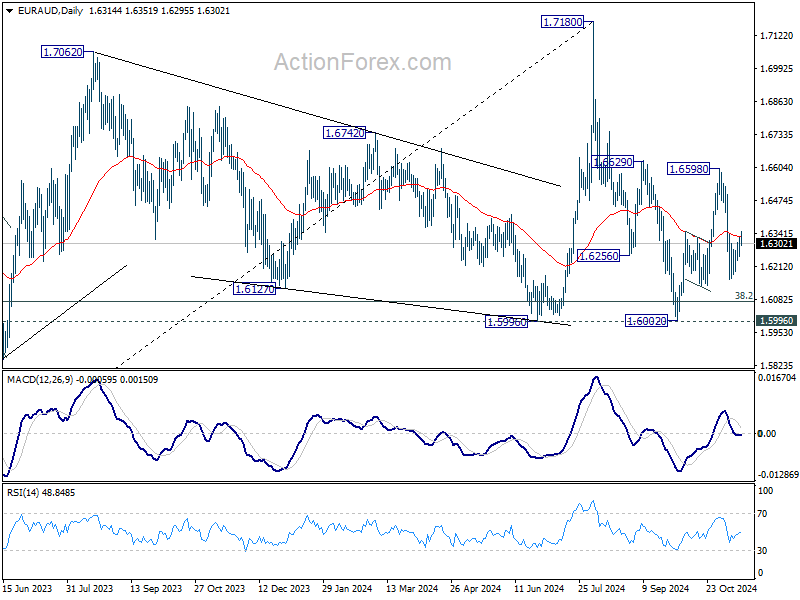
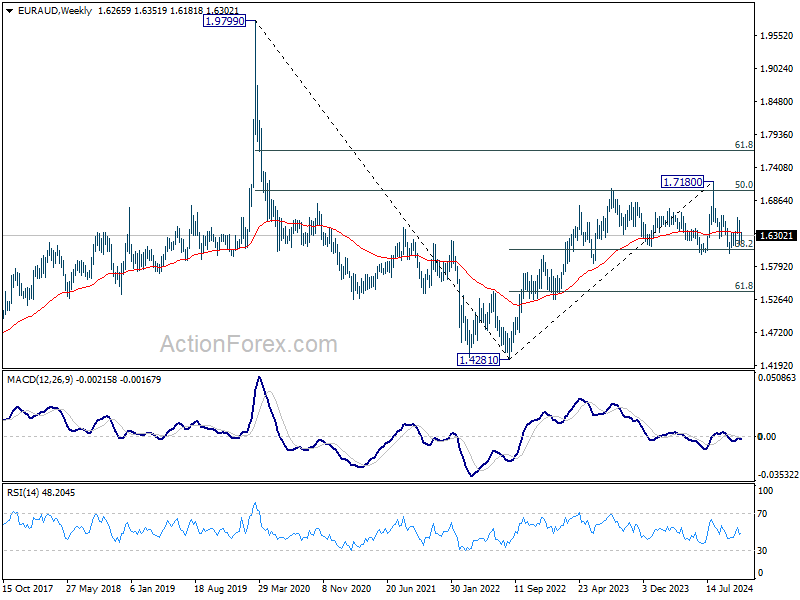
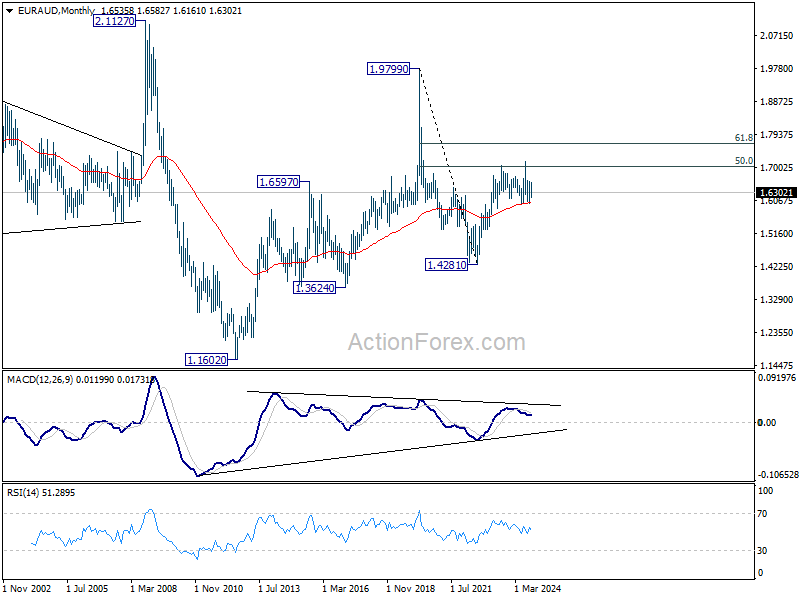
EUR/AUD Weekly Outlook
EURAUD stayed in consolidation above 1.6161 last week and outlook is unchanged. Initial bias remains neutral this week and further fall is expected with 1.6598 resistance intact. On the downside, below 1.6161 will target a test on 1.5996/6002 key support zone.
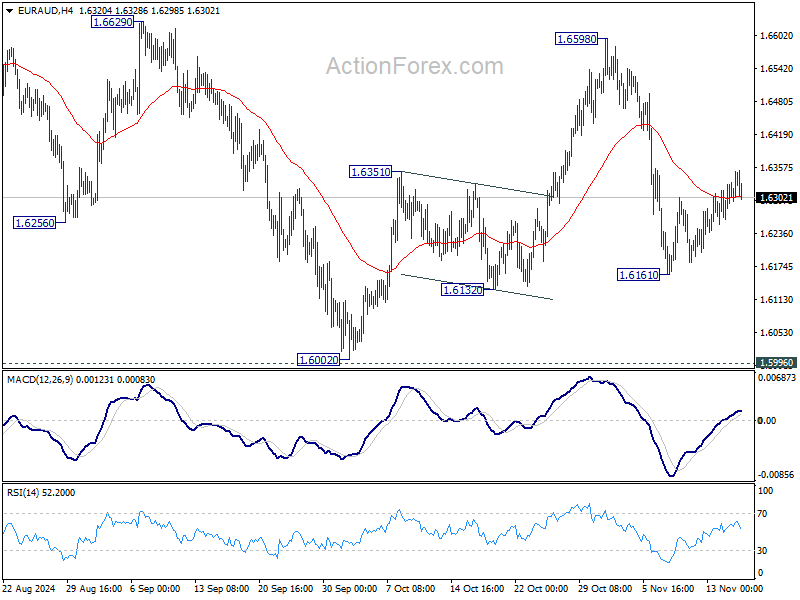
In the bigger picture, as long as 1.5996 support holds, up trend from 1.4281 (2022 low) is still expected to resume through 1.7180 at a later stage. However decisive break of 1.5996 will argue that the medium term trend might have reversed. Deeper fall would be seen to 61.8% retracement of 1.4281 (2022 low) to 1.7180 at 1.5388, even as a correction.
In the longer term picture, rise from 1.4281 is seen as the second leg of the pattern from 1.9799 (2020 high), which is part of the pattern from 2.1127 (2008 high). As long as 55 M EMA (now at 1.6032) holds, this second leg could still extend higher. However, sustained trading below 55 M EMA will open up the bearish case for extending the decline through 1.4281 low.
EUR/CHF Weekly Outlook
EUR/CHF still didn't succeed in breaking out of converging range last week and outlook is unchanged. Initial bias remains neutral this week first. On the downside, break of 0.9331 will target 0.9305 support first. Firm break there will bring retest of 0.9209 low. On the upside, break of 0.9444 will bring stronger rally to 0.9506 resistance next.
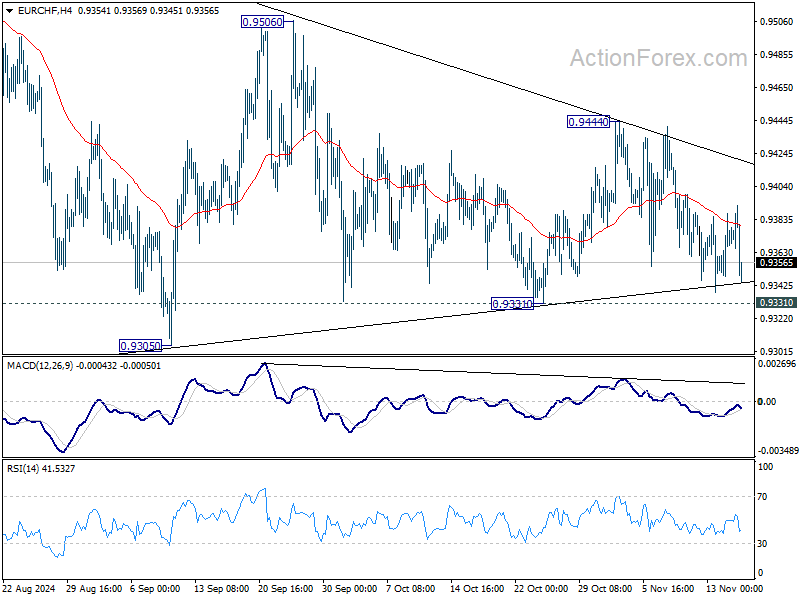
In the bigger picture, fall from 0.9928 is seen as part of the long term down trend. Repeated rejection by 55 D EMA (now at 0.9410) keeps outlook bearish for breaking through 0.9209 low at a later stage. Nevertheless, sustained trading above 55 D EMA will confirm medium term bottoming at 0.9209 and bring stronger rebound back towards 0.9928 key resistance.
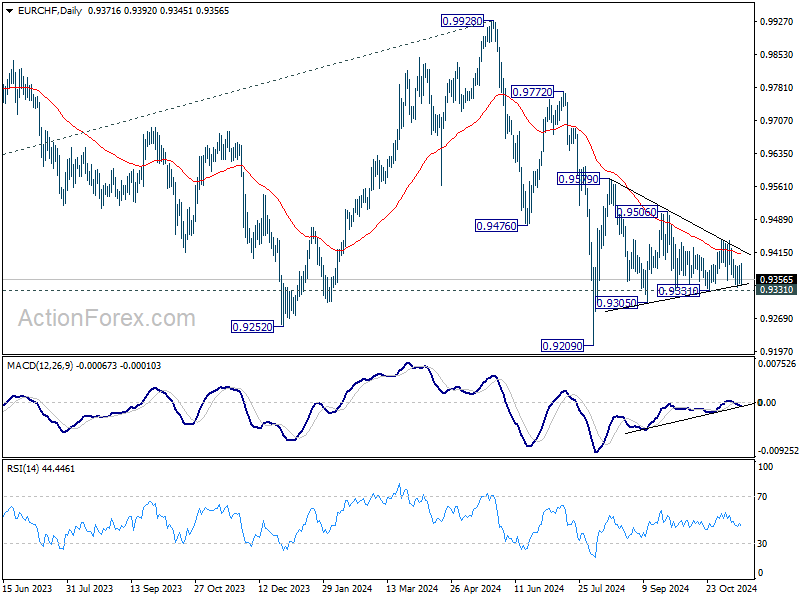
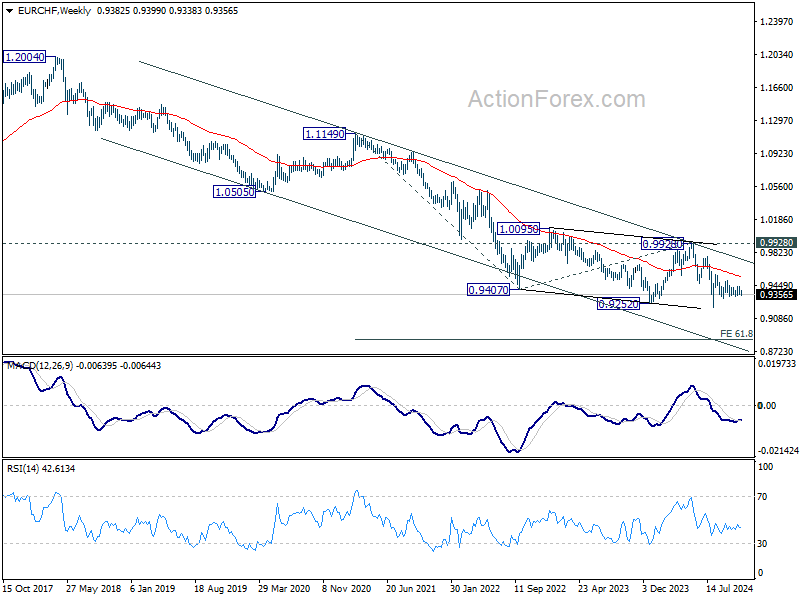
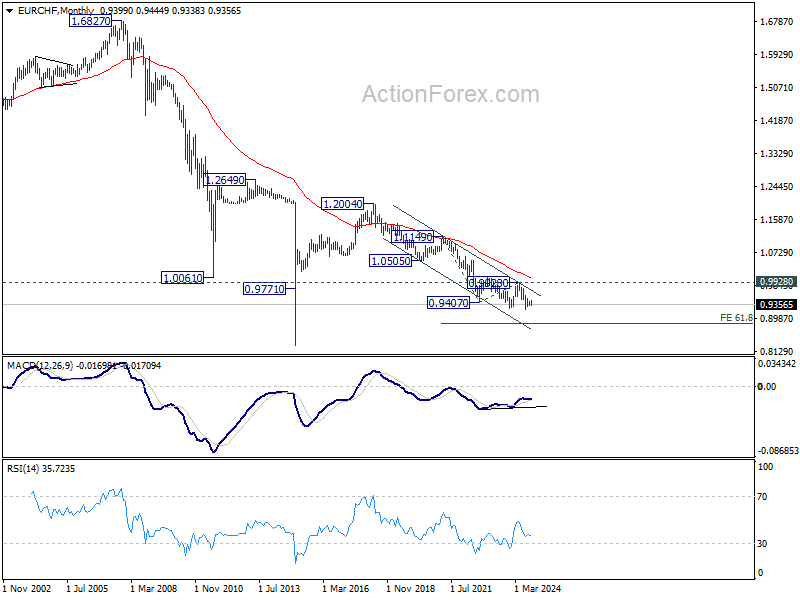
In the long term picture, fall from 1.2004 (2018 high) is part of the multi-decade down trend. Corrective pattern from 0.9407 (2022 low) might have completed with three waves to 0.9928. Decisive break of 0.9252 (2023 low) will confirm long term down trend resumption to 61.8% projection of 1.1149 to 0.9407 from 0.9928 at 0.8851. For now, outlook will stay bearish as long as 0.9928 resistance holds, even in case of strong rebound.
Summary 11/18 – 11/22
Monday, Nov 18, 2024
| GMT | Ccy | Events | Consensus | Previous |
|---|---|---|---|---|
| 21:30 | NZD | Business NZ PSI Oct | 45.7 | |
| 21:45 | NZD | PPI Input Q/Q Q3 | 1.00% | 1.40% |
| 21:45 | NZD | PPI Output Q/Q Q3 | 0.90% | 1.10% |
| 23:50 | JPY | Machinery Orders M/M Sep | 1.40% | -1.90% |
| 10:00 | EUR | Eurozone Trade Balance (EUR) Sep | 7.9B | 11.0B |
| 13:15 | CAD | Housing Starts Y/Y Oct | 239K | 224K |
| 15:00 | USD | NAHB Housing Market Index Nov | 42 | 43 |
| GMT | Ccy | Events | |
|---|---|---|---|
| 21:30 | NZD | Business NZ PSI Oct | |
| Forecast: | Previous: 45.7 | ||
| 21:45 | NZD | PPI Input Q/Q Q3 | |
| Forecast: 1.00% | Previous: 1.40% | ||
| 21:45 | NZD | PPI Output Q/Q Q3 | |
| Forecast: 0.90% | Previous: 1.10% | ||
| 23:50 | JPY | Machinery Orders M/M Sep | |
| Forecast: 1.40% | Previous: -1.90% | ||
| 10:00 | EUR | Eurozone Trade Balance (EUR) Sep | |
| Forecast: 7.9B | Previous: 11.0B | ||
| 13:15 | CAD | Housing Starts Y/Y Oct | |
| Forecast: 239K | Previous: 224K | ||
| 15:00 | USD | NAHB Housing Market Index Nov | |
| Forecast: 42 | Previous: 43 | ||
Tuesday, Nov 19, 2024
| GMT | Ccy | Events | Consensus | Previous |
|---|---|---|---|---|
| 00:30 | AUD | RBA Meeting Minutes | ||
| 07:00 | CHF | Trade Balance (CHF) Oct | 4.25B | 4.95B |
| 09:00 | EUR | Eurozone Current Account (EUR) Sep | 27.0B | 31.5B |
| 10:00 | EUR | Eurozone CPI Y/Y Oct F | 2.00% | 2.00% |
| 10:00 | EUR | Eurozone CPI Core Y/Y Oct F | 2.70% | 2.70% |
| 13:30 | USD | Building Permits Oct | 1.44M | 1.43M |
| 13:30 | USD | Housing Starts Oct | 1.34M | 1.35M |
| 13:30 | CAD | CPI M/M Oct | 0.30% | -0.40% |
| 13:30 | CAD | CPI Y/Y Oct | 1.90% | 1.60% |
| 13:30 | CAD | CPI Median Y/Y Oct | 2.20% | 2.30% |
| 13:30 | CAD | CPI Trimmed Y/Y Oct | 2.40% | 2.40% |
| 13:30 | CAD | CPI Common Y/Y Oct | 2.10% | 2.10% |
| 23:50 | JPY | Trade Balance (JPY) Oct | -0.15T | -0.19T |
| GMT | Ccy | Events | |
|---|---|---|---|
| 00:30 | AUD | RBA Meeting Minutes | |
| Forecast: | Previous: | ||
| 07:00 | CHF | Trade Balance (CHF) Oct | |
| Forecast: 4.25B | Previous: 4.95B | ||
| 09:00 | EUR | Eurozone Current Account (EUR) Sep | |
| Forecast: 27.0B | Previous: 31.5B | ||
| 10:00 | EUR | Eurozone CPI Y/Y Oct F | |
| Forecast: 2.00% | Previous: 2.00% | ||
| 10:00 | EUR | Eurozone CPI Core Y/Y Oct F | |
| Forecast: 2.70% | Previous: 2.70% | ||
| 13:30 | USD | Building Permits Oct | |
| Forecast: 1.44M | Previous: 1.43M | ||
| 13:30 | USD | Housing Starts Oct | |
| Forecast: 1.34M | Previous: 1.35M | ||
| 13:30 | CAD | CPI M/M Oct | |
| Forecast: 0.30% | Previous: -0.40% | ||
| 13:30 | CAD | CPI Y/Y Oct | |
| Forecast: 1.90% | Previous: 1.60% | ||
| 13:30 | CAD | CPI Median Y/Y Oct | |
| Forecast: 2.20% | Previous: 2.30% | ||
| 13:30 | CAD | CPI Trimmed Y/Y Oct | |
| Forecast: 2.40% | Previous: 2.40% | ||
| 13:30 | CAD | CPI Common Y/Y Oct | |
| Forecast: 2.10% | Previous: 2.10% | ||
| 23:50 | JPY | Trade Balance (JPY) Oct | |
| Forecast: -0.15T | Previous: -0.19T | ||
Wednesday, Nov 20 2024
| GMT | Ccy | Events | Consensus | Previous |
|---|---|---|---|---|
| 01:00 | CNY | PBoC 1-Y Loan Prime Rate | 3.10% | 3.10% |
| 01:00 | CNY | PBoC 5-Y Loan Prime Rate | 3.60% | 3.60% |
| 07:00 | EUR | Germany PPI M/M Oct | -0.10% | -0.50% |
| 07:00 | EUR | Germany PPI Y/Y Oct | -1.10% | -1.40% |
| 07:00 | GBP | CPI M/M Oct | 0% | |
| 07:00 | GBP | CPI Y/Y Oct | 2.20% | 1.70% |
| 07:00 | GBP | Core CPI Y/Y Oct | 3.20% | 3.20% |
| 07:00 | GBP | RPI M/M Oct | -0.30% | |
| 07:00 | GBP | PPI Input M/M Oct | -1% | |
| 07:00 | GBP | PPI Input Y/Y Oct | -2.30% | |
| 07:00 | GBP | PPI Output M/M Oct | -0.50% | |
| 07:00 | GBP | PPI Output Y/Y Oct | -0.70% | |
| 07:00 | GBP | PPI Core Output M/M Oct | 0% | |
| 07:00 | GBP | PPI Core Output Y/Y Oct | 1.40% | |
| 15:30 | USD | Crude Oil Inventories | 2.1M |
| GMT | Ccy | Events | |
|---|---|---|---|
| 01:00 | CNY | PBoC 1-Y Loan Prime Rate | |
| Forecast: 3.10% | Previous: 3.10% | ||
| 01:00 | CNY | PBoC 5-Y Loan Prime Rate | |
| Forecast: 3.60% | Previous: 3.60% | ||
| 07:00 | EUR | Germany PPI M/M Oct | |
| Forecast: -0.10% | Previous: -0.50% | ||
| 07:00 | EUR | Germany PPI Y/Y Oct | |
| Forecast: -1.10% | Previous: -1.40% | ||
| 07:00 | GBP | CPI M/M Oct | |
| Forecast: | Previous: 0% | ||
| 07:00 | GBP | CPI Y/Y Oct | |
| Forecast: 2.20% | Previous: 1.70% | ||
| 07:00 | GBP | Core CPI Y/Y Oct | |
| Forecast: 3.20% | Previous: 3.20% | ||
| 07:00 | GBP | RPI M/M Oct | |
| Forecast: | Previous: -0.30% | ||
| 07:00 | GBP | PPI Input M/M Oct | |
| Forecast: | Previous: -1% | ||
| 07:00 | GBP | PPI Input Y/Y Oct | |
| Forecast: | Previous: -2.30% | ||
| 07:00 | GBP | PPI Output M/M Oct | |
| Forecast: | Previous: -0.50% | ||
| 07:00 | GBP | PPI Output Y/Y Oct | |
| Forecast: | Previous: -0.70% | ||
| 07:00 | GBP | PPI Core Output M/M Oct | |
| Forecast: | Previous: 0% | ||
| 07:00 | GBP | PPI Core Output Y/Y Oct | |
| Forecast: | Previous: 1.40% | ||
| 15:30 | USD | Crude Oil Inventories | |
| Forecast: | Previous: 2.1M | ||
Thursday, Nov 21, 2024
| GMT | Ccy | Events | Consensus | Previous |
|---|---|---|---|---|
| 07:00 | GBP | Public Sector Net Borrowing (GBP) Oct | 14.1B | 16.6B |
| 13:30 | CAD | Industrial Product Price Oct | 0.30% | -0.60% |
| 13:30 | CAD | Raw Material Price Index Oct | -1.50% | -3.10% |
| 13:30 | USD | Initial Jobless Claims (Nov 15) | 220K | 217K |
| 15:00 | USD | Existing Home Sales Oct | 3.94M | 3.84M |
| 15:00 | EUR | Eurozone Consumer Confidence Nov P | -12 | -13 |
| 15:30 | USD | Natural Gas Storage | 42B | |
| 22:00 | AUD | Manufacturing PMI Nov P | 47.3 | |
| 22:00 | AUD | Services PMI Nov P | 51 | |
| 23:30 | JPY | National CPI Y/Y Oct | 2.50% | |
| 23:30 | JPY | National CPI Core Y/Y Oct | 2.20% | 2.40% |
| 23:30 | JPY | National CPI Core-Core Y/Y Oct | 2.10% |
| GMT | Ccy | Events | |
|---|---|---|---|
| 07:00 | GBP | Public Sector Net Borrowing (GBP) Oct | |
| Forecast: 14.1B | Previous: 16.6B | ||
| 13:30 | CAD | Industrial Product Price Oct | |
| Forecast: 0.30% | Previous: -0.60% | ||
| 13:30 | CAD | Raw Material Price Index Oct | |
| Forecast: -1.50% | Previous: -3.10% | ||
| 13:30 | USD | Initial Jobless Claims (Nov 15) | |
| Forecast: 220K | Previous: 217K | ||
| 15:00 | USD | Existing Home Sales Oct | |
| Forecast: 3.94M | Previous: 3.84M | ||
| 15:00 | EUR | Eurozone Consumer Confidence Nov P | |
| Forecast: -12 | Previous: -13 | ||
| 15:30 | USD | Natural Gas Storage | |
| Forecast: | Previous: 42B | ||
| 22:00 | AUD | Manufacturing PMI Nov P | |
| Forecast: | Previous: 47.3 | ||
| 22:00 | AUD | Services PMI Nov P | |
| Forecast: | Previous: 51 | ||
| 23:30 | JPY | National CPI Y/Y Oct | |
| Forecast: | Previous: 2.50% | ||
| 23:30 | JPY | National CPI Core Y/Y Oct | |
| Forecast: 2.20% | Previous: 2.40% | ||
| 23:30 | JPY | National CPI Core-Core Y/Y Oct | |
| Forecast: | Previous: 2.10% | ||
Friday, Nov 22, 2024
| GMT | Ccy | Events | Consensus | Previous |
|---|---|---|---|---|
| 00:30 | JPY | Manufacturing PMI Nov P | 49.5 | 49.2 |
| 00:30 | JPY | Services PMI Nov P | 49.7 | |
| 07:00 | EUR | Germany GDP Q/Q Q3 F | 0.20% | 0.20% |
| 07:00 | GBP | Retail Sales M/M Oct | -0.30% | 0.30% |
| 08:15 | EUR | France Manufacturing PMI Nov P | 44.6 | 44.5 |
| 08:15 | EUR | France Services PMI Nov P | 49 | 49.2 |
| 08:30 | EUR | Germany Manufacturing PMI Nov P | 43.1 | 43 |
| 08:30 | EUR | Germany Services PMI Nov P | 51.8 | 51.6 |
| 09:00 | EUR | Eurozone Manufacturing PMI Nov P | 46 | 46 |
| 09:00 | EUR | Eurozone Services PMI Nov P | 51.6 | 51.6 |
| 09:30 | GBP | Manufacturing PMI Nov P | 50.1 | 49.9 |
| 09:30 | GBP | Services PMI Nov P | 52.3 | 52 |
| 13:30 | CAD | Retail Sales M/M Sep | 0.30% | 0.40% |
| 13:30 | CAD | Retail Sales ex Autos M/M Sep | -0.50% | -0.70% |
| 13:30 | CAD | New Housing Price Index M/M Oct | 0.10% | 0.00% |
| 14:45 | USD | Manufacturing PMI Nov P | 48.5 | |
| 14:45 | USD | Services PMI Nov P | 55 | |
| 15:00 | USD | Michigan Consumer Sentiment Nov F | 73 | 73 |
| GMT | Ccy | Events | |
|---|---|---|---|
| 00:30 | JPY | Manufacturing PMI Nov P | |
| Forecast: 49.5 | Previous: 49.2 | ||
| 00:30 | JPY | Services PMI Nov P | |
| Forecast: | Previous: 49.7 | ||
| 07:00 | EUR | Germany GDP Q/Q Q3 F | |
| Forecast: 0.20% | Previous: 0.20% | ||
| 07:00 | GBP | Retail Sales M/M Oct | |
| Forecast: -0.30% | Previous: 0.30% | ||
| 08:15 | EUR | France Manufacturing PMI Nov P | |
| Forecast: 44.6 | Previous: 44.5 | ||
| 08:15 | EUR | France Services PMI Nov P | |
| Forecast: 49 | Previous: 49.2 | ||
| 08:30 | EUR | Germany Manufacturing PMI Nov P | |
| Forecast: 43.1 | Previous: 43 | ||
| 08:30 | EUR | Germany Services PMI Nov P | |
| Forecast: 51.8 | Previous: 51.6 | ||
| 09:00 | EUR | Eurozone Manufacturing PMI Nov P | |
| Forecast: 46 | Previous: 46 | ||
| 09:00 | EUR | Eurozone Services PMI Nov P | |
| Forecast: 51.6 | Previous: 51.6 | ||
| 09:30 | GBP | Manufacturing PMI Nov P | |
| Forecast: 50.1 | Previous: 49.9 | ||
| 09:30 | GBP | Services PMI Nov P | |
| Forecast: 52.3 | Previous: 52 | ||
| 13:30 | CAD | Retail Sales M/M Sep | |
| Forecast: 0.30% | Previous: 0.40% | ||
| 13:30 | CAD | Retail Sales ex Autos M/M Sep | |
| Forecast: -0.50% | Previous: -0.70% | ||
| 13:30 | CAD | New Housing Price Index M/M Oct | |
| Forecast: 0.10% | Previous: 0.00% | ||
| 14:45 | USD | Manufacturing PMI Nov P | |
| Forecast: | Previous: 48.5 | ||
| 14:45 | USD | Services PMI Nov P | |
| Forecast: | Previous: 55 | ||
| 15:00 | USD | Michigan Consumer Sentiment Nov F | |
| Forecast: 73 | Previous: 73 | ||
Markets Weekly Outlook – PMI Data, UK Inflation and the Soft Landing Conundrum
- US Dollar Index rally continues and the impact of a strong US dollar on global markets.
- Examining upcoming PMI data from the Euro Area and UK CPI figures, and their potential market implications.
- Assessing the likelihood of further rate cuts by the Federal Reserve and the Bank of England.
- Providing insights on market trends and potential volatility in the coming week.
Week in Review: Soft Landing in Jeopardy?
A week that promised much is drawing to a somber close. Following two action packed weeks, this week which included US CPI and PPI data was muted in comparison. However, the week was not a waste by any means and provided some valuable insights while at the same time raising some key questions.
The biggest takeaway for the week is, whether or not a soft landing is still on the cards?
An uptick in PPI coupled with rising US Yields and stubborn CPI data have brought the question back to the fore.
In Q3, the chance of a soft-landing went up from 40% to 42%. At the same time, the likelihood of a recession dropped from 30% to 28%, and the chance of stagflation went down from 28% to 27%. The highest probability is for a soft-landing, meaning there’s a greater chance of steady growth over the next year.
The chances for different growth scenarios stayed mostly the same as last quarter. However, the election results have added uncertainty to the economic outlook, which might lead to changes in these chances going forward.
Given the comments by Fed Chair Powell and the history of the Fed, another monetary policy pivot in early 2025 is unlikely. Powell has made it clear that the Fed will gauge the impact of Government policy before making any decisions, which will mean a Q1 or potentially Q2 pivot remains unlikely as markets come to terms with a Trump return to the White House.
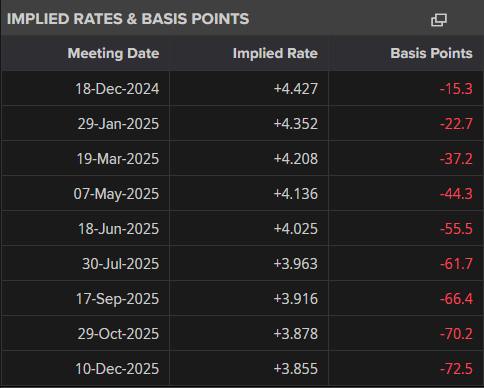
Taking into account all of the above however, market participants do not seem fazed by Fed Chair Powell’s comments. The probabilities and implied rates for 2025 remain muted with less rate cuts the base case, as market participants continue to see increased inflation in the new year. The impact of this continues to be felt by the US Dollar and US Yields in particular both of which have enjoyed bullish weeks.
Markets are now pricing in around 72 bps of rate cuts through December 2025, down from 77 bps on Wednesday. This was down to a rise in US PPI and strong retail sales and NY Fed manufacturing data. Adding fuel to this were some announcements by President elect Trump where he touted some key foreign policy positions to known China Hawks. This will no doubt exacerbate concerns of a more aggressive stance toward China and increase trade war concerns.
Moving forward, these developments might be more important than the pricing of the December meeting where the likelihood of a cut still remains above the 60% mark.
Source: LSEG (click to enlarge)
The surprise of the week came from US Indices with the SPX and Nasdaq 100 giving back the majority of its post election gains. The SPX and Nasdaq 100 are 2.03% and 3.17% down for the week at the time of writing.
The biggest winner of the week was the crypto space with Bitcoin (BTC/USD) roaring to fresh ATH highs around the $93k handle. Markets remain optimistic that President Trump will follow through on his pro-crypto stance with various opinions floating around.
Commodity markets came under strain again this week with rising yields and the DXY pushing Gold down to lows around $2536/oz, as much as 5% down for the week. Oil pisces also struggled to gain any favor as OPEC downgraded their forecasts for a fourth consecutive month. Brent was down around 3% for the week at the time of writing.
All in all a confusing week, one that is likely to keep markets guessing heading into a busy festive season.
The Week Ahead: Muted Week in APAC, PMI Data Rules
Asia Pacific Markets
The week ahead in the Asia Pacific region will see a slowdown with a surprise meeting called by the Bank of Japan (BoJ) likely to be a highlight.
Japan’s data is likely to show that things are slowly getting back to normal after some temporary disruptions. This should lead to better PMI figures. The manufacturing PMI might stay below average, but the services PMI should improve thanks to temporary tax cuts and rising incomes.
Exports are expected to grow by 1.7% compared to last year, following a 1.7% fall in September, while imports might drop by 4.5% due to lower global commodity prices. Inflation is predicted to decrease to 2.3% compared to last year, mainly because of a high base from last year. However, monthly growth should rise to 0.6%, helped by the end of energy subsidies and strong price increases in services.
The surprise may come on Monday however, per a Reuters report BoJ Governor Ueda will deliver a speech and hold a news conference in Nagoya on Monday, the BOJ said, an event (which wasn’t previously scheduled) that will be closely watched by markets for hints on whether it might raise interest rates next month. The comments by Ueda could spark volatility in Yen pairs following a bout of weakness in recent weeks.
In China, data is thin next week. The loan prime rates will be announced on Wednesday, where no change is expected after the People’s Bank of China has so far held rates unchanged this month.
In Australia the highlight of the week will be the RBA minutes scheduled to be released Tuesday. The report could shed some light on the recent RBA meeting and provide insight into rate policy moving forward.
Europe + UK + US
In developed markets, the Euro Area returns with high impact data and more specifically PMI numbers. This is crucial for the Euro Area as growth is now the primary source of concern for the region given the struggle by its manufacturing powerhouse, Germany. The Euro having lost so much ground in recent weeks to the greenback in particular could face renewed selling pressure if a lackluster PMI print is revealed.
In the UK, Q3 GDP showed the UK economy slowed to 0.1% with the economy in September shrinking by -0.1%. This makes the upcoming CPI data even more important and intriguing with the services inflation print in focus once more.
At the start of October, household energy bills went up by about 10%, which means overall inflation might go above 2% again. However, the Bank of England is more concerned with inflation in services which could rise toward 5% once more. ‘Core Services’ inflation is expected to drop significantly from 4.8% to 4.3%. This small detail probably won’t lead to a rate cut in December, but it suggests that the BoE might cut rates more sharply than the 2-3 cuts currently expected over the next few years.
In the US next week markets enjoy a pause on the data front with one high impact release on the agenda. The S&P PMI report will be released on Thursday which should not have a huge impact.
The next important updates will be the core personal consumer spending figures and the crucial November jobs report, coming out in two and three weeks, respectively.
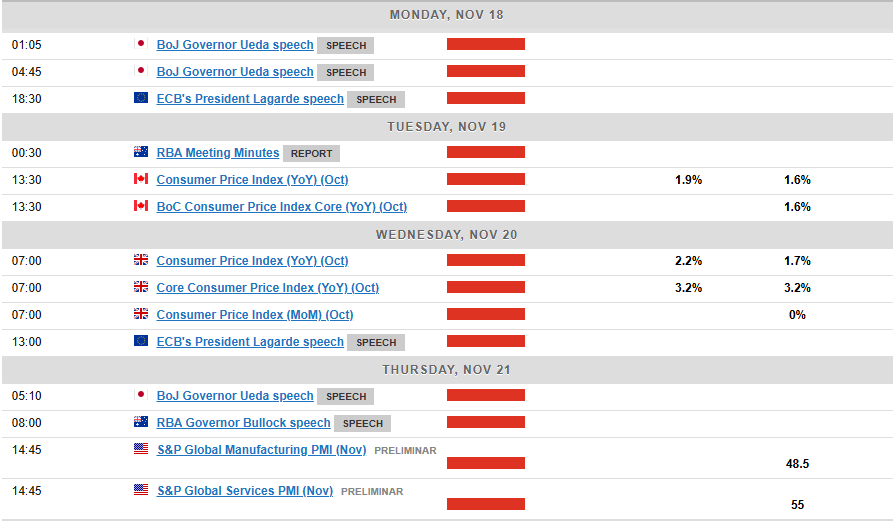
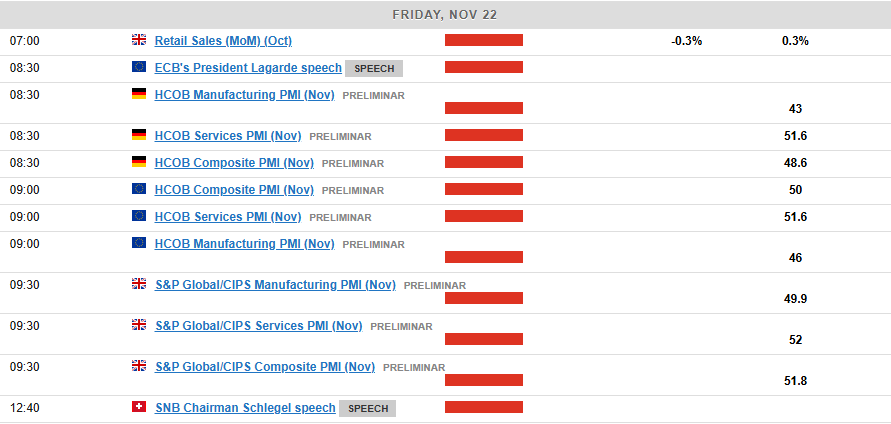
Chart of the Week
This week’s focus remains the US Dollar Index (DXY), which has run into multi-month resistance around 107.00 handle. The DXY has been having an effect across global markets together with US Yields and thus my intrigue into where we could head next.
The DXY chart below and you can see the pink box where price is currently hovering which is a key area of resistance that the index has to navigate. Friday saw a significant pullback in the European session, but US Data later in the day provided USD bulls with renewed impetus.
A break above the 107.00 handle may find resistance at 107.97 with a break above this level bringing 109.52 into focus.
Looking at the downside and immediate support rests around 105.63 before the 105.00 handle and the red box on the chart around 104.50 come into focus.
The DXY has been driving price action in all Dollar denominated instruments and this could continue in the week ahead.
US Dollar Index Daily Chart – November 15, 2024
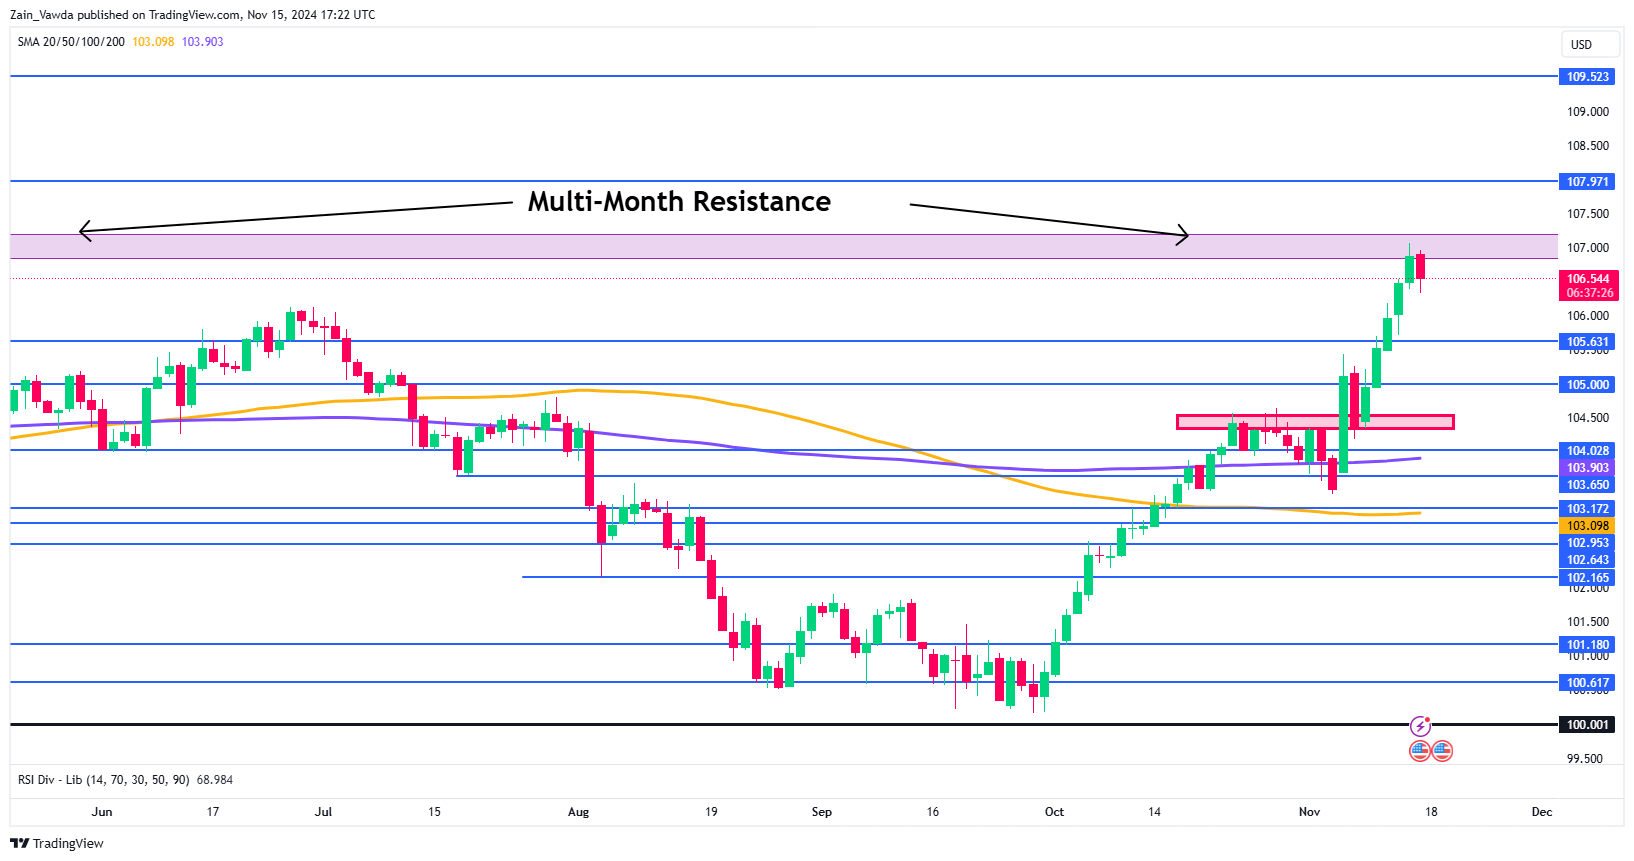
Source:TradingView.Com (click to enlarge)
Key Levels to Consider:
Support
- 105.63
- 105.00
- 104.50
Resistance
- 107.00
- 107.97
- 109.52
The Weekly Bottom Line: Inflation Progress Stalls, Fed in No Hurry to Cut Rates
Canadian Highlights
- Canada continues to digest the implications of last week’s U.S. election result, as interest and exchange rates adjust to expectations for policy changes south of the border.
- Existing home sales came in strong for a second consecutive month, a sign that interest rate cuts are starting to support the housing market.
- Next week, we will see more hard data that should shed light on how inflation and spending fared in October, which will also help inform the Bank of Canada’s December rate decision.
U.S. Highlights
- Progress on the inflation front appears to have stalled. Core CPI inflation held steady in October, while the trend over the past three months has accelerated.
- October retail sales were also solid, putting consumer spending in the fourth quarter on a very solid footing.
- Chair Powell moved markets on Thursday by saying that the Fed may not be in a hurry to cut rates. This sent Treasury yields and the dollar moderately higher, while weighing on equities.
Canada – Home Sales Begin Again
There are weeks where decades happen, and there are weeks that are just weeks. The past seven days fall into the latter, more unremarkable camp, after the U.S. election last week. Everyone, from financial markets, consumers, and heads of state, has been digesting the news as the new U.S. administration shapes up. For Canada, there is still uncertainty about what is to come, leaving most forward-looking indicators in a holding pattern. The TSX is up about 1% since the election, and long-term interest rates continue to hold at relatively low levels, with the Canadian 10-year yield still sitting around 3.2%, near where it was before the election. An exception is the CAD, which is starting to tick down towards 71 cents, the lower level we now expect for it given greater policy divergence between the Bank of Canada and the Federal Reserve.
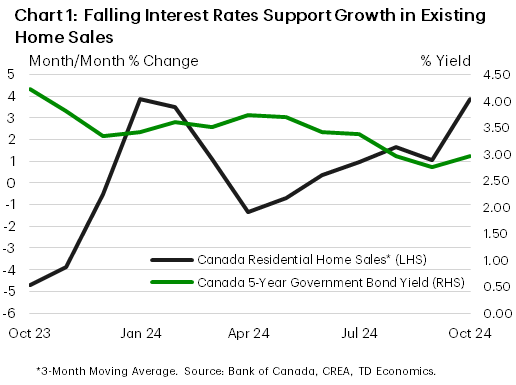
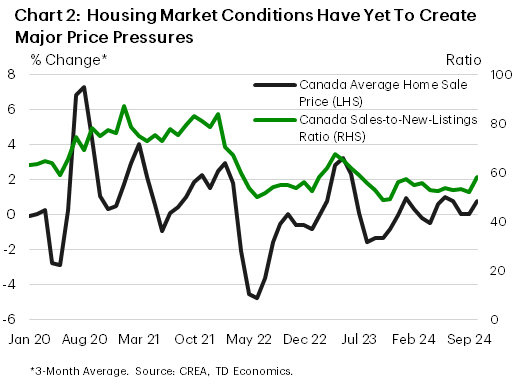
The progress on interest rates over the past few months is starting to be felt in the economy. September’s fairly strong increase in existing home sales was more than repeated in October, where home sales spiked up 7.7% in October after trending significantly lower for most of the year (Chart 1). The relief households have received from lower interest rates is starting to return activity to this market, but it is not yet charging full steam ahead. Despite the uptick in sales, prices are not building rapidly, and the sales-to-new-listings ratio remains well below its pandemic-era peak (Chart 2). The provinces with the greatest affordability challenges, Ontario, and, to a somewhat lesser extent, B.C., still see supply-demand conditions which favours buyers, and that should continue to temper price growth in the near-term, while sales continue to get a lift from lower interest rates.
This is a story we expect to see play out in other sectors as well. In our report yesterday on Ontario’s GDP-by-industry data, we discussed the underperformance of goods-producing sectors this year. This includes the automotive sector, which is weighed down by plant retooling and interest-sensitive consumers. The retail industry in general should see a lift next year as some consumers can take advantage of declining borrowing costs. Of course, it remains a wild card what may happen if the new U.S. government pursues tariffs. This could have a significant impact on the automotive sector, especially as it is now confirmed that the Republican will have control of both Houses of Congress. We discuss the possibilities and some implications for Canada in our report last week after the election.
Next week’s data calendar is a bit more action-packed and will bring our view of Canadian data back into wide focus. We have housing starts early in the week, which should shed additional light on how lower interest rates are passing into the economy, and later in the week retail sales to check in on the consumer. The headliner is October’s inflation data, out on Tuesday, which is a critical data point for the Bank of Canada’s policy decision next month. This should help paint a clearer picture of what the Bank of Canada will do at its December 11th meeting, though at the moment, we think signs point to a 25 bps cut.
U.S. – Inflation Progress Stalls, Fed in No Hurry to Cut Rates
Political developments continued to dominate the limelight this week. Republicans retained a slim majority in the House, cementing control over both chambers of Congress and the Presidency. In the meantime, President-elect Trump is hitting the ground running, announcing cabinet appointments and White House staff positions. The choices reinforce the campaign themes of slower immigration, along with a tougher stance on China and trade. Amidst the political noise, equity markets remained sanguine early in the week, but did lose considerable steam at the end of the week on growing signs that the Fed may not be in a rush to cut rates. Chief among these are signs of slowing progress on the inflation front.
Headline inflation as tracked by the consumer price index (CPI) ticked up in October. Inflation pressures were also a little hot under the collar in the core measure, which rose 0.3% m/m for the third consecutive month. Core inflation held steady at 3.3% on a year-on-year basis in October, but the trend over the past three months heated up (Chart 1). Services inflation is showing signs of stickiness, with price growth for core services holding at 4.8% y/y for the second month in a row. This suggests that after some fast initial progress, the final stage of getting inflation back down to the Fed’s 2% target may indeed be a long slog. Producer prices drove home the same point, with growth in core producer price inflation accelerating to 3.1% y/y in October from 2.9% in the month prior.

These latest inflationary trends are not what the Fed wants to see. At a speech this week, Fed Chair Powell noted that “the economy is not sending any signals that we need to be in a hurry to lower rates”, adding that “the strength we are currently seeing in the economy gives us the ability to approach our decisions carefully”. A relatively healthy October retail sales report released on Friday lends support to that latter point. Helped along by an outsized gain in autos, decent growth in retail sales in October built on a healthy September gain to provide a solid start for consumer spending in the fourth quarter, which looks to be tracking 3.3% annualized, up from a few ticks under 3% previously.
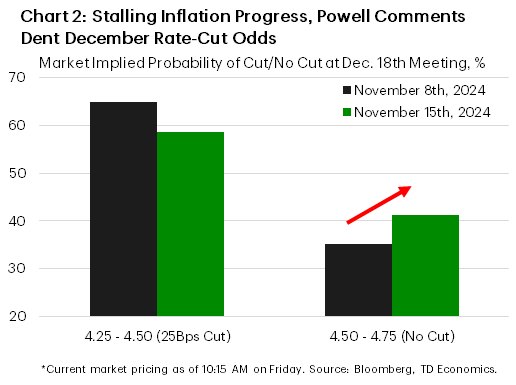
The inflation data, combined with Powell’s comments appeared to move markets, sending yields and the dollar moderately higher, while taking a toll on equities. Market odds for the Fed to take a pause on rate cuts have surged higher in recent days, with a probability of a little over 40% (Chart 2). The next payrolls report should be pivotal for the Fed heading into the December meeting, but given that it may continue to show volatility from one-off factors (i.e., recent hurricanes), the Fed will still have its work cut out for it in trying to ascertain the underlying strength in the labor market.
Next week’s economic calendar sees updates on housing in October, which are not likely to show the impact from the recent upswing in mortgage rates yet. The starts data could be messy due to hurricane impacts, while existing home sales are still expected to be solid.
Weekly Economic & Financial Commentary: Inflation Redux
Summary
United States: Inflation Redux
- The descent in inflation remains slow-going. Stubborn services prices lifted the Consumer Price Index 2.6% annually in October, the first acceleration in this measure since Q1. Sticky inflation does not appear to be fazing consumers, who are heading into the holiday season with solid spending momentum. However, slower progress on inflation may prompt the Fed to reevaluate its pace of easing moving forward.
- Next week: Housing Starts (Tue.), Existing Home Sales (Thu.)
International: Mix of Economic Data from G10 and Emerging Economies
- This week welcomed a slate of economic data from several foreign economies. In the United Kingdom, the economy maintained a slow but positive pace of growth in the third quarter. Japanese GDP growth slowed by less than expected in Q3, which we view as consistent with our view for eventual further Bank of Japan monetary policy normalization. On the emerging economy side, Chinese economic activity data were mixed with some encouraging signs. Last, Mexico's central bank lowered its policy rate by 25 bps to 10.25% and offered some dovish-leaning commentary.
- Next week: Canada CPI (Tue.), Eurozone PMIs (Fri.)
Credit Market Insights: It Ain't Gettin' Any Easier
- Credit card balances continue to rise, and banks are tightening lending standards in the face of elevated borrowing costs. Looking ahead, most banks expect demand for credit cards to strengthen in the next six months due to increased spending needs and a lower use of accumulated savings.
Topic of the Week: Will Lower Rates Usher in a Manufacturing Rebound?
- As the Fed tightened monetary policy to combat the highest inflation in a generation, manufacturing firms were forced to focus on liquidity rather than investing capital as financing costs soared. Manufacturing’s malaise during the higher rate environment of the prior two years begs the question: Will lower rates bring about a rebound?
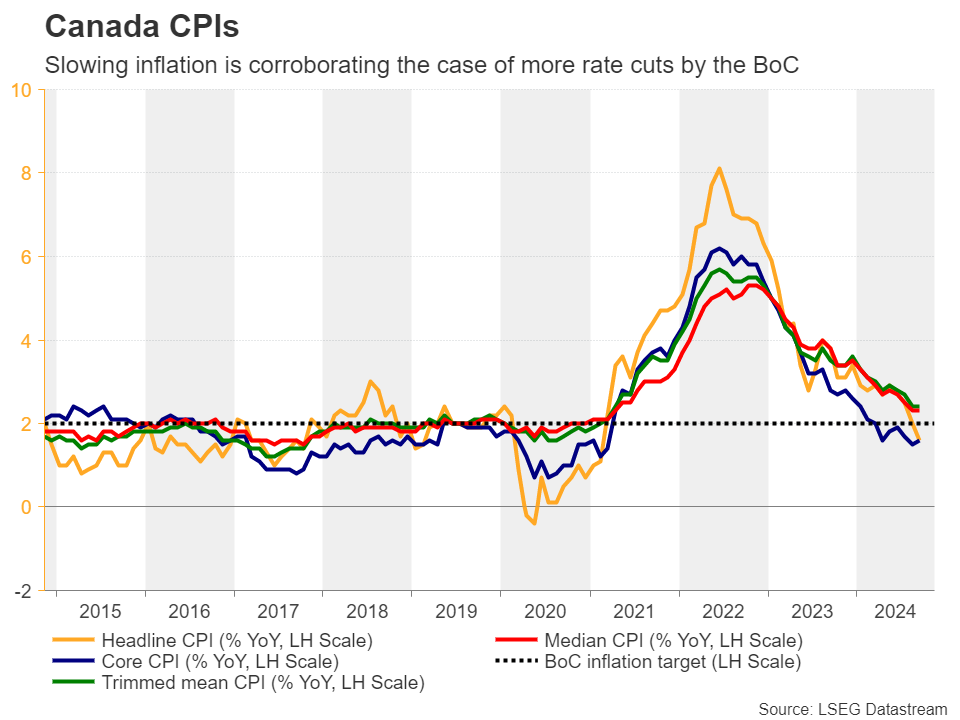
Canadian Inflation in Focus as BoC Considers Additional Rate Cuts
Canada’s inflation report for October will be in the spotlight on Tuesday after falling below the Bank of Canada’s 2% target for the first time since 2021 in September.
Headline inflation likely edged back to 2% from a smaller annual decline in energy prices (-2.8% vs. -8.3% in September). Meanwhile, food price growth likely held steady (2.8% year-over-year in September). Excluding these two volatile components, we look for consumer price index growth to tick lower to 2.2% from 2.4%.
We expect some upward seasonal price moves in categories like clothing and footwear as well as travel tours. Another component to watch for is property taxes and other special charges as this component is released only in October. Last year, it rose by 4.9% month-over-month, and we expect another large increase this year, given major Canadian cities had tax hikes in 2024.
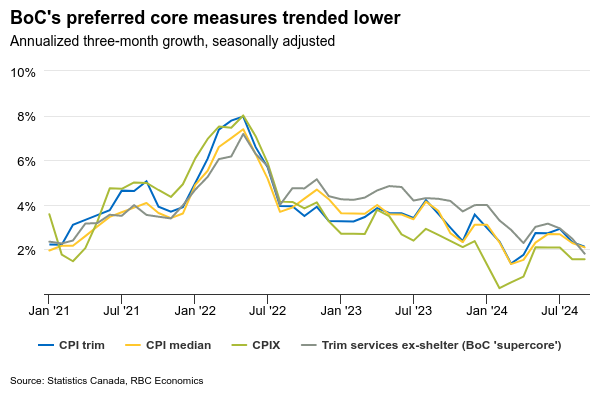
The BoC‘s preferred median and trim core measures (for a better gauge of where inflation is going rather than where it’s been) both likely ticked higher in October on a three-month rolling average. However, they should remain “below 2 ½%” as referenced in the policy statement from the BoC’s October interest rate cut.
We continue to think that inflation is more likely to drift broadly lower in Canada. With a headline inflation forecast of 2% in October, inflation will have hovered around the 2% target for three consecutive months. The diffusion index has also suggested that the breadth of inflation pressures narrowed recently. Meanwhile, labour markets continue to soften with hiring demand (job openings) slowing and the unemployment rate continuing to edge higher. Given the Canadian economy’s weak momentum, we continue to expect the BoC to cut the overnight rate by an additional 50 basis points in December.
Week ahead data watch
- Canadian retail sales likely rose 0.4% in September—the same rate as last month. Core sales likely contributed to most of the headline growth, given auto sales and sales at gas stations declined during the month.
- We expect housing starts at 256,000 in October, up from 224,000 in September.
Week Ahead – Flash PMIs, UK and Canadian CPI Data Enter the Spotlight
- Almighty dollar awaits PMIs for more signs of Fed cut delays
- Eurozone PMIs also on tap amid speculation of bigger cut by ECB
- Pound could benefit from data pointing to rebound in inflation
- Canadian and Japanese CPI numbers also on the agenda
Trump’s election raises bets for a Fed pause
The US dollar continued flexing its muscles for another week, with the so-called ‘Trump trades’ showing no signs of cooling as the president-elect Republican party will control both chambers of the US Congress, which will make it very easy for Donald Trump to turn his pre-election promises into legislation.
The newly elected US president has been advocating for massive corporate tax cuts and tariffs on imported goods from around the globe, especially China, measures that are seen by the financial community as fueling inflation and thereby prompting the Fed to delay future rate reductions.
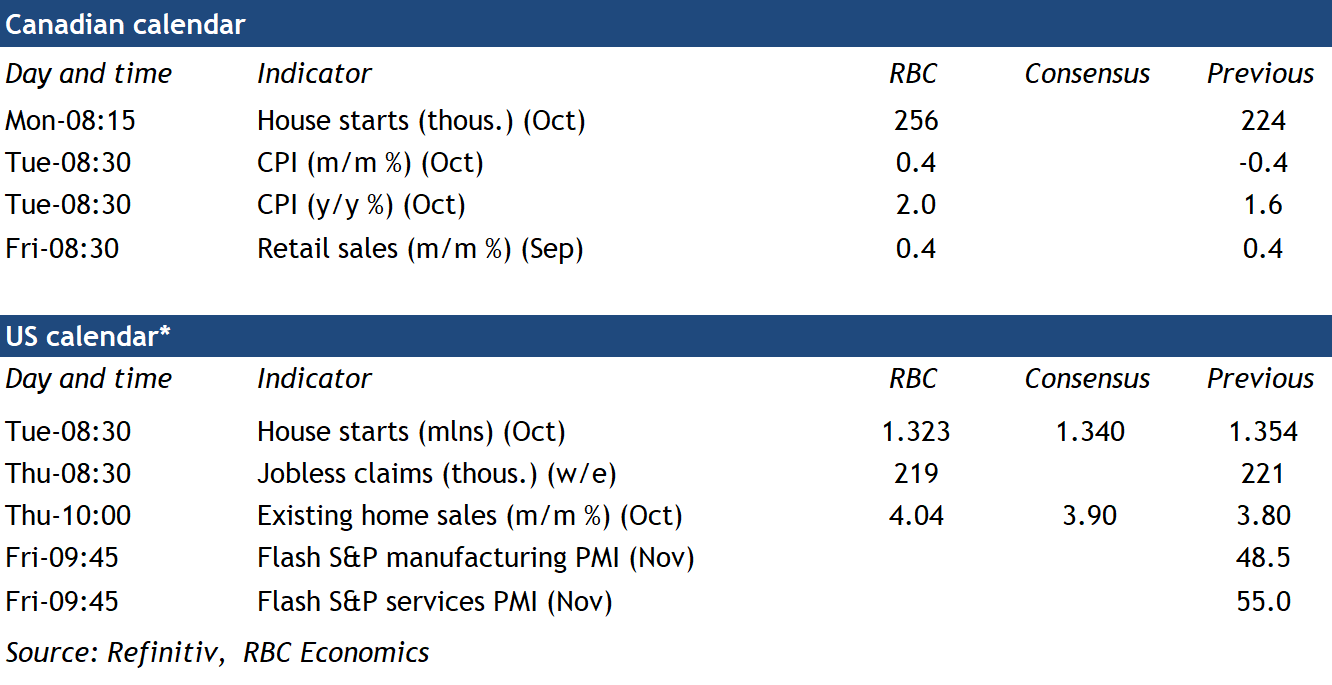
With the US CPI data already pointing to some stickiness in price pressures during October and Fed Chair Powell noting just yesterday that they do not need to rush in lowering interest rates, more market participants are becoming convinced that the Fed may need to take the sidelines soon. They are assigning a decent 37% chance for this happening in December and a stronger 57% for a January pause.
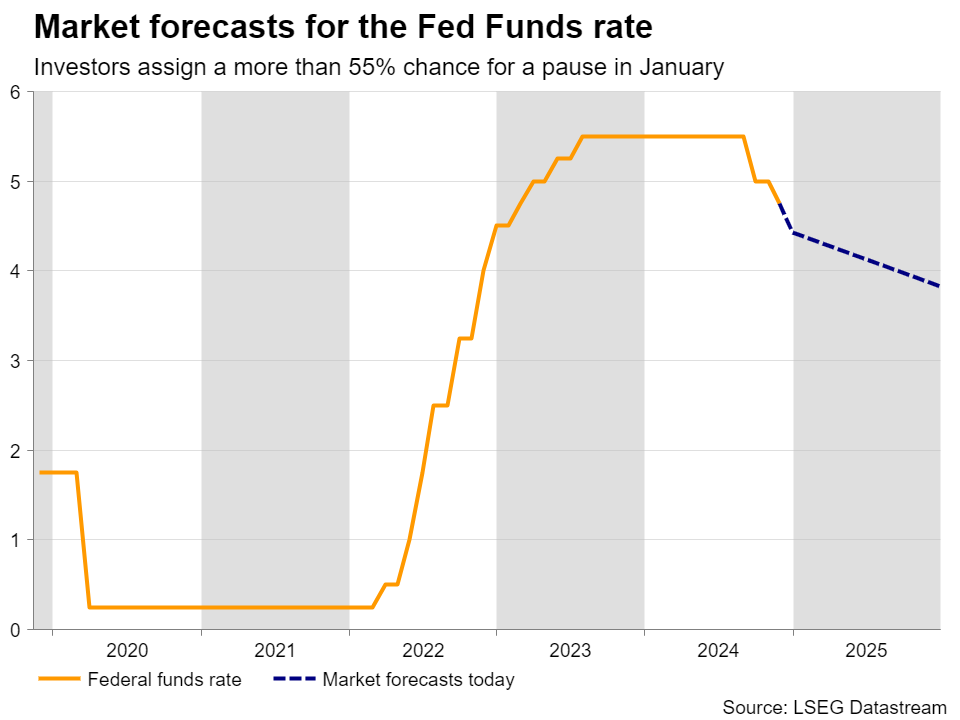
Will the PMIs seal the deal for a Fed pause?
With that in mind, next week, dollar traders may closely monitor the preliminary S&P Global PMI data for the month of November, due out on Friday, for clues as to whether the state of the US economy can indeed allow Fed officials to proceed at a slower pace.
The prices charged subindices may attract special interest as traders may be eager to find out whether the October stickiness rolled over into November. If this is the case, the probability for a January pause may increase further, driving Treasury yields and the US dollar even higher.
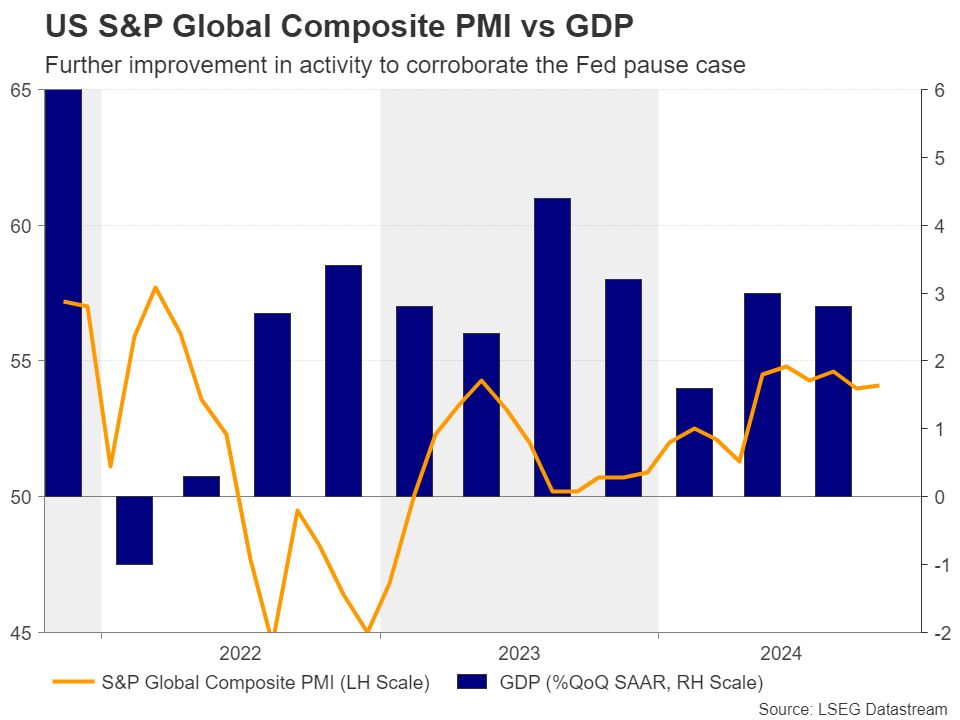
Amidst tariff clouds, euro awaits PMIs as well
On the same day, ahead of the US data, S&P Global will release the Eurozone and UK flash PMIs for November. In the Euro-area, the better-than-expected GDP data for Q3 and the rebound in CPI inflation for October have lessened the likelihood of a 50bps rate cut by the ECB at the upcoming decision.
Nonetheless, concerns that higher tariffs by a Trump-led US government could weigh on the Euro-area economy revived speculation for bold action by the ECB in December, with the euro tumbling to a more-than-one-year low.
Even if the PMIs point to some further improvement in business activity for November, concerns about the impact of Trump’s policies could remain elevated. Therefore, a potential rebound in the euro on the PMIs is likely to stay limited and short-lived.

The uncertainty surrounding Germany’s political scene could also be a headache for euro traders as a lengthy process to form a new coalition government may result in delays in entering negotiations with the US for finding common ground on trade.
Will the UK CPIs reveal early signs of rebound?
In the UK, there are more important releases for pound traders coming in ahead of Friday’s PMIs. On Wednesday, the CPI data for October are coming out, while on Friday, ahead of the PMIs, retail sales are due.
At its latest gathering, the BoE cut interest rates by 25bps but signaled it will proceed with caution on the pace of further easing, prompting market participants to push back their rate cut expectations. There is only an 18% chance for another reduction in December, with a quarter-point cut being fully penciled in for March 2025.
And this is despite the headline inflation rate dropping to 1.7% y/y in September. Perhaps investors have taken into account the still-elevated core rate and the upward revisions of the BoE itself. Just for the record, the Bank has raised its inflation forecast for 2025 to 2.7% y/y from 2.2%.

If Wednesday’s CPI data indeed show early signs of a rebound in price pressures, investors could push further back the timing of the next interest rate cut, something that could prove positive for the pound, especially if Friday’s retail sales come in on the bright side as well.
Canadian and Japanese inflation numbers also on tap
More CPI numbers are coming out next week. On Tuesday, the inflation chorus will start with the Canadian numbers, while on Friday, it will end with Japan’s Natonwide CPI data.
In Canada, there is a decent 35% chance for the BoC to deliver a back-to-back 50bps rate cut in December. The jobs data for October have been on the mixed side, with the unemployment rate holding steady at 6.5%, instead of rising to 6.6% as expected, but with the net change in employment slowing more than expected.
The report was not enough to stop the loonie from tumbling against the almighty US dollar, with dollar/loonie now trading at levels last seen in May 2020. Both the headline and core CPI rates stood at 1.6% y/y in October, while the closely watched trimmed CPI held steady at 2.4%. Further cooling may corroborate the notion that there are no upside inflation risks in Canada and may convince more traders to bet on a 50bps reduction in December, thereby pushing the loonie even lower.
In Japan, the BoJ kept interest rates untouched on October 31, but signaled that the conditions for raising rates again are falling into place. This and the latest slide in the yen convinced market participants that Japanese policymakers could hike again at the turn of the year, seeing rates 13bps higher in December and 20 in January.
Having said that though, even if Friday’s CPI data corroborates the view of higher rates soon, any yen recovery is likely to stay limited and short-lived due to further potential strength in the US dollar and due to the hikes being already priced in.