Sample Category Title
Dollar Reasserts Dominance on Fed Expectations and Risk Sentiment
Dollar regained its dominance in the currency markets last week, surging ahead despite US Treasury yields struggling to break through resistance levels. Investors continued to adjust their expectations for Fed's monetary policy, increasingly anticipating a slower pace of interest rate cuts with fewer adjustments in the coming year. This shift in sentiment was also reflected amplified by the late selloff, which provided additional support for the greenback. However, with the Dollar Index now sitting inside a critical resistance zone, the currency may face significant hurdles in sustaining its upward momentum.
In an unexpected development, Japanese Yen emerged as the second-best performer of the week. Yen's strong rebound occurred even in the absence of aggressive verbal intervention from Japanese authorities. While there are no clear signs of a reversal against Dollar yet, Yen is making notable progress against other major currencies. Canadian Dollar also demonstrated robust performance, ranking third among the top currencies. This strength persisted despite market expectations of interest rate cuts by BoC and the selloff in oil.
On the other hand, British Pound ended the week as the worst performer, with Australian and New Zealand Dollars not far behind. All three currencies were pressured by deterioration in risk sentiment across global markets. For the Pound, the latest GDP data revealed weaker-than-expected growth, and an uptick in the unemployment rate has strengthened the position of dovish policymakers within BoE for another interest rate cut in the near future. Australian and New Zealand Dollars were dragged down as traders grew increasingly frustrated with the lack of concrete action in China's fiscal stimulus measures.
Dollar Gains Persist Despite Yield Struggles, Stocks Signal Reversal Amid Fed Reassessment
Investor sentiment in the US appears to be turning last week, with bearish reversal signals emerging in two major stock indexes. The change reflects recalibrated expectations around Fed’s interest rate strategy for 2025. October’s CPI data, which showed persistent inflationary pressures, coupled with concerns over the inflationary effects of President-elect Donald Trump’s fiscal and trade policies, are reinforcing the view that rate cuts would be slower and more limited.
The change in sentiment was reinforced by Fed Chair Jerome Powell's comment that there is "no hurry" to lower rates Chicago Fed President Austan Goolsbee echoed this sentiment, while Boston Fed President Susan Collins suggested that while a December rate cut remains possible, it is far from certain.
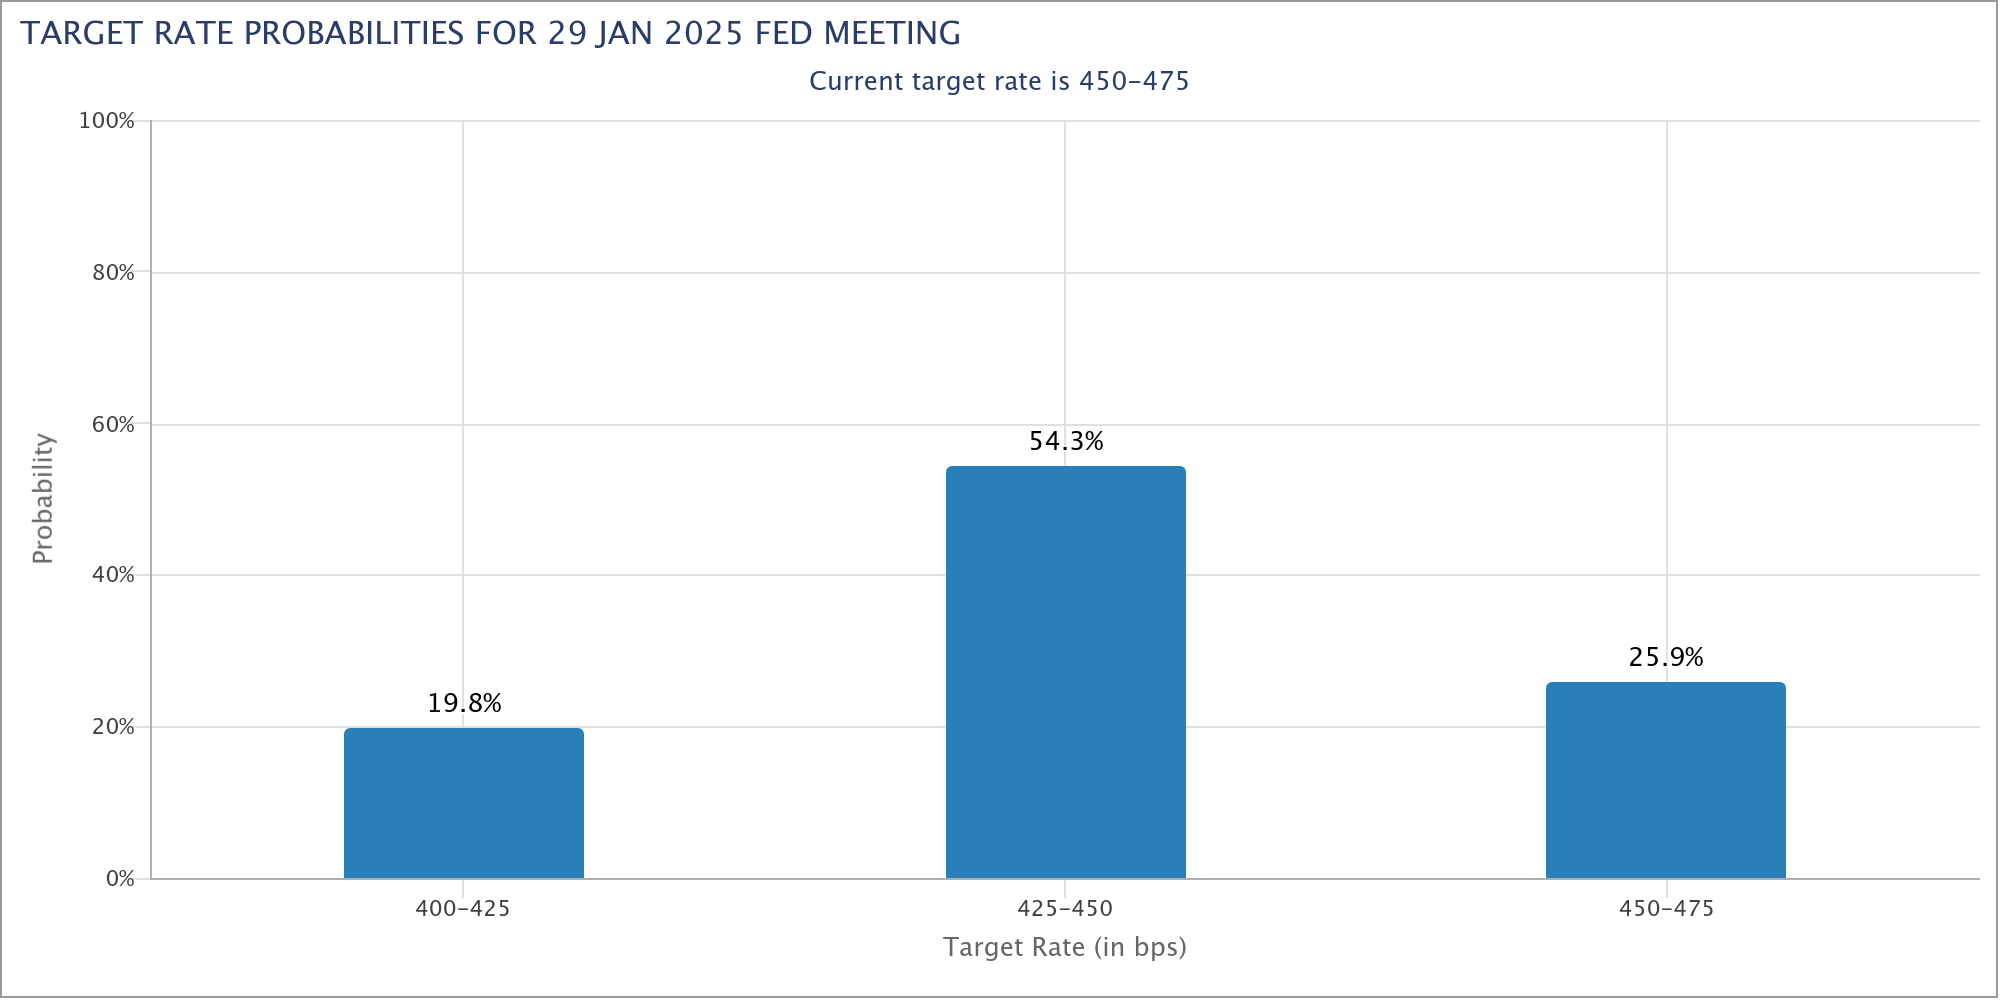
Currently fed funds futures still imply a 61.9% likelihood of a 25 bps rate cut in December. However, odds of another one in January dropped below 20%. Markets are already betting on a pause at the start of 2025.
Technically, Dollar Index made significant progress with last week's strong rally and it's now sitting in an important long term resistance zone. That comes even though 10-year yield struggled to break through a medium term fibonacci resistance cleanly. Looking ahead, whether Dollar Index could confirm long term bullish trend reversal would hinge on the renewed strength of 10-year yield, or correction in stocks, or both.
Looking at the details, an island top pattern was formed in S&P 500 with November 7's gap up and November 15's gap down. It's still early to confirm that a sizeable correction is underway. Another rally would remain in favor as long as 55 D EMA (now at 5765.03) holds. However, sustained break of the 55 D EMA would likely bring deeper correction through 5969.51 support to medium term channel line (now at 5535).
Similarly, an island top is also seen in NASDAQ with gaps on the same days. Further rise would remain in favor as long as 55 D EMA (now at 18312.93) holds. But sustained break there will bring deeper correction through 18085.95 support to medium term trend line (now at 16893).
10-year yield continued to struggle at around 4.45 last week, facing strong resistance from medium term falling trend line, as well as 61.8% retracement of 4.997 to 3.603 at 4.464. Nevertheless, the retreat has so far been shallow and further rally will remain in favor as long as 4.264 support holds.
Sustained trading above the mentioned resistance zone will solidify the bullish case that whole correction fro 4.997 has completed with three waves down to 3.603. Further rally should then be seen to 4.737 and then 4.997.
However, break of 4.264 will confirm short term topping, and bring deeper pull back to 55 D EMA (now at 4.137) and possibly below.
Dollar Index accelerated with strong upside momentum last week, as seen in D MACD, and entered into 106.51/107.34 resistance zone. Near term outlook will stay bullish as 105.44 resistance turned support holds, for 107.34, and possibly above. However, the key hurdle is 100% projection of 99.57 to 107.34 from 100.15 at 107.92.
In the background, Dollar Index has seen strong support from 55 M EMA this year, which keeps the long term up trend from 70.69 (2008 low) intact. Sustained break of 107.92 will strength the case that corrective fall from 114.77 (either as a whole correction pattern or just the down leg of a three wave pattern), has completed. In this case, Dollar Index could target 114.77 (2022 high) next. But that would need substantial progress in 10-year yield and selloff in stocks.
Yen Rebounds as Sentiment Shift, AUD/JPY Reversing?
Yen has been the worst performer for most of last week. Japanese Prime Minister survived a parliament vote and stayed in position. But the road ahead would be challenging for his minority government.
BoJ's summary of opinions reaffirmed the core stance that rate hikes to proceed gradually if economic outlook holds. But the timing of the steps remain higher uncertain, with divided opinions within the board.
Besides, Japan was unusually quiet as USD/JPY surged past 156 market. That's taken by some as an indication that Japan might tolerate further depreciation in Yen until it hits 160 mark. Nevertheless, Yen staged a strong rebound on Friday as US market sentiment turned sour, probably reducing some need for Japan to intervene imminently.
AUD/JPY's break of and close below 55 D EMA last week is taken as the first sign of rejection by 61.8% retracement of 109.36 to 90.10 at 102.00. Immediate focus is now on 99.42 support. Decisive break there will strengthen the case that whole corrective rebound from 90.10 has already completed with three waves up to 102.39. Near term outlook will then be turned bearish towards 90.10/93.58 support zone.
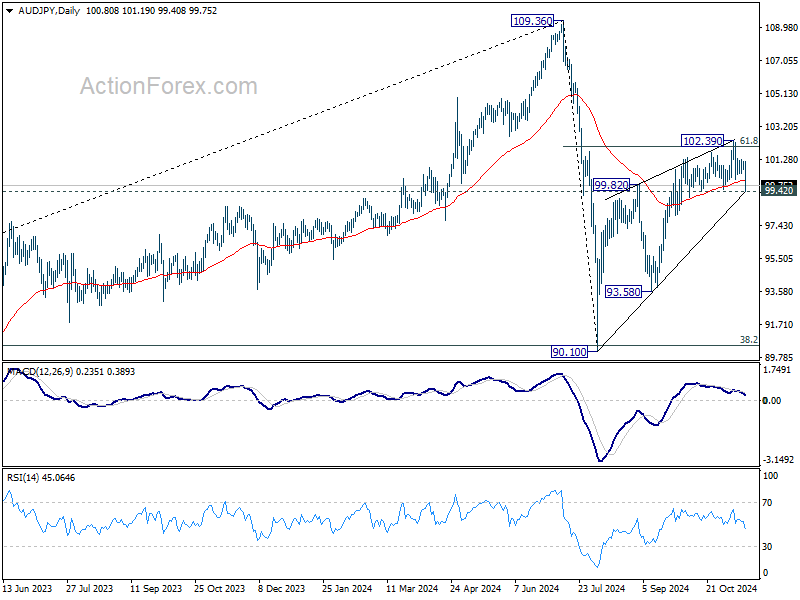
From Aussie's side, the depth of it's decline would depend on sentiments towards China's economy and markets. The extended decline in Hong Kong HSI was a vote of no confidence toward China's stimulus announcement since September. Immediate focus is now on 61.8% projection of 23141.74 to 19977.35 from 21355.44 at 19338.04. Strong rebound from this level will keep the up trend from 1479.16 low intact.
However, decisive break of 19338.04 could prompt downside acceleration to next key cluster support level at around 18000 (100% projection at 18091.04, and 61.8% retracement of 14794.16 to 23241.74 at 18021.14). That would be the last line of defense for the up trend.
USD/CAD Weekly Outlook
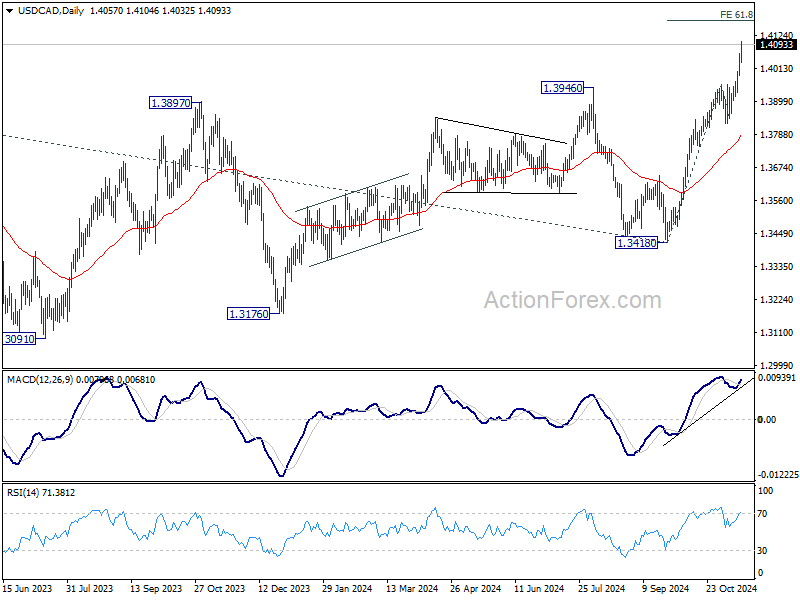
USD/CAD's break of 1.3976 key resistance last week confirms larger up trend resumption. Initial bias remains on the upside this week. Next near term target is 61.8% projection of 1.3418 to 1.3958 from 1.3841 at 1.4175. On the downside, below 1.4032 minor support will turn intraday bias neutral and bring consolidations first. But outlook will stay bullish as long as 1.3841 support holds, in case of retreat.
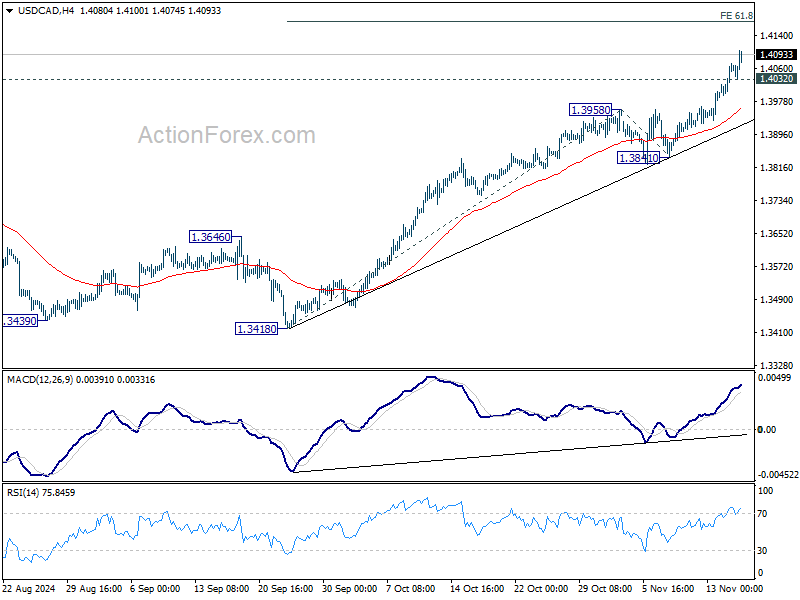
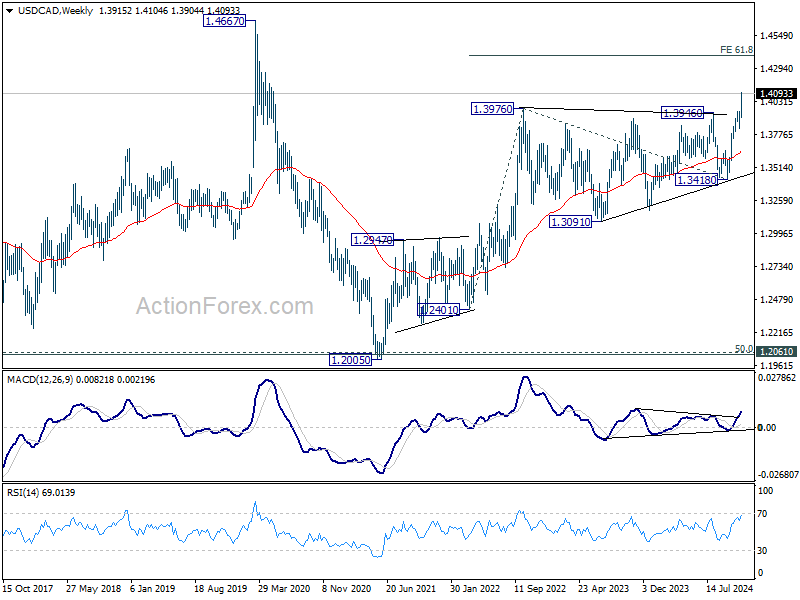
In the bigger picture, up trend from 1.2005 (2021) is resuming with break of 1.3976 key resistance (2022 high). Next target is 61.8% projection of 1.2401 to 1.3976 from 1.3418 at 1.4391. Now, medium term outlook will remain bullish as long as 1.3418 support holds, even in case of deep pullback.
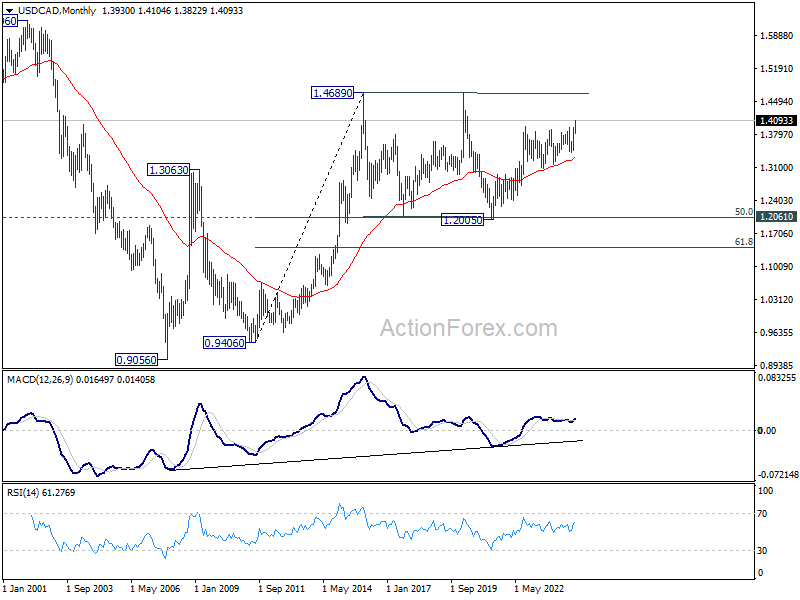
In the longer term picture, price actions from 1.4689 (2016 high) are seen as a consolidation pattern, which might have completed at 1.2005. That is, up trend from 0.9506 (2007 low) is expected to resume at a later stage. This will remain the favored case as long as 1.3418 support holds.
EUR/USD Weekly Outlook
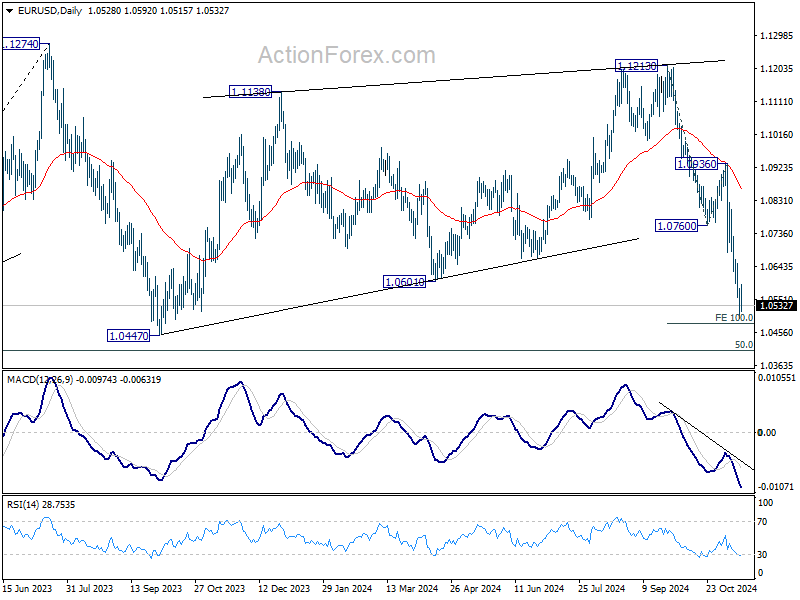
EUR/USD's decline from 1.1213 resumed last week and fell to as low as 1.0495, before recovering just ahead of 100% projection of 1.1213 to 1.0760 from 1.0936 at 1.0483. Initial bias stays neutral this week for consolidations. But outlook will remain bearish as long as 1.0760 support turned resistance holds. On the downside, firm break of 1.0495 will target 1.0447 support and then 1.0404 key fibonacci level next.
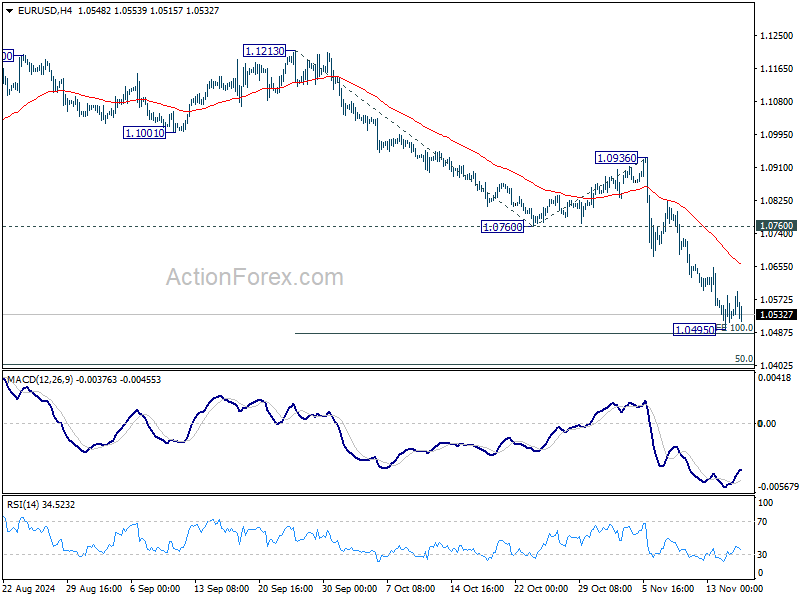
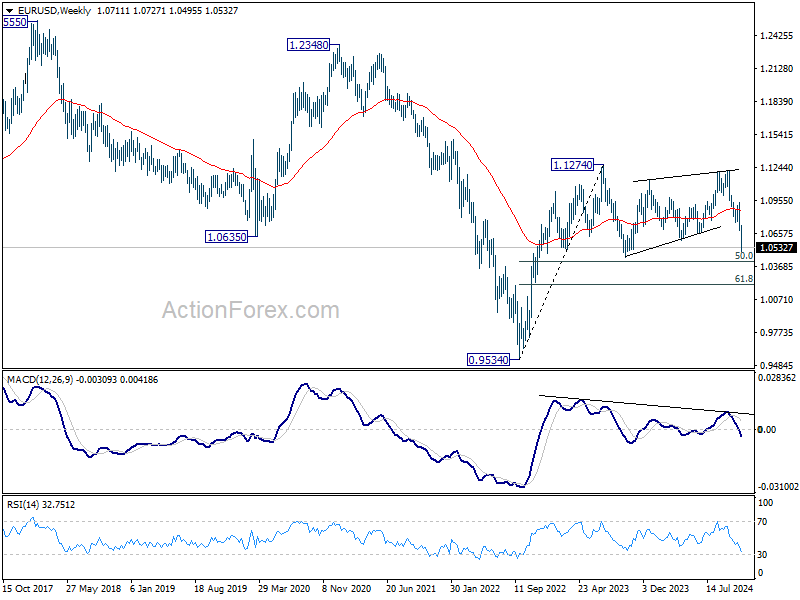
In the bigger picture, price actions from 1.1274 (2023 high) are seen as a consolidation pattern to up trend from 0.9534 (2022 low), with fall from 1.1213 as the third leg. Downside should be contained by 50% retracement of 0.9534 (2022 low) to 1.1274 at 1.0404, to bring up trend resumption at a later stage. However, firm break of 1.0404 will raise the chance of reversal and target 61.8% retracement at 1.0199.
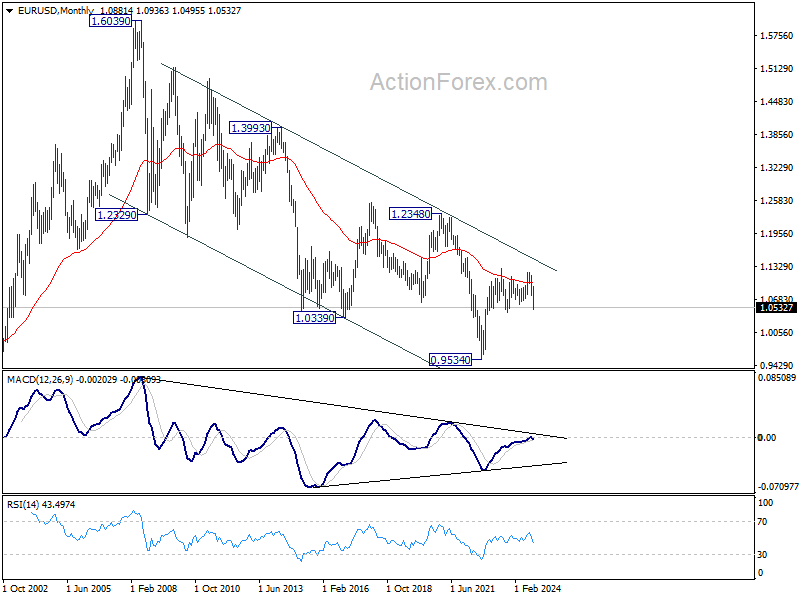
In the long term picture, a long term bottom is in place at 0.9534 (2022 low). But for now, EUR/USD is struggling to sustain above 55 M EMA (now at 1.1011). Outlook is neutral at best at this point.
USD/JPY Weekly Outlook
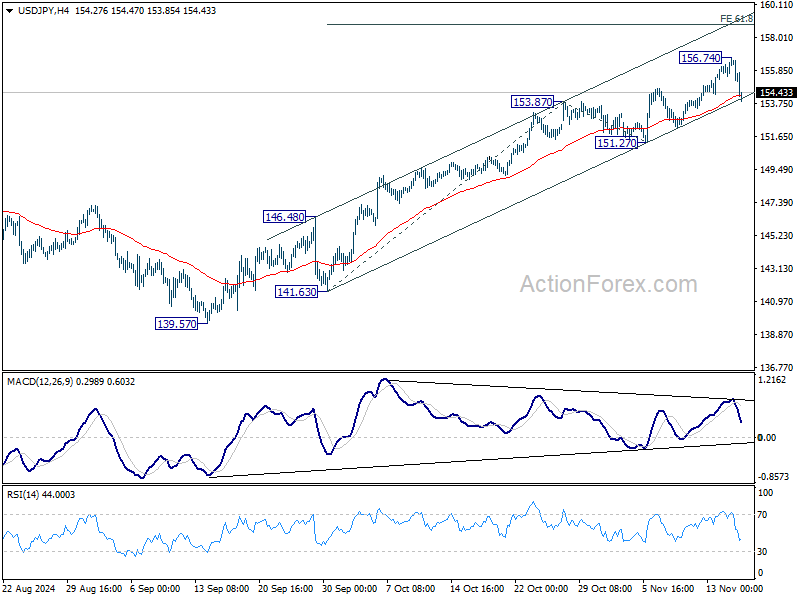
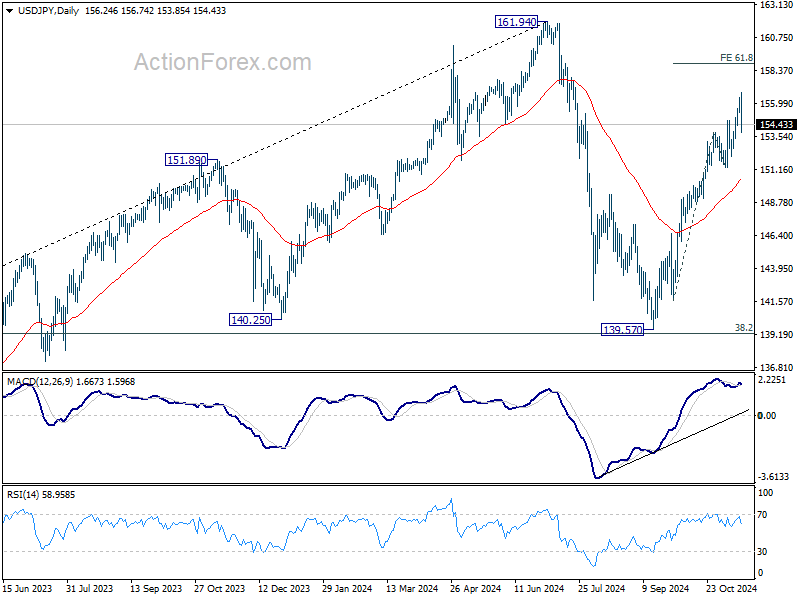
USD/JPY's rise from 139.57 continued last week and hit as high as 156.74 before retreating. Initial bias stays neutral this week first and some consolidations could be seen. But further rally is expected as long as 151.27 support holds. Above 156.74 will target 61.8% projection of 141.63 to 153.87 from 151.27 at 158.83.
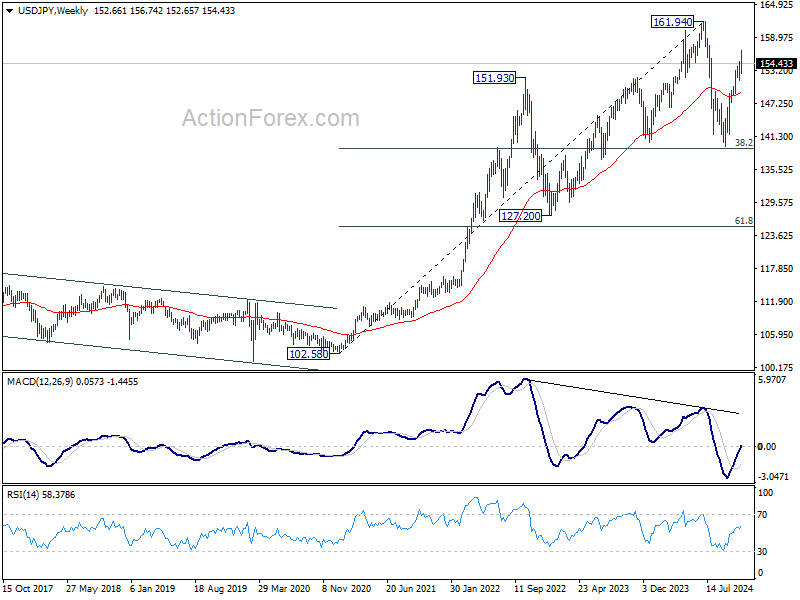
In the bigger picture, price actions from 161.94 are seen as a corrective pattern to rise from 102.58 (2021 low). The range of medium term consolidation should be set between 38.2% retracement of 102.58 to 161.94 at 139.26 and 161.94. Nevertheless, sustained break of 139.26 would open up deeper medium term decline to 61.8% retracement at 125.25.
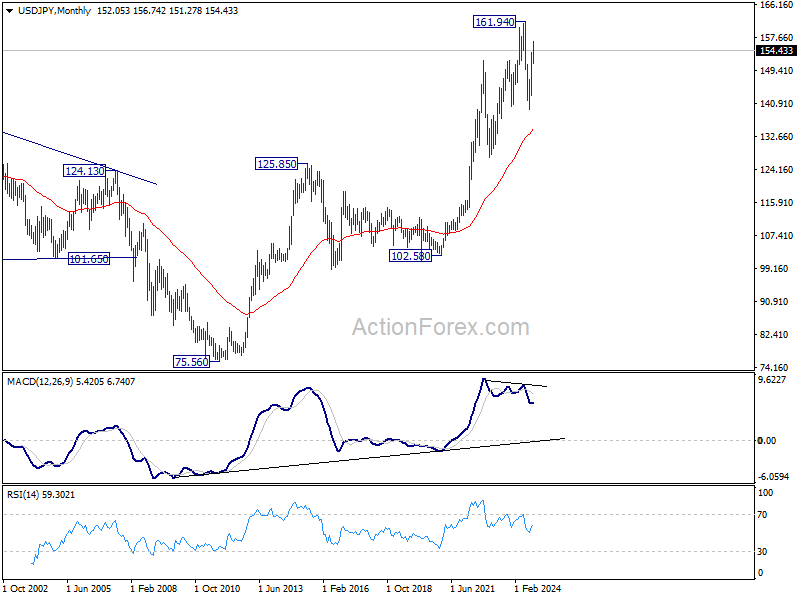
In the long term picture, it's still early to conclude that up trend from 75.56 (2011 low) has completed. However, a medium term corrective phase should have commenced, with risk of deep correction towards 55 M EMA (now at 134.54).
GBP/USD Weekly Outlook
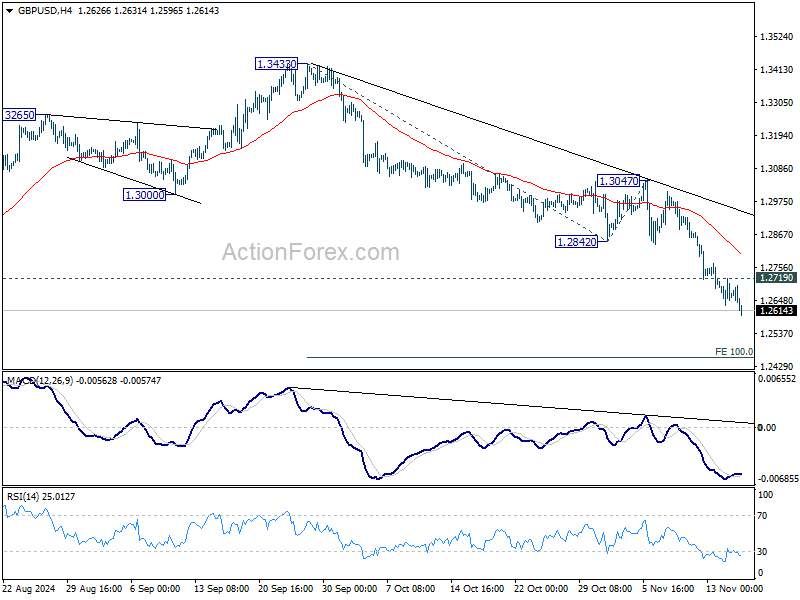
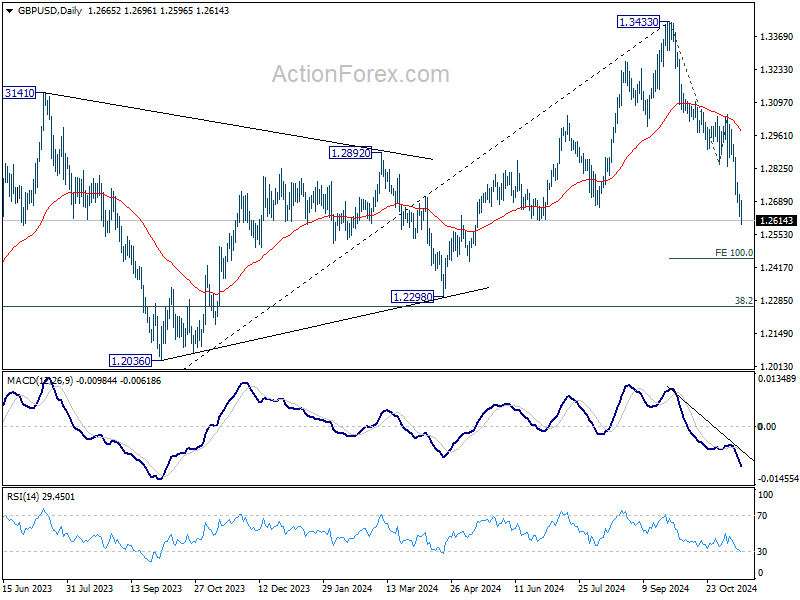
GBP/USD's decline from 1.3433 resumed last week and hit as low as 1.2596. Initial bias stays on the downside this week and further fall should be seen to 100% projection of 1.3433 to 1.2842 to 1.3047 at 1.2456. On the upside, above 1.2719 minor resistance will turn intraday bias neutral first. But outlook will stay bearish as long as 1.2842 support turned resistance holds, in case of recovery.
In the bigger picture, a medium term top should be in place at 1.3433, and price actions from there are correcting whole up trend from 1.0351 (2022 low). Deeper decline is now expected as long as 55 D EMA (now at 1.2977) holds, to 38.2% retracement of 1.0351 to 1.3433 at 1.2256, which is close to 1.2298 structural support. Strong support should be seen there to bring rebound.
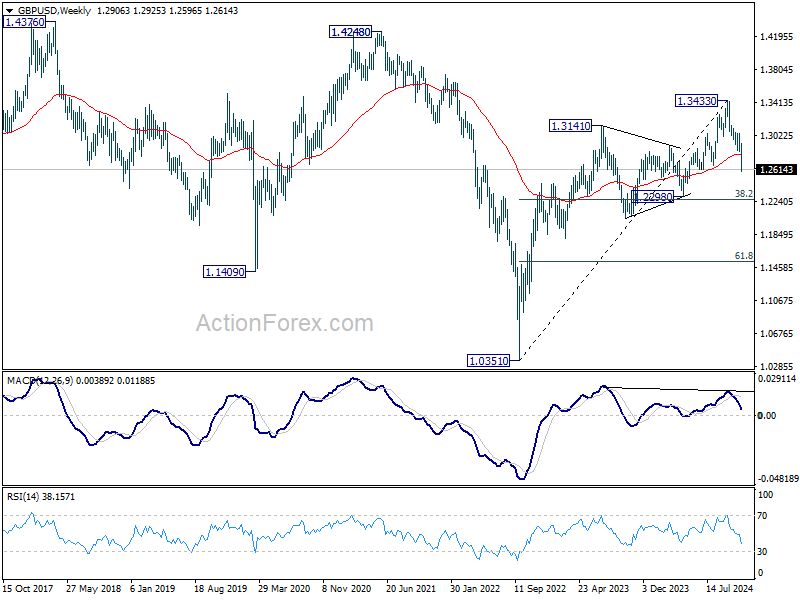
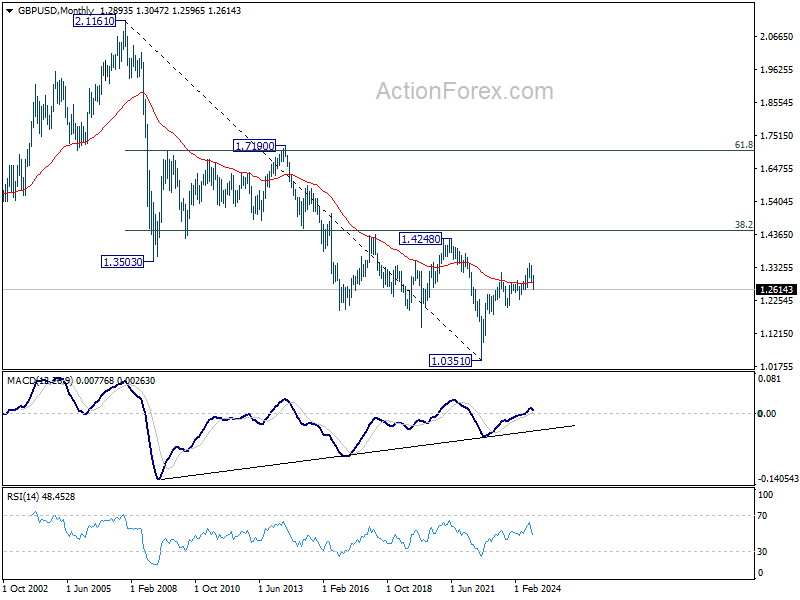
In the long term picture, as long as 1.2298 support holds, rise from 1.0351 long term bottom is expected to continue. But in any case, outlook is neutral at best as long as 1.4248 structural resistance holds.
USD/CHF Weekly Outlook
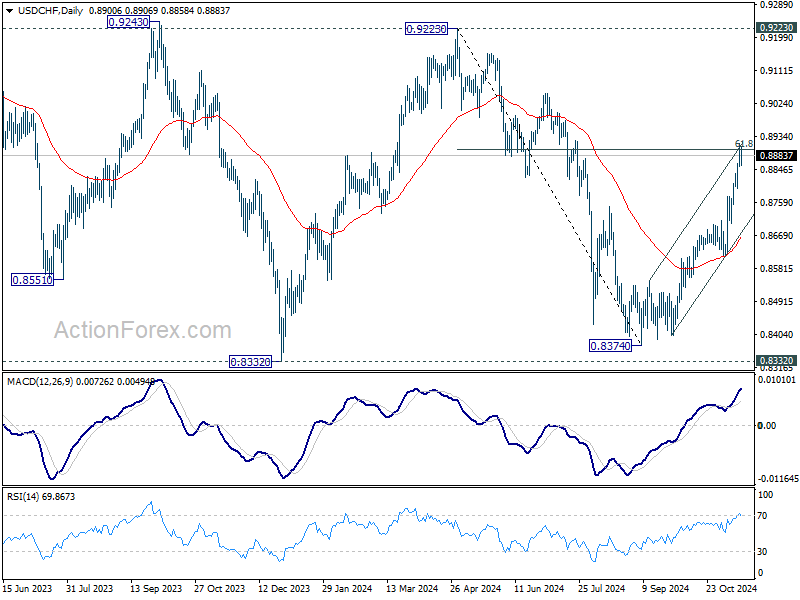
USD/CHF's rally from 0.8733 extended to as high as 0.8916 last week, but retreated after hitting 61.8% retracement of 0.9223 to 0.8374 at 0.8899. Initial bias remains neutral this week for consolidations first. But outlook will stay bullish as long as 0.8773 resistance turned support holds. Sustained trading above 0.8899 will pave the way back to 0.9223 key resistance.
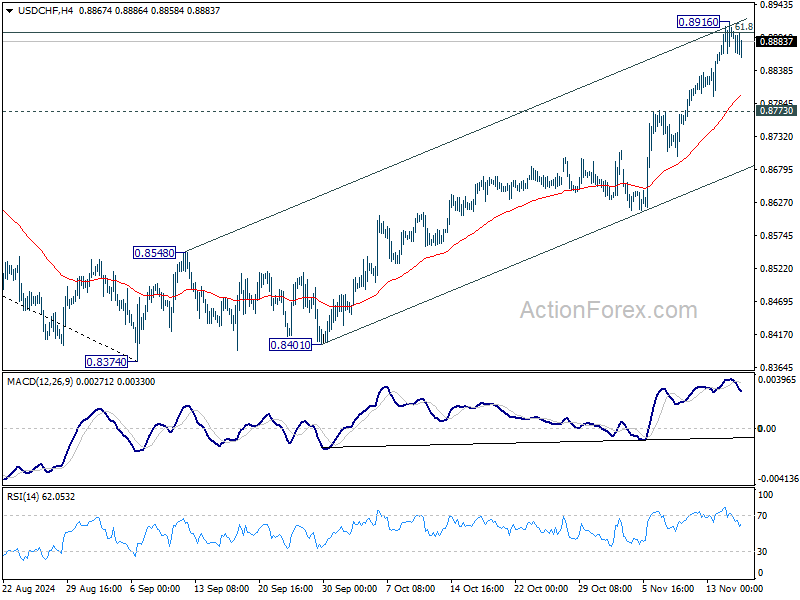
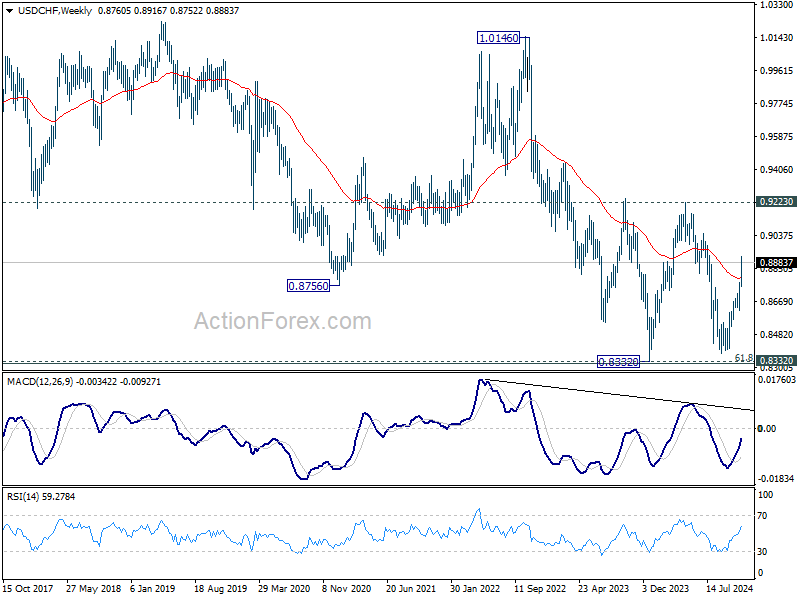
In the bigger picture, price actions from 0.8332 (2023 low) are currently seen as a medium term corrective pattern. Rise from 0.8374 is seen as the third leg. Overall outlook will continue to stay bearish as long as 0.9223 resistance holds. Break of 0.8332 low is in favor at a later stage when the consolidation completes.
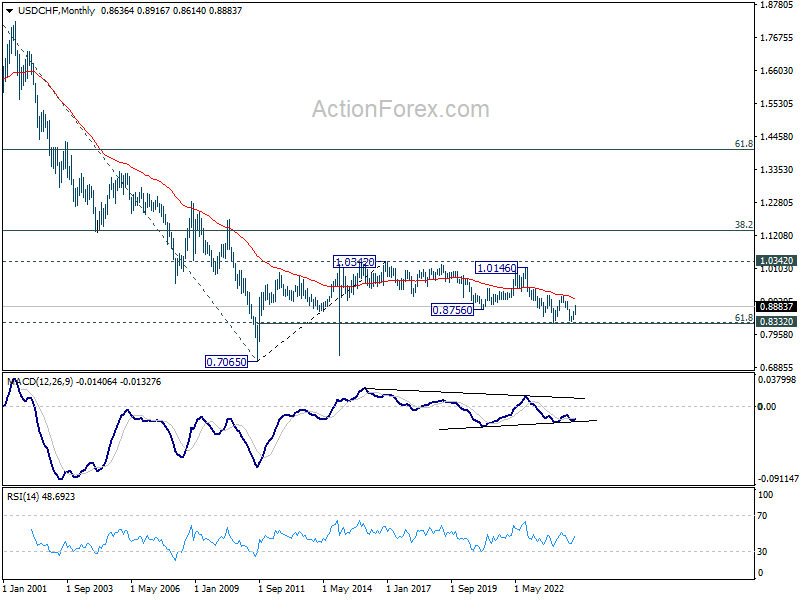
In the long term picture, price action from 0.7065 (2011 low ) are seen as a corrective pattern to the multi-decade down trend from 1.8305 (2000 high). Fall from 1.0342 (2016 high) is seen as the second leg. Rejection by 55 M EMA suggest that this fall is in progress. Break of 61.8% retracement of 0.7065 to 1.0342 at 0.8317 will pave the way back to 0.7065.
AUD/USD Weekly Report
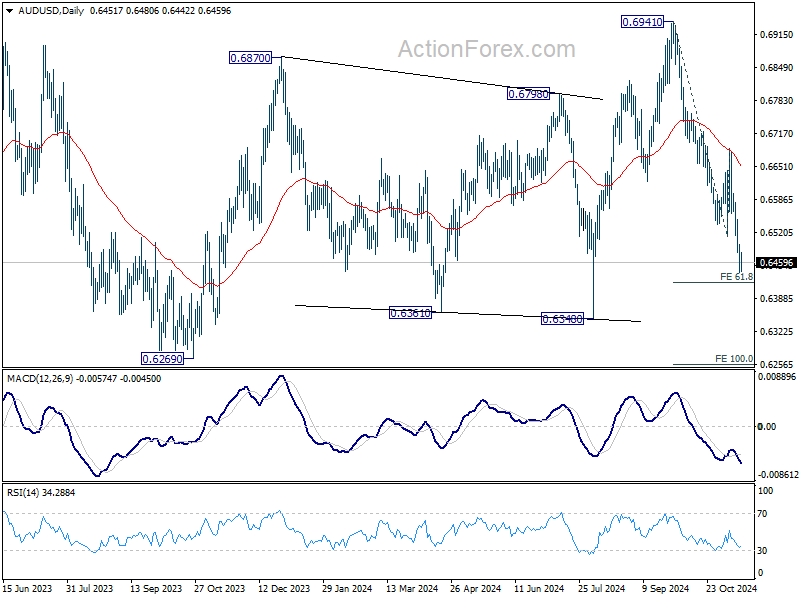
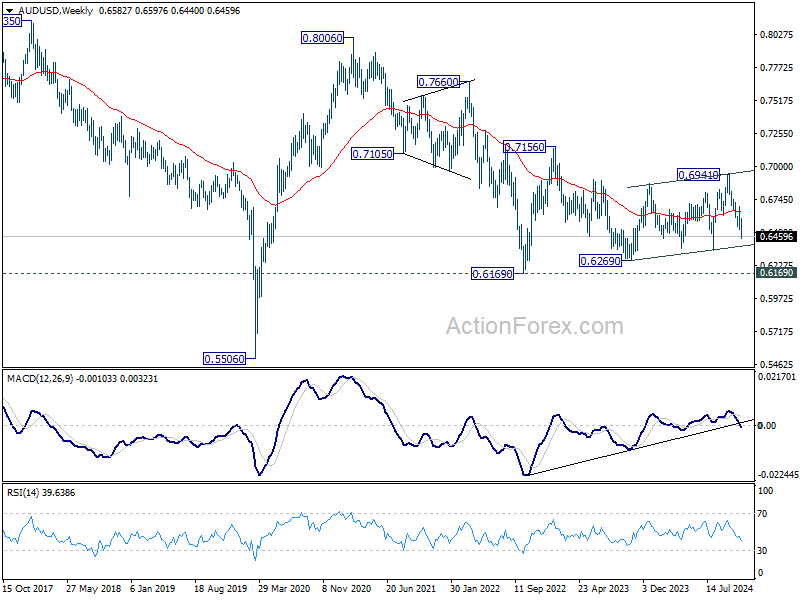
AUD/USD's fall from 0.6491 resumed last week. Initial bias stays on the downside this week for 61.8% projection of 0.6941 to 0.6511 from 0.6687 at 0.6421. Firm break there will target 100% projection at 0.6257 next. On the upside, above 0.6511 support turned resistance will turn intraday bias neutral and bring consolidations first. But outlook will stay bearish as long as 0.6687 resistance holds, in case of recovery.

In the bigger picture, rise from 0.6269 (2023 low) should have completed with three waves up to 0.6941. Corrective pattern from 0.6169 (2022 low) is now extending with another falling leg. Deeper decline would be seen back to 0.6269 as sideway trading extends.
In the long term picture, the down trend from 1.1079 (2011 high) should have completed at 0.5506 (2020 low) already. It's unsure yet whether price actions from 0.5506 are developing into a corrective pattern, or trend reversal. But in either case, fall from 0.8006 is seen as the second leg of the pattern. Firm break of 0.7156 resistance will argue that the third leg has already started towards 0.8006.

USD/CAD Weekly Outlook
USD/CAD's break of 1.3976 key resistance last week confirms larger up trend resumption. Initial bias remains on the upside this week. Next near term target is 61.8% projection of 1.3418 to 1.3958 from 1.3841 at 1.4175. On the downside, below 1.4032 minor support will turn intraday bias neutral and bring consolidations first. But outlook will stay bullish as long as 1.3841 support holds, in case of retreat.
In the bigger picture, up trend from 1.2005 (2021) is resuming with break of 1.3976 key resistance (2022 high). Next target is 61.8% projection of 1.2401 to 1.3976 from 1.3418 at 1.4391. Now, medium term outlook will remain bullish as long as 1.3418 support holds, even in case of deep pullback.
In the longer term picture, price actions from 1.4689 (2016 high) are seen as a consolidation pattern, which might have completed at 1.2005. That is, up trend from 0.9506 (2007 low) is expected to resume at a later stage. This will remain the favored case as long as 1.3418 support holds.
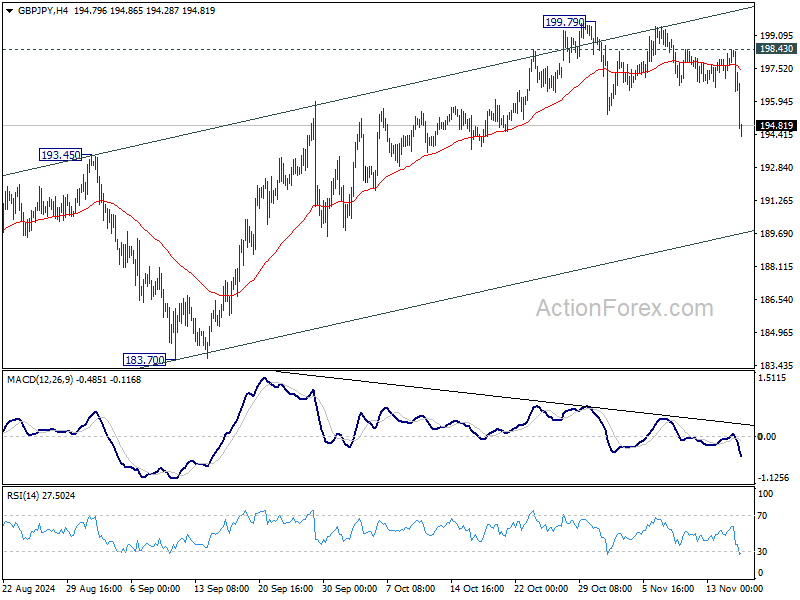
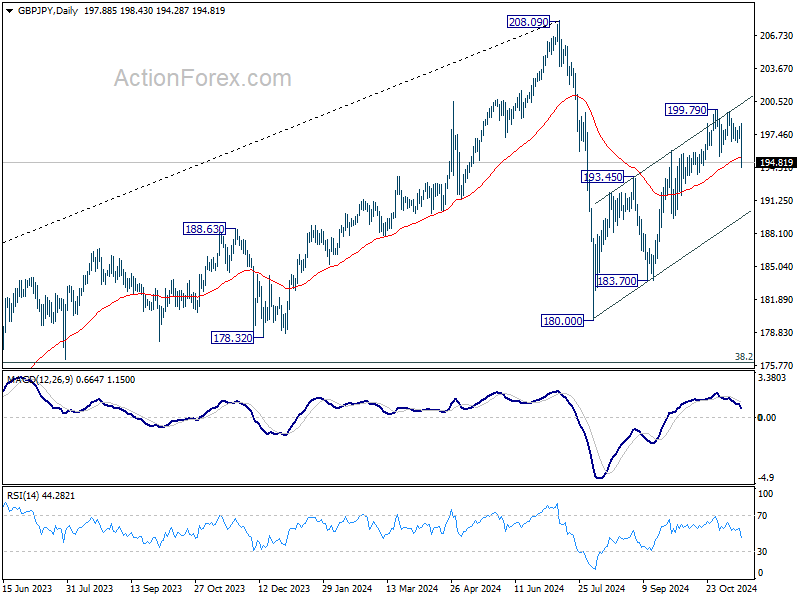
GBP/JPY Weekly Outlook
GBP/JPY's late decline and break of 55 D EMA (now at 195.24) argue that corrective rise from 180.00 has completed with three waves up to 199.79, after hitting rising channel resistance. Initial bias is back on the downside this week. Firm break of 193.45 resistance turned support will bring deeper fall to 183.70 next. For now risk will stay on the downside as long as 198.43 resistance holds, in case of recovery.
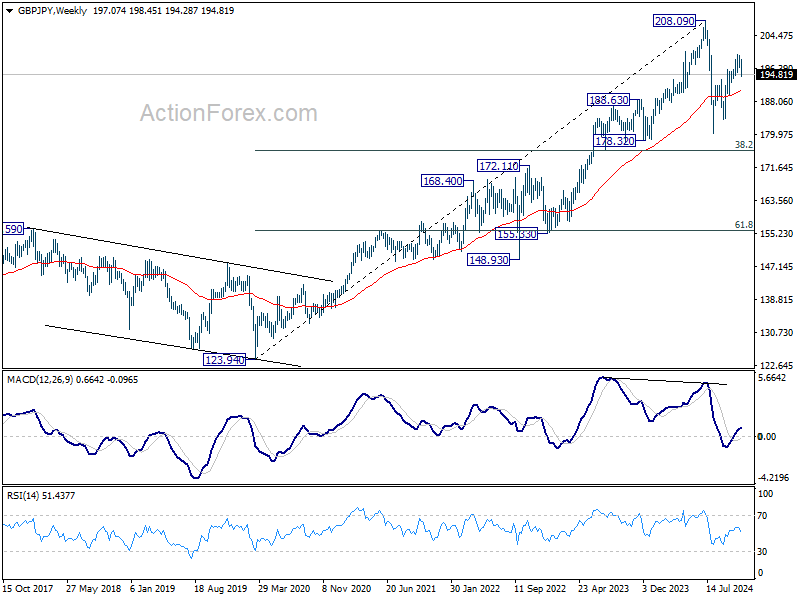
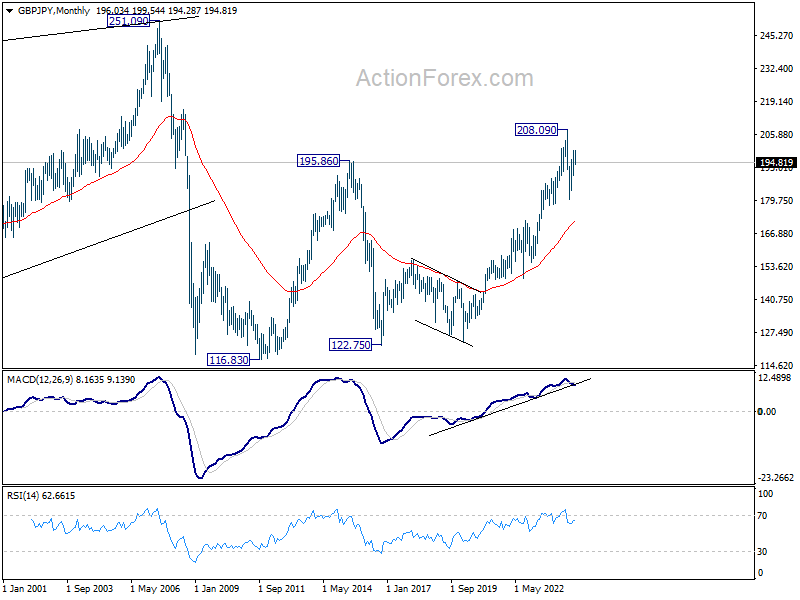
In the bigger picture, price actions from 208.09 are seen as a correction to whole rally from 123.94 (2020 low). The range of consolidation should be set between 38.2% retracement of 123.94 to 208.09 at 175.94 and 208.09. However, decisive break of 175.94 will argue that deeper correction is underway.
In the longer term picture, considering bearish divergence condition in W MACD, 208.09 is at least a medium term top. It's still early to conclude that the up trend from 122.75 (2016 low) has completed. But it's at least in a medium term corrective phase, with risk of correction to 55 M EMA (now at 172.07).
EUR/JPY Weekly Outlook
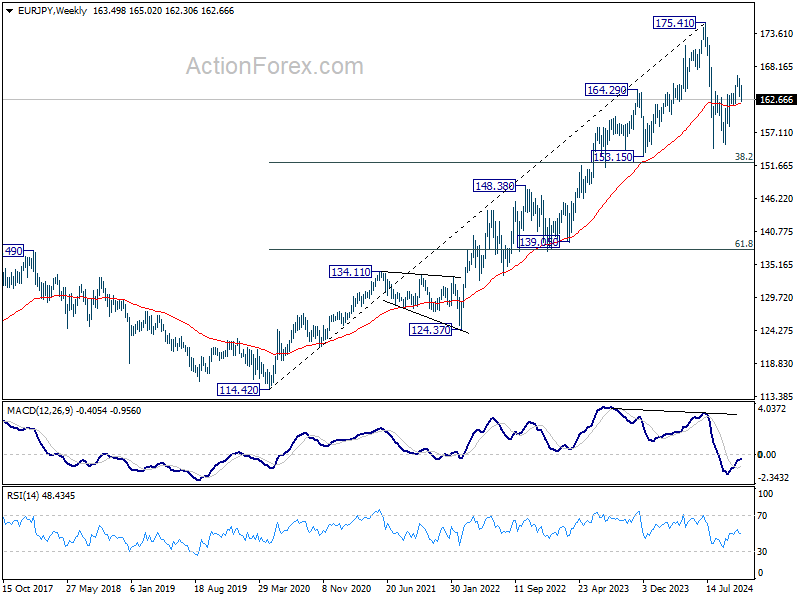
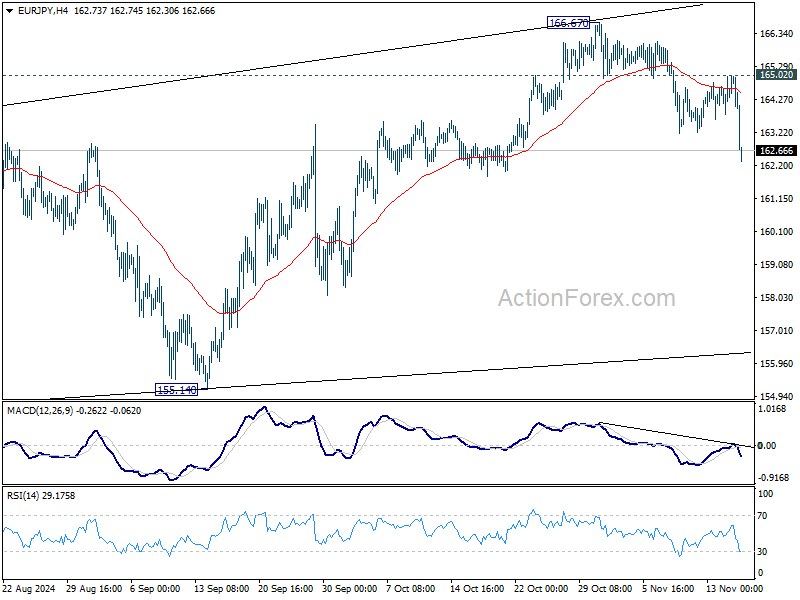
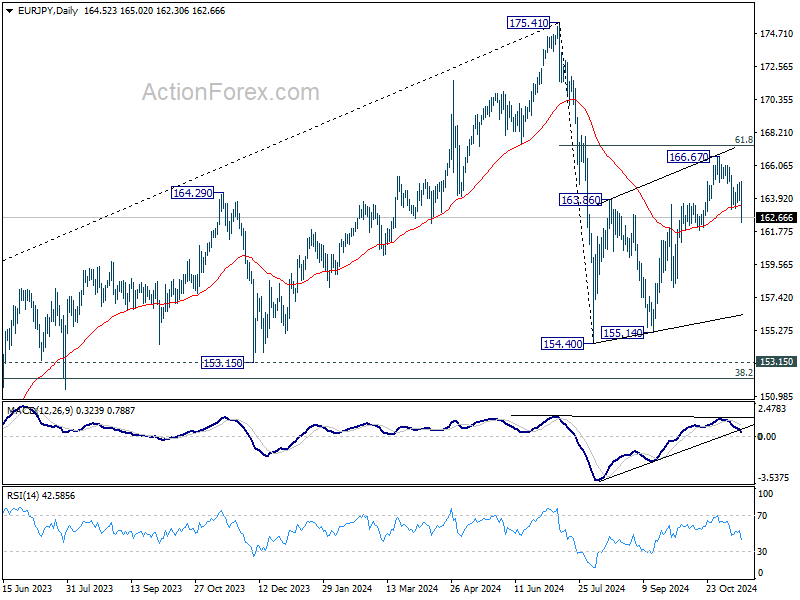
EUR/JPY's fall from 166.67 continued last week after interim recovery. The break of 55 D EMA (now at 163.41) argues that corrective rebound from 154.40 has completed with three waves up to 166.67. That came after rejection by 61.8% retracement of 175.41 to 154.40 at 167.38. Initial bias is now on the downside this week for 155.14 support next. For now, risk will stay on the downside as long as 165.02 resistance holds, in case of recovery.
In the bigger picture, price actions from 175.41 are seen as correction to rally from 114.42 (2020 low). The range of consolidation should have been set between 38.2% retracement of 114.42 to 175.41 at 152.11 and 175.41 high. However, decisive break of 152.11 would argue that deeper correction is underway.
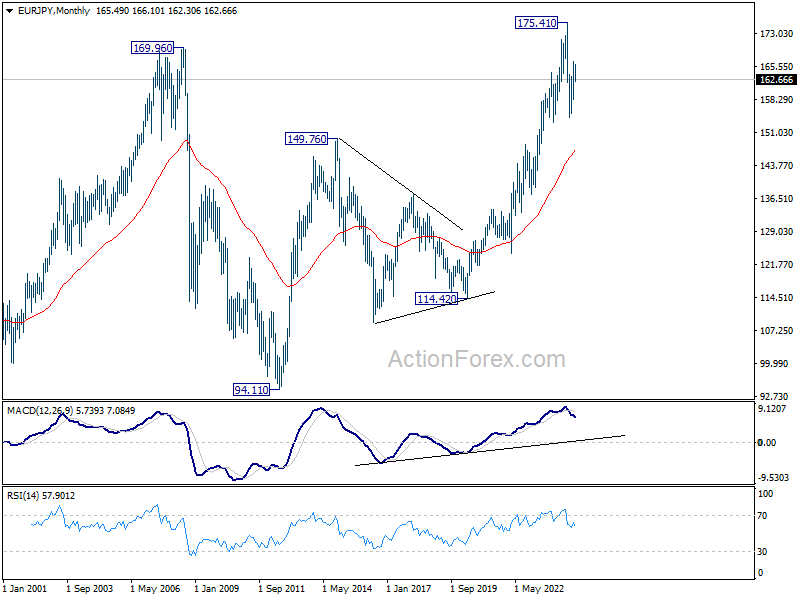
In the long term picture, considering bearish divergence condition in W MACD, 175.41 is at least a medium term top. It's still early to conclude that up trend from 94.11 (2012 low) has completed. But a medium term corrective phase is in progress with risk of deeper fall back to 55 M EMA (now at 147.33).