
Sample Category Title
Yen Staying Soft on Rising US Yields, Aussie Vulnerable to Further Declines Ahead of RBA Minutes
The forex markets are largely consolidating today, with no major developments to drive decisive moves. Euro is showing some recovery, but the uptick appears more like a corrective bounce than a reversal. Sterling and Swiss Franc are following similar patterns, with modest strength lacking the momentum needed for sustained gains. This cautious tone is evident in the tight trading ranges of EUR/USD, GBP/USD, and USD/CHF, as traders await key events, including Wednesday's UK CPI release, and Eurozone and UK PMI data on Friday.
Yen, however, is under mounting pressure as the European session progresses. Rising treasury yields in the US are acting as a headwind, with US 10-year yield once again eyeing the 4.5% mark. Compounding Yen's challenges is the absence of clear signals from BoJ regarding its next policy move. With no explicit guidance on a December rate hike, market participants are increasingly skeptical of imminent monetary tightening. Despite this, Yen remains sensitive to risk sentiment, meaning it could stage a rebound if US equity markets face renewed sell-offs.
Focus will soon turn to RBA meeting minutes, set for release during the upcoming Asian session. Earlier this month, RBA left its cash rate unchanged at 4.35% but caught markets off guard by maintaining a strongly vigilant stance on upside inflation risks. NAB, one of Australia’s largest banks, has already revised its forecast for the first rate cut, pushing the timeline from February to May 2025. The minutes will be closely analyzed to gauge whether February remains a realistic window for RBA’s initial easing move or if the central bank is preparing for a longer wait.
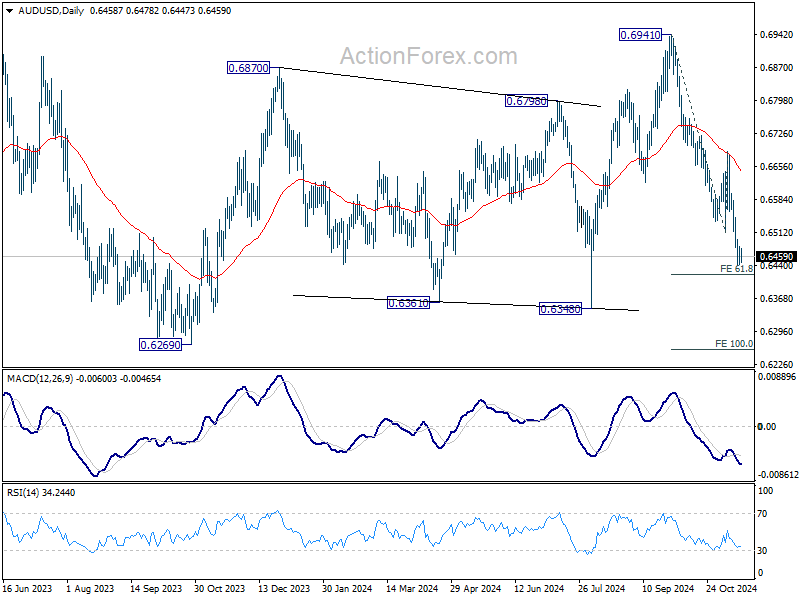
Technically, AUD/USD's fall from 0.6941 paused last week just ahead of 61.8% projection of 0.6941 to 0.6511 from 0.6687 at 0.6421. But there is no sign of bottoming yet, not to mention even reversal. Firm break of 0.6421 would probably trigger another round of accelerated selloff, and pushes AUD/USD towards 100% projection at 0.6257, which is slightly below 0.6269 (2023 low).
In Europe, at the time of writing, FTSE is down -0.04%. DAX is down -0.56%. CAC is down -0.45%. UK 10-year yield is up 0.0382 at 4.509. Germany 10-year yield is up 0.043 at 2.398. Earlier in Asia, Nikkei fell -1.09%. Hong Kong HSI rose 0.77%. China Shanghai SSE fell -0.21%. Singapore Strait Times fell -0.32%. Japan 10-year JGB yield rose 0.0012 to 1.076.
ECB's Makhlouf: Pretty overwhelming evidence needed for 50bps cut in Dec
Irish ECB Governing Council member Gabriel Makhlouf signaled caution today, emphasizing that an interest rate cut at the December 12 meeting is not guaranteed.
“It would be going a bit far to say an ECB interest rate cut next month is 'in the bag,'” he stated, adding that the evidence s would need to be "pretty overwhelming" for a more aggressive 50bps reduction.
Makhlouf also addressed the uncertainty surrounding the impact of US President-elect Donald Trump’s administration on inflation dynamics. He stressed that it would be "premature" to base monetary policy decisions on assumptions about Trump’s fiscal and trade policies, stating, “I do think it would be premature to come to conclusions as to exactly what it is that the new US administration is going to do.”
Eurozone goods exports rises 0.6% yoy in Sep, imports falls -0.6% yoy
Eurozone goods exports rose 0.6% yoy to EUR 237.8B in September. Goods imports fell -0.6% yoy to EUR 225.3B. Trade balance reported a EUR 12.5b surplus. Intra-Eurozone trade fell -1.0% yoy to EUR 215.5B.
In seasonally adjusted term, goods exports rose 0.4% mom to EUR 237.6B. Goods imports fell -0.8% mom to EUR 224.1B. Trade balanced reported EUR 13.6B surplus, larger than expectation of EUR 7.9B. Intra-Eurozone trade fell -0.9% mom to EUR 212.9B.
BoJ's Ueda highlights wages as key inflation driver, reaffirms tightening path
BoJ Governor Kazuo Ueda reiterated in a speech today that the central bank remains committed to its gradual policy tightening path, conditional on the realization of its economic and price outlook. However, the timing of adjustments will depend on evolving "economic activity and prices" as well as "financial conditions."
Ueda stated that monetary policy decisions would hinge on assessments at each Monetary Policy Meeting, taking into account the latest data and projections. Key considerations include underlying inflation trends and financial conditions, with a focus on balancing risks to economic activity.
On inflation, Ueda highlighted that the effects of previous cost pass-throughs from higher import prices are waning. However, he noted that "inflationary pressure stemming from wage increases is projected to strengthen" as economic activity and wage growth remain robust.
While underlying inflation currently lags the 2% target, it is expected to rise moderately and align with the price stability target in the second half of the projection period through fiscal 2026.
NZ BNZ services rises to 46, still extremely challenging conditions
New Zealand’s BusinessNZ Performance of Services Index rose slightly from 45.7 to 46.0 in October. Despite the marginal improvement, the index stayed well below the 50 threshold, indicating ongoing contraction in the sector for a fourth consecutive month. The result also falls significantly short of the long-term average of 53.1.
The proportion of respondents reporting negative sentiment increased from 58.5% to 59.1%. Concerns about the cost of living and broader economic challenges continued to dominate.
BNZ Senior Economist Doug Steel emphasized the sector's struggles, stating that “although it is contracting at a much slower pace than it was in June (when the PSI was 41.1), the PSI has been hovering between 45 and 46 over the last four months.” He noted that while some business surveys indicate an improving outlook, current conditions remain "extremely challenging”.
USD/JPY Mid-Day Outlook
Daily Pivots: (S1) 153.18; (P) 154.97; (R1) 156.07; More...
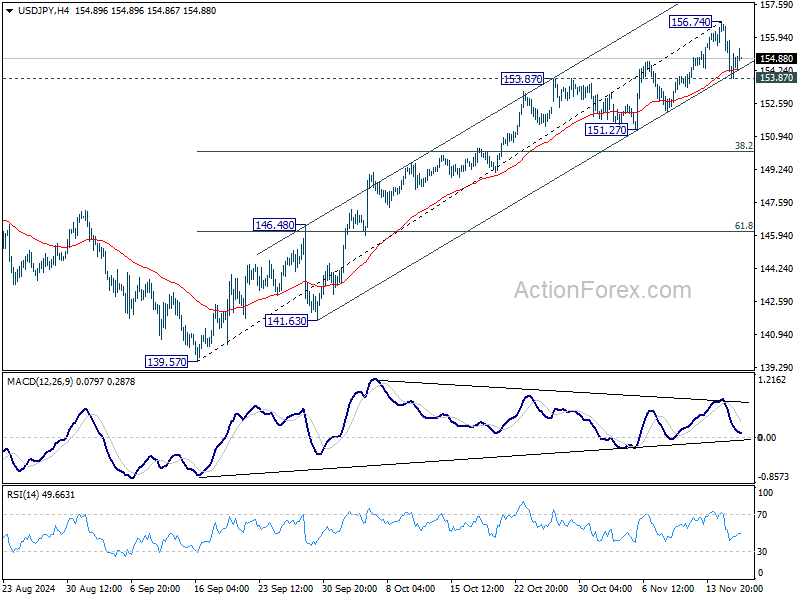
Intraday bias in USD/JPY remains neutral for the moment. Another rise is in favor as long as 153.87 resistance turned support holds. Break of 156.74 will resume the rally from 139.57 towards 161.91 high. However, firm break of 153.87 and the near term rising channel would confirm short term topping. In this case, intraday bias will turn back to the downside for 151.27 support, or even further to 38.2% retracement of 139.57 to 156.74 at 150.18.
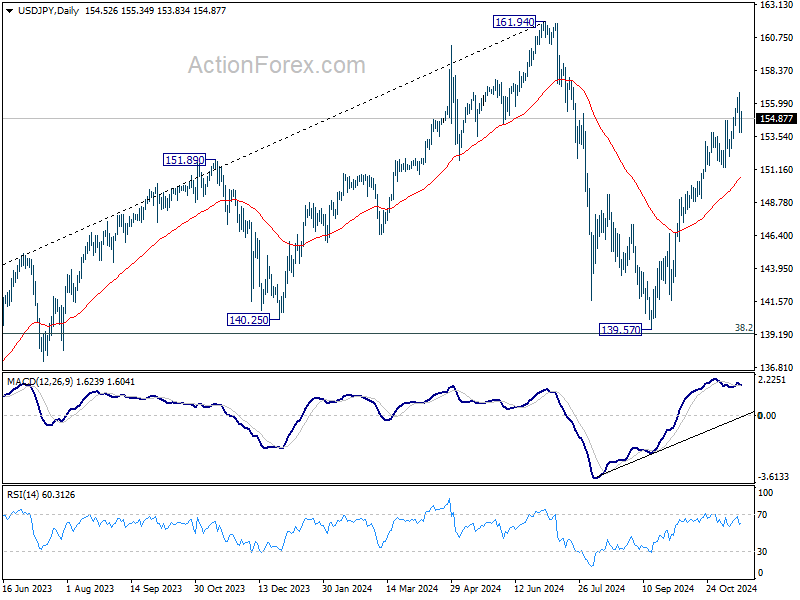
In the bigger picture, price actions from 161.94 are seen as a corrective pattern to rise from 102.58 (2021 low). The range of medium term consolidation should be set between 38.2% retracement of 102.58 to 161.94 at 139.26 and 161.94. Nevertheless, sustained break of 139.26 would open up deeper medium term decline to 61.8% retracement at 125.25.
XAU/USD Outlook: Gold Price Bounces from Two-Month Low
Bears are taking a breather after two-week pullback (down 6.5%) from new record high found footstep at $2540 zone (contained by rising 100DMA).
Gold price bounced from new two-month low on Monday after pullback faced strong headwinds from Fibo 50% of $2293/$2790 upleg and nearby daily Ichimoku cloud base, boosted by a pause in dollar’s recent strong rally.
Fresh gains eye initial pivots at $2600/11, former strong supports, reverted to solid resistances (broken Fibo 38.2% / psychological / daily cloud base), violation of which is needed to generate initial reversal signal and shift near term focus to the upside.
Recovery after the biggest weekly loss in more than three years (gold price was down 4.5% last week, strongly deflated by signals of Fed’s less aggressive stance on interest rates cuts ) still requires more information about the US central bank’s near-term rate trajectory, to generate clearer direction signal.
Sustained break above $2600 to ease downside pressure, however, rise through next technical barriers at $2633 (Fibo 38.2% of $2790/$2536 pullback / 10DMA) and extension through $2663 (50% retracement / daily Kijun-sen) to validate signal.
Also, deteriorating geopolitical situation on US’s green light for potential missile attacks deeply into Russian territory and their subsequent response that may lead into immeasurable escalation of the war in Ukraine, could be very supportive to safe-haven gold.
Res: 2600; 2611; 2643; 2663.
Sup: 2564; 2536; 2524; 2500.
New Zealand Dollar Slips to One-Year Low on Weak Services PSI
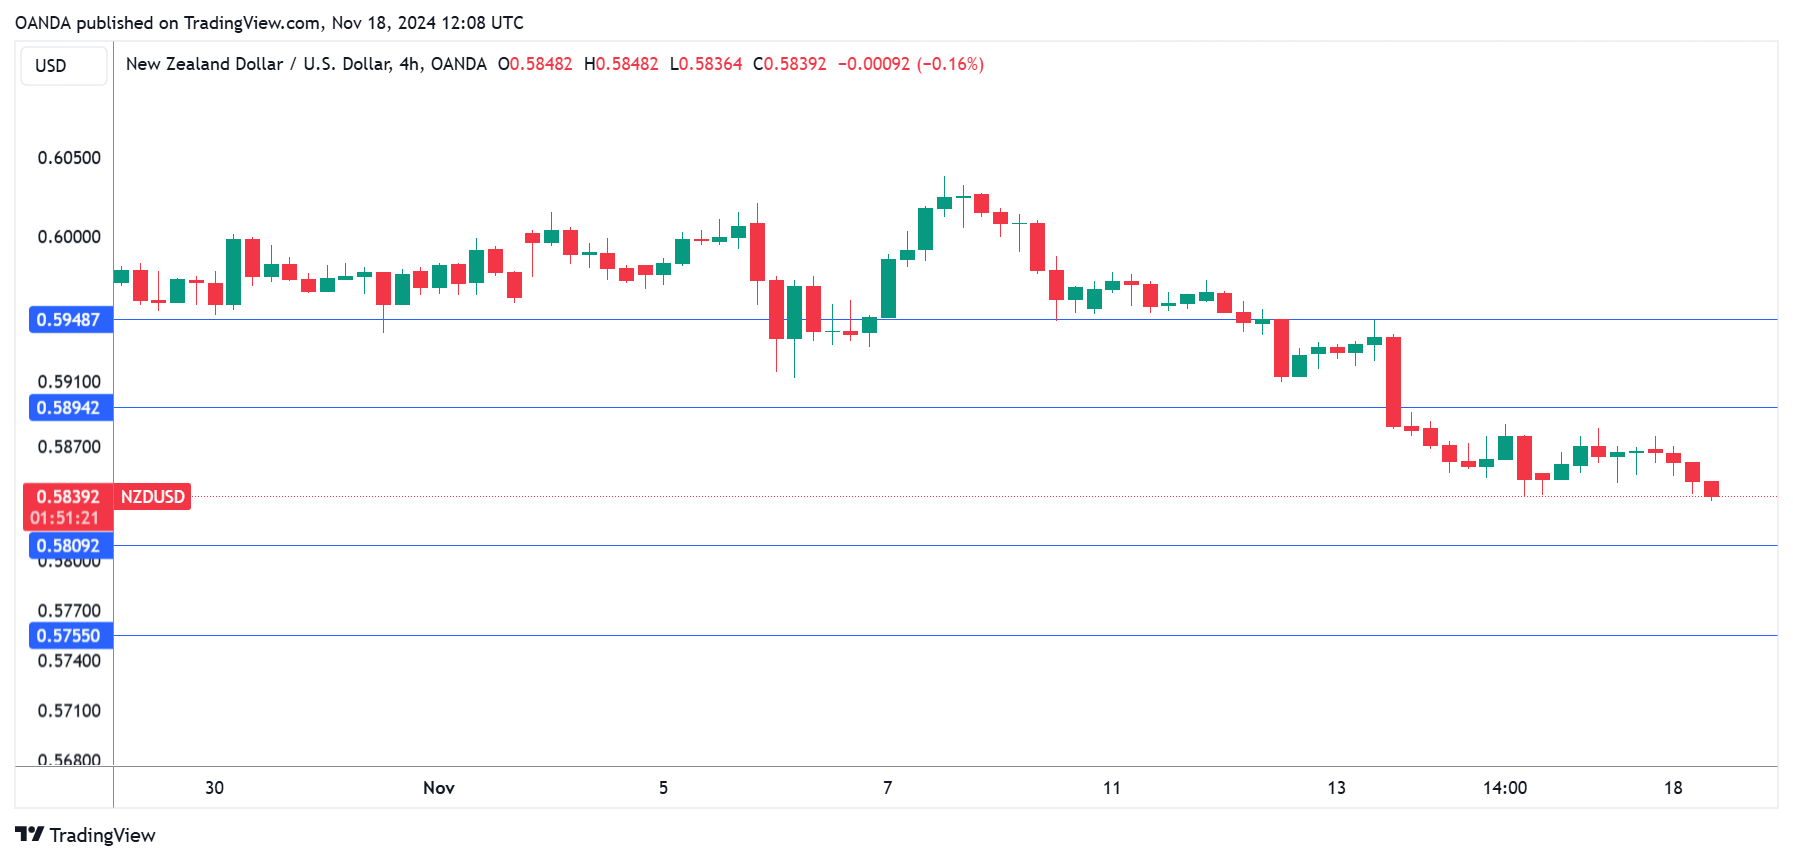
The New Zealand dollar has started the trading week with losses. In the European session, NZD/USD is trading at 0.5837, down 0.50% on the day. This is the New Zealand dollar’s lowest level since November 2023.
New Zealand Services PMI stuck in contraction mode
New Zealand Services PMI inched upwards in October but remains in contraction mode. The reading of 46.0 was higher than the September reading of 45.7 but shy of the forecast of 47.0. Services activity has contracted for eight straight months as the economy continues to sputter. The survey found that the major concerns of respondents were the cost of living and economic conditions.
The Reserve Bank of New Zealand has shown it can be aggressive as it chopped interest rates by 50 basis points in October, bringing the cash rate to 4.75%. This move was expected yet the New Zealand dollar still plunged almost 1% in response to the dramatic move. The RBNZ meets next on Nov. 27 and the markets are expecting more strong medicine in the form of another oversized 50-bp cut to stimulate the economy. This would likely put strong downward pressure on the wobbly New Zealand dollar.
US retail sales stronger than expected
The week ended on a positive note as US retail sales were better than expected in October. Monthly, retail sales rose 0.4%, better than the market estimate of 0.3% and following a September gain of 0.8% that was revised from 0.4%. Annually, retail sales posted a strong gain of 2.8%, up from an upwardly revised gain of 1% in September and blowing past the forecast of 1.9%.
The strong data for September and October has lowered the odds of a rate cut in December, which are currently around 60%. On Thursday, prior to the retail sales report, Fed Chair Powell said that “the economy is not sending any signals that we need to be in a hurry to lower rates”.
NZD/USD Technical
- There is resistance at 0.5894 and 0.5948
- 0.5809 and 0.5755 are the next support levels
ECB’s Makhlouf: Pretty overwhelming evidence needed for 50bps cut in Dec
Irish ECB Governing Council member Gabriel Makhlouf signaled caution today, emphasizing that an interest rate cut at the December 12 meeting is not guaranteed.
“It would be going a bit far to say an ECB interest rate cut next month is 'in the bag,'” he stated, adding that the evidence s would need to be "pretty overwhelming" for a more aggressive 50bps reduction.
Makhlouf also addressed the uncertainty surrounding the impact of US President-elect Donald Trump’s administration on inflation dynamics. He stressed that it would be "premature" to base monetary policy decisions on assumptions about Trump’s fiscal and trade policies, stating, “I do think it would be premature to come to conclusions as to exactly what it is that the new US administration is going to do.”
Bitcoin’s Price Has Risen by About 30% Since the Start of the Month
As the BTC/USD chart indicates:
→ At the start of November, Bitcoin’s price was around the $70,000 level.
→ Today, a single coin is trading for approximately $92,000.
On 12 November, when we last analysed Bitcoin’s price, we:
→ Highlighted factors driving bullish sentiment.
→ Identified a long-term ascending channel.
→ Predicted a potential correction after surpassing the psychological $90k level.
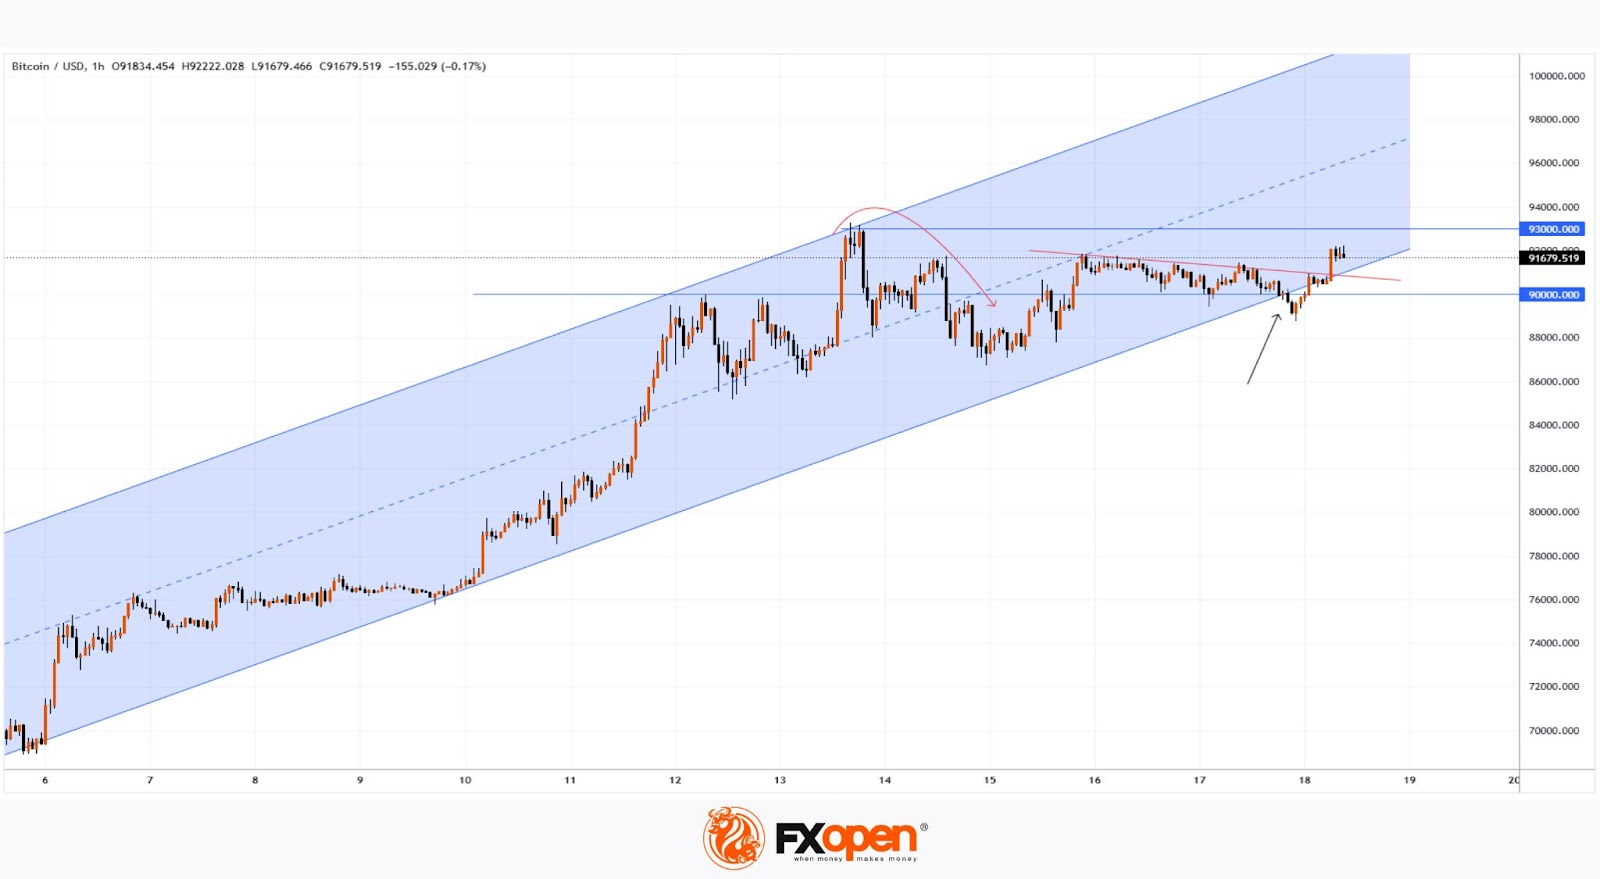
Now, let’s focus on the technical analysis of the hourly BTC/USD chart, which shows that:
→ Since 5 November (when confirmations of Trump’s election victory started emerging), the price has formed a steep ascending channel (marked in blue).
→ Indeed, the bulls failed to firmly establish themselves above the psychological level, resulting in a correction (marked with a red arrow) last week.
→ The lower boundary of the blue channel acted as support (indicated by the black arrow), allowing the bulls to attempt a trend recovery and achieve their first milestone—breaking a local descending trendline (marked in red).
It is possible that bullish progress will continue, potentially bringing Bitcoin closer to the significant $100,000 mark per coin.
FXOpen offers the world's most popular cryptocurrency CFDs*, including Bitcoin and Ethereum. Floating spreads, 1:2 leverage — at your service. Open your trading account now or learn more about crypto CFD trading with FXOpen.
*At FXOpen UK and FXOpen AU, Cryptocurrency CFDs are only available for trading by those clients categorised as Professional clients under FCA Rules and Professional clients under AFSL 412871 – ABN 61 143 678 719 respectively. They are not available for trading by Retail clients.
This article represents the opinion of the Companies operating under the FXOpen brand only. It is not to be construed as an offer, solicitation, or recommendation with respect to products and services provided by the Companies operating under the FXOpen brand, nor is it to be considered financial advice.
Eurozone goods exports rises 0.6% yoy in Sep, imports falls -0.6% yoy
Eurozone goods exports rose 0.6% yoy to EUR 237.8B in September. Goods imports fell -0.6% yoy to EUR 225.3B. Trade balance reported a EUR 12.5b surplus. Intra-Eurozone trade fell -1.0% yoy to EUR 215.5B.
In seasonally adjusted term, goods exports rose 0.4% mom to EUR 237.6B. Goods imports fell -0.8% mom to EUR 224.1B. Trade balanced reported EUR 13.6B surplus, larger than expectation of EUR 7.9B. Intra-Eurozone trade fell -0.9% mom to EUR 212.9B.
AUD/USD Stabilises Amid RBA’s Hawkish Outlook
AUD/USD is showing signs of stabilisation near 0.6465, marking its second consecutive session of attempts to recover.
The Australian dollar finds some support from the hawkish comments made by Reserve Bank of Australia (RBA) Governor Michele Bullock. Bullock stated that interest rates are restrictive and will remain so until the RBA is fully assured of the inflation outlook.
Investors are keenly awaiting the publication of the minutes from the last RBA meeting, which is expected this week. The minutes will provide deeper insights into the RBA’s future policy actions.
Additionally, upcoming releases on November’s industrial and services sector data could further influence the Australian dollar’s trajectory.
Despite these supportive factors, AUD/USD remains near three-month lows, pressured by a strengthening US dollar. The US dollar has benefited from expectations that the Federal Reserve might opt for a more minor rate cut amid robust economic forecasts under President Donald Trump’s administration.
Technical analysis of AUD/USD
On the H4 chart of AUD/USD, the market has formed a broad consolidation range around the 0.6565 level. Currently, the market has broken through the lower boundary of this range. Today, a narrower consolidation range has developed around the 0.6464 level. It is relevant to consider the probability of a downward breakout from this range, which could lead to a further downward movement towards the 0.6333 level, with the potential for the trend to continue to 0.6233, the local target. Technically, this scenario is supported by the MACD indicator, as its signal line is below zero and pointing downwards.
On the H1 AUD/USD chart, the market continues to form a narrow consolidation range around 0.6464. In case of a downside breakout, we anticipate the second half of the downward wave continuing, targeting 0.6333. Conversely, a corrective move towards 0.6500 is possible if the market breaks upwards. The downward trend is expected to extend towards 0.6233 in the longer term. Technically, this scenario is supported by the Stochastic oscillator, with its signal line positioned below the 80 mark and pointing down towards 20.
Altcoins Gain Momentum
Market Picture
The crypto market capitalisation hit a new high of $3.09 trillion on Monday morning (+1% in 24 hours), driven by altcoins. The Cryptocurrency Fear and Greed Index reached 90 over the weekend, with the index only higher in late 2020 and early 2021. By Monday, the index had fallen back to 83, still consistent with extreme greed.
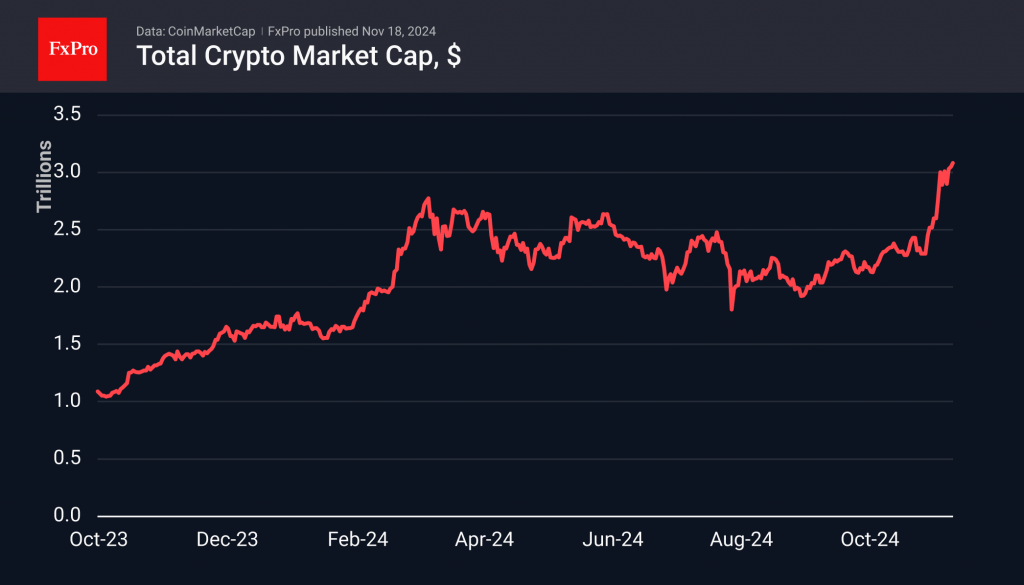
The Altcoin Season Indicator has now risen from 23 on 4th November to 42, thanks to optimism around XRP and Dogecoin. Cardano is also gaining momentum.
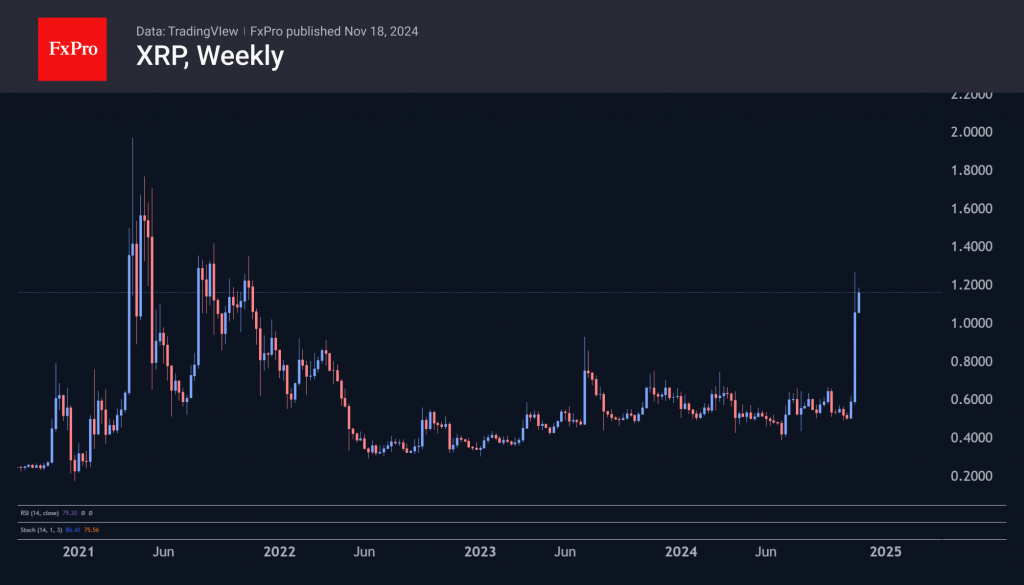
XRP topped $1 for the first time in three years. On Saturday, the token climbed above $1.2, as it is sensitive to Gary Gensler’s possible departure. Under his leadership, Ripple has been in a constant legal battle with the SEC.
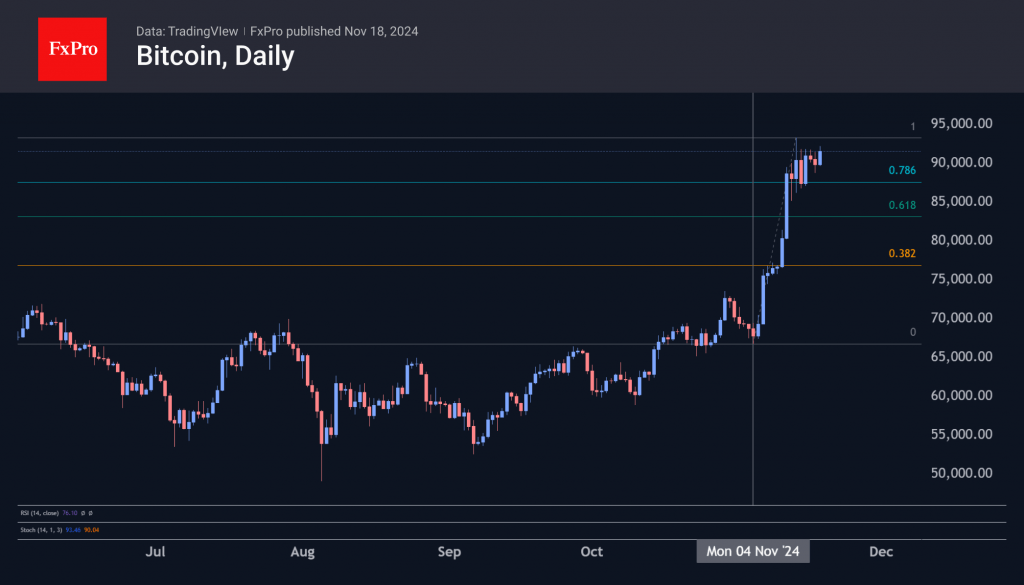
Bitcoin drifted down 3% on Saturday and Sunday, but on Monday, a 4% surge above $91,500 took it above this consolidation area. Institutional traders are activating at a time when retail traders are starting to lock in profits in Bitcoin and moving into altcoins.
Cryptocurrencies are perhaps the most notable market where retail is profiting at the expense of institutional rather than the other way around.
News Background
According to SoSoValue, net inflows into US spot Bitcoin ETFs totalled $1.67 billion last week, marking the sixth consecutive week of net inflows. Cumulative inflows since the launch of bitcoin ETFs in January rose to $27.46 billion.
Ethereum ETFs saw net inflows of $515.2 million last week, a record high since the funds were approved on 23rd July, which brings the total net inflows since the product launch to $178.4 million.
The distribution of implied volatility in the Bitcoin options market suggests a high probability of trading at lower levels. “The deleveraging risk could be significant,” Blofin warned.
A bill to create a Bitcoin reserve is up for a vote in the US Congress. It involves purchasing 1 million BTC (up to 200,000 BTC per year for five years). The Fed’s gold reserves will be used for this purpose. Speculation on this issue could be an important driver of Bitcoin’s rise against gold.
Solidion Technology, a manufacturer of electric batteries and components, announced that it will convert some of its cash reserves into bitcoin. The company plans to use 60% of its excess cash, all of its money market interest income and some of its future capital raising to buy the first cryptocurrency.
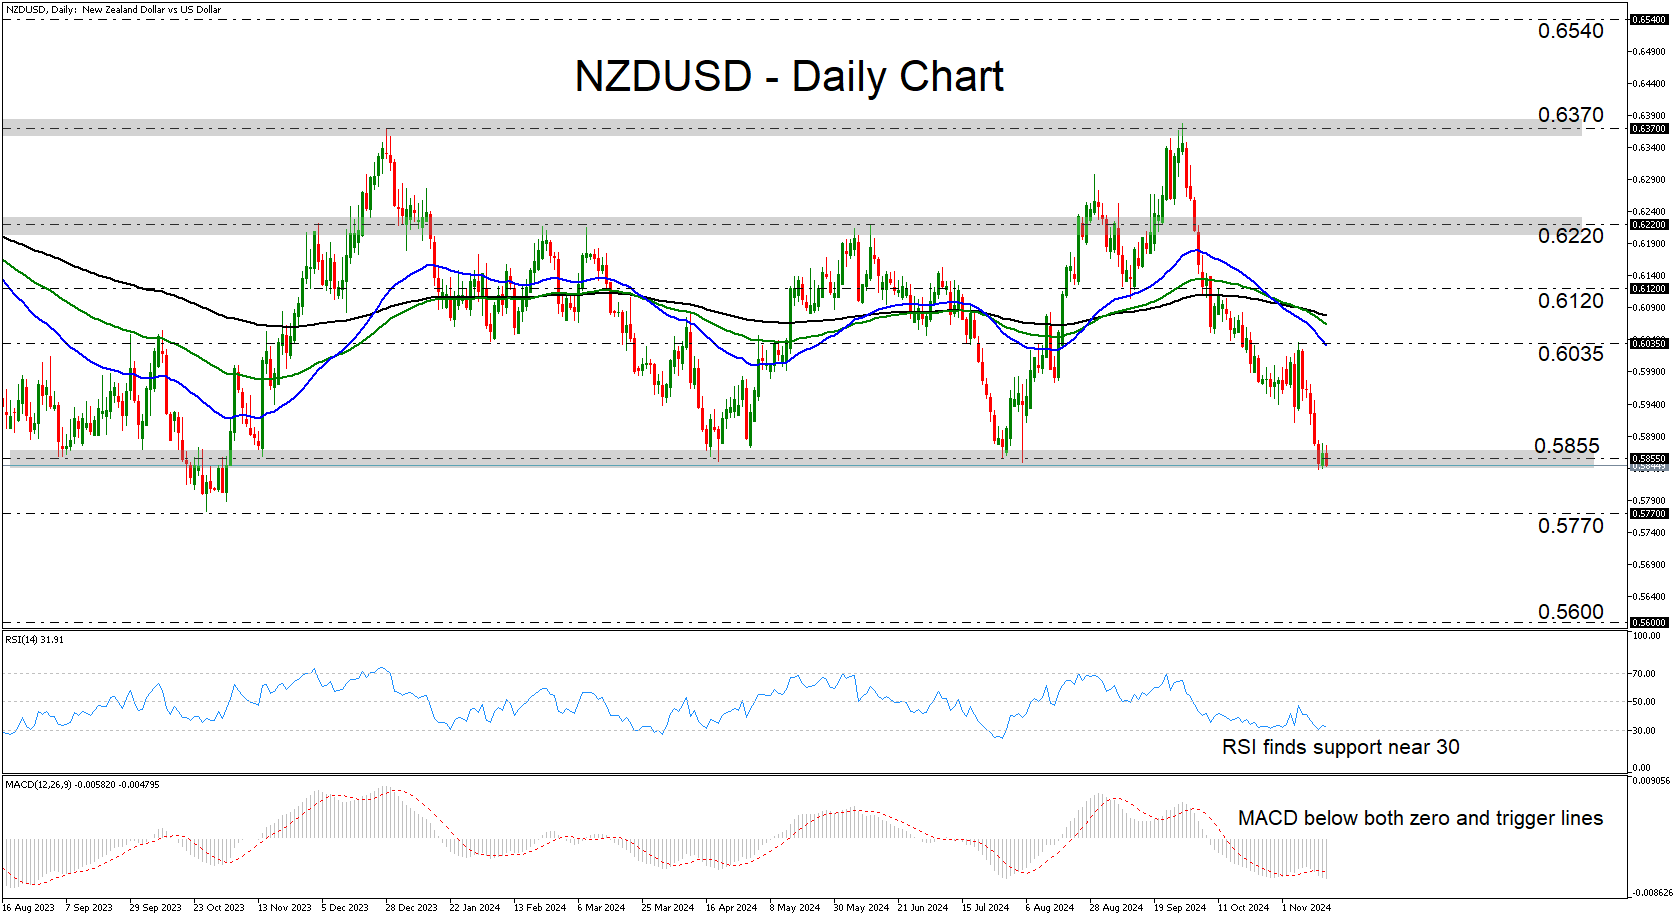
NZDUSD Bears Try to Escape a Range
- NZDUSD has been trading sideways for more than a year
- Bears try to push below the key support of 0.5855
- RSI and MACD detect bearish momentum
- For the outlook to brighten, a move above 0.6220 may be needed
NZDUSD has been falling since September 30, when it hit resistance near the 0.6370 zone, which stopped the bulls back in December 2023 as well. Overall, though, most of the price action had been contained between the 0.5855 and 0.6220 zones since July 2023, suggesting a neutral broader outlook.
That said, today, the bears seem willing to push the battle below the 0.5855 territory, a move that may pave the way towards the low of October 26, 2023, at around 0.5770. If they are not willing to surrender there, they may then decide to dive all the way down to the 0.5600 barrier, marked by the low of October 21, 2022.
Both the RSI and the MACD detect negative momentum. The former is lying near its 30 line, while the latter has been running below both its zero and trigger lines since last Tuesday. Nonetheless, the RSI has been repeatedly respecting its 30 line as support, which raises the likelihood for a potential rebound before the next leg south.
If the recovery extends above 0.6035 though, this may be a sign that traders do not want to exit the range yet. The bulls may gain enough confidence to target the 0.6120 zone, the break of which could carry extensions towards the upper end of the aforementioned range at 0.6220. That said, for the picture to become brighter, a break higher may be needed.
To sum up, NZDUSD has been trading in a trendless mode for more than a year, but the bears are now attempting to break lower. It will be interesting to see whether a move below 0.5855 will lead to larger declines.
Gold Bulls Make a Move; Need Access Above 2,600
- Gold makes recovery attempt after aggressive sell-off
- Technical signals welcome a bullish pivot but there is a wall at 2,600
Gold bounced up on Monday with scope to test the 2,600 round level after its two-week freefall paused near the constraining zone of 2,545.
The precious metal has retraced half of its record rally from June to October and signs of an oversold market are beginning to emerge, with the RSI and the stochastic oscillator currently looking for a pivot near 30 and 20 respectively.
However, for the bulls to encourage fresh buying they must first re-enter the broad bullish channel above 2,600, where the 38.2% Fibonacci mark is also placed. If their efforts prove successful, they could send the price toward the 50-day simple moving average (SMA) and the 23.6% Fibonacci of 2,672, while higher, they may attempt to cross the 2,750 border if the 2,700 area gives way.
In the bearish scenario, where the floor at 2,545 cracks, support could next come somewhere between the 61.8% Fibonacci of 2,483 and the restrictive line at 2,445. Failure to rotate there could see gold sinking toward the 200-day SMA for the first time in a year.
Overall, if the Elliot wave theory is still in play, the price might have entered a temporary corrective phase after completing its five bullish sub-waves (i-v).
Summing up, gold is currently displaying positive momentum, though to convince new buyers to enter the market in the short-term, it must first establish a strong foothold above 2,600. Until then the market may remain in a holding pattern.
