
Sample Category Title
EUR/GBP Daily Outlook
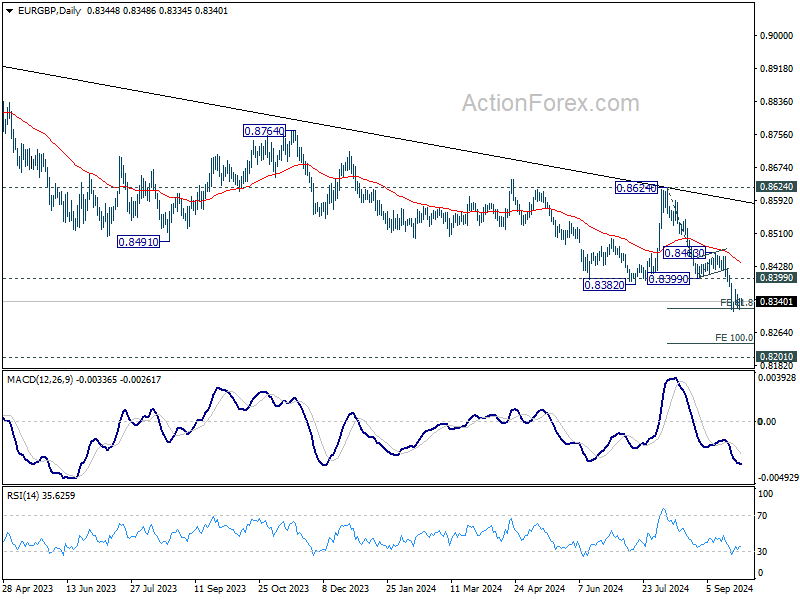
Daily Pivots: (S1) 0.8330; (P) 0.8340; (R1) 0.8358; More...
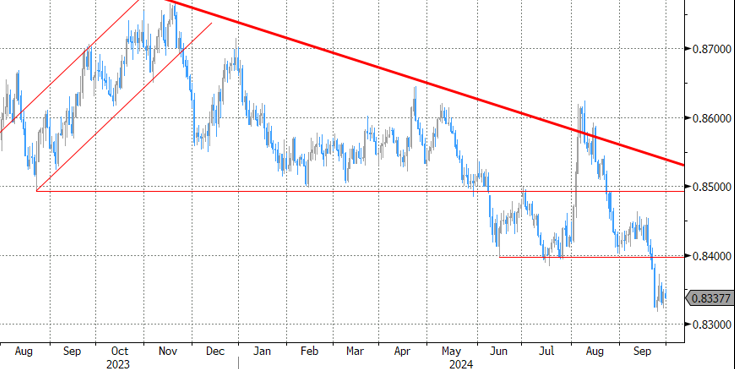
Intraday bias in EUR/GBP remains neutral for the moment, and more consolidations could be seen above 0.8316. Outlook will stay bearish as long as 0.8399 support turned resistance holds. On the downside, below 0.8316 will resume the fall from 0.8624 to 100% projection of 0.8624 to 0.8399 from 0.8463 at 0.8237 next.
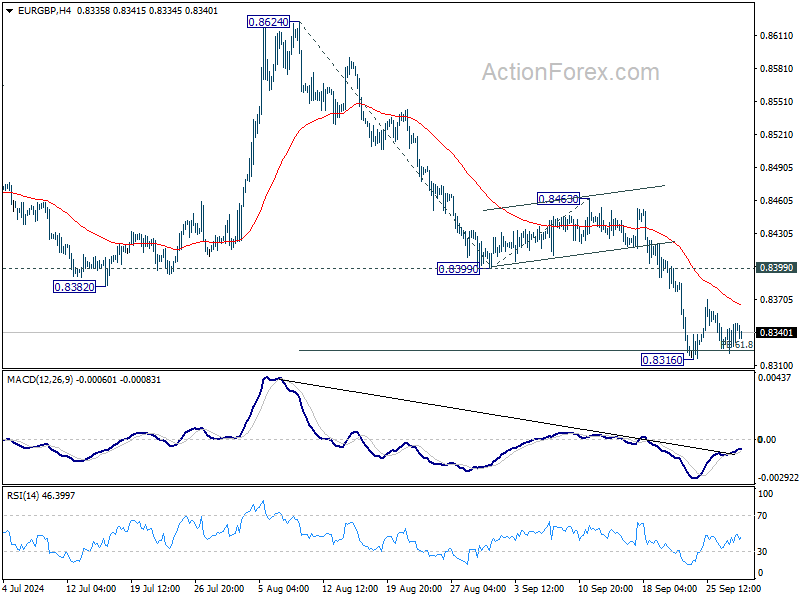
In the bigger picture, down trend from 0.9267 (2022 high) is in progress. Next target is 0.8201 (2022 low), but strong support should be seen there to bring rebound. However, outlook will remain bearish as long as 0.8624 resistance holds even in case of strong rebound.
EUR/AUD Daily Outlook
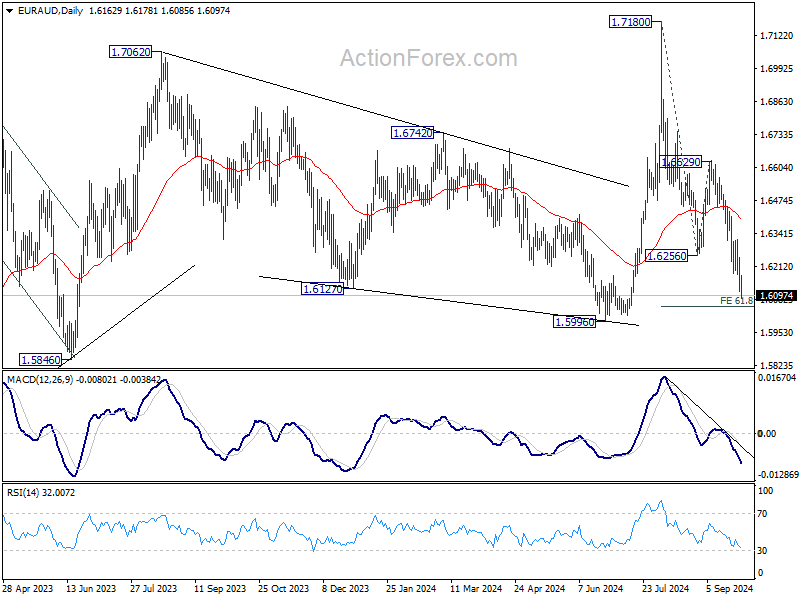
Daily Pivots: (S1) 1.6112; (P) 1.6181; (R1) 1.6245; More...
Intraday bias in EUR/AUD remains on the downside. Fall from 1.7180 is in progress for 61.8% projection of 1.7180 to 1.6256 from 1.6629 at 1.6058, and possibly below. But strong support should be seen from 1.5996 to contain downside and bring rebound. On the upside, above 1.6249 minor resistance will turn intraday bias neutral first.
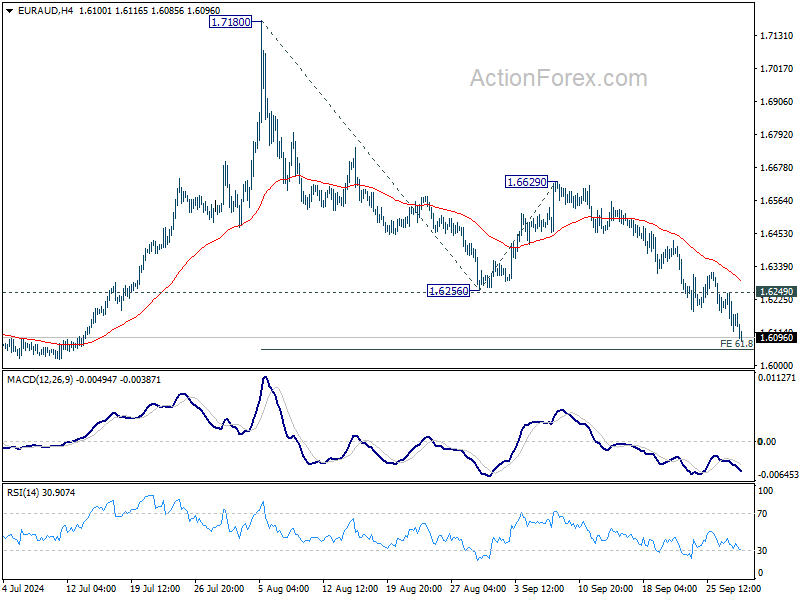
In the bigger picture, outlook is mixed up by the deeper than expected fall from 1.7180. Yet as long as 1.5996 support holds, up trend from 1.4281 (2022 low) is still in favor to resume at a later stage. However, decisive break of 1.5996 will argue that the medium term trend has reversed.
GBP/JPY Daily Outlook
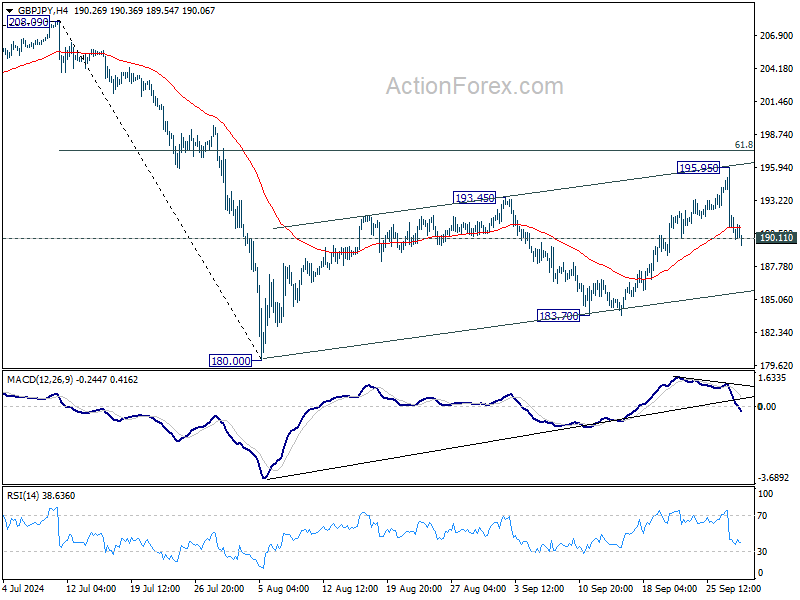
Daily Pivots: (S1) 188.10; (P) 192.03; (R1) 194.06; More...
GBP/JPY's break of 190.11 support suggests that corrective pattern from 180.00 has completed with three waves up to 195.95 already. Intraday bias is now on the downside. Deeper decline would be seen back to 183.70 support next. For now, risk will stay on the downside as long as 195.95 resistance holds, in case of recovery.
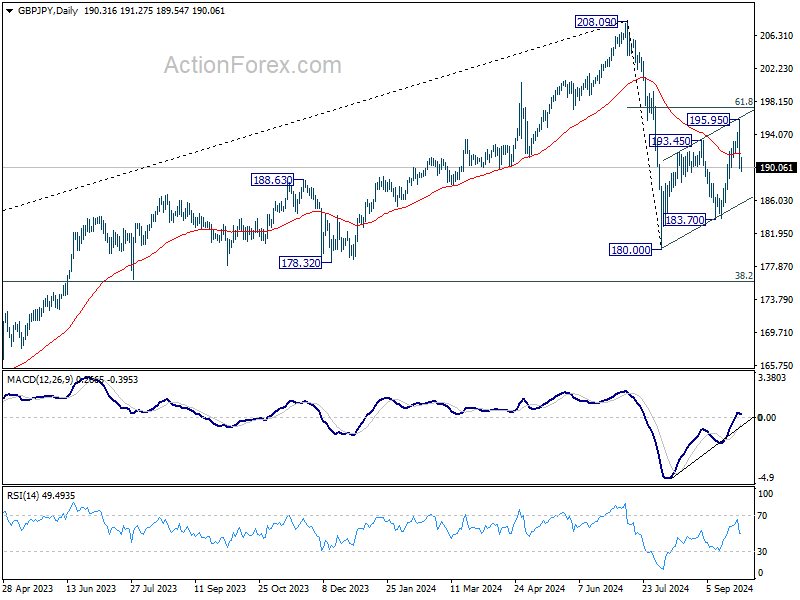
In the bigger picture, price actions from 208.09 are seen as a correction to whole rally from 123.94 (2020 low). The range of consolidation should be set between 38.2% retracement of 123.94 to 208.09 at 175.94 and 208.09. However, decisive break of 175.94 will argue that deeper correction is underway.
A Big Day and Big Week Ahead
Markets
We have a big day and big week ahead in terms of eco data and central bank speeches. EMU headline inflation (tomorrow) is on track to drop below the ECB’s 2% inflation target for the first time since June 2021 following downward surprises in French and Spanish readings end last week. German figures are released today. The September drop is mainly energy-inspired though as ECB President Lagarde suggested already at the Q&A session of the previous ECB meeting: “We are looking at a whole battery of indicators. And I’m saying that in particular because September will certainly deliver a low reading of inflation. Very likely. We expect, because of the base effect, particularly on energy, our inflation numbers to be up in the fourth quarter, so the last three months of 2024. But September is going to deliver a low reading.” While EMU money markets have been eager to nearly fully discount a 25 bps October ECB rate cut on the back of these softer national CPI readings and weak September PMI’s, we still tend to err on the side of the status quo. Unless the ECB president herself convinces us otherwise at an hearing in front of the European parliament later today.
The US eco calendar kicks off with the September Chicago PMI and with a speech by Fed Chair Powell at the National Association for Business Economics after European close. We are looking for clues in the comments (and the rest of this week’s figures) to strengthen our 50 bps Fed rate cut call for November. US money markets are currently evenly split between a 25 bps and a 50 bps scenario. That means room for market moves with a potential bull steepening of the US yield curve, a narrowing of the short-term spread differential between the US and Europe and a continuation of the sell-on-upticks in the greenback. Other eco data to spark volatility later this week are JOLTS job openings and manufacturing ISM (tomorrow), ADP employment change (Wednesday), weekly jobless claims and services ISM (Thursday) and payrolls (Friday). Unionized dockworkers are likely to start with strikes in many East Coast and Gulf Coast ports as their labor contracts expire today which is a wildcard for this week. They remain at odds with employers over the level of pay increases, with unions pushing for a 77% increase for workers over six years. West Coast port workers last year secured a 32% increase.
Chinese stock markets surge another whopping 8-10% this morning after three major cities eased rules on housing purchases. That makes a 25% gain for the CSI 300 since authorities started rolling out stimulus measures last week.
News & Views
Austria’s Freedom Party emerged as the biggest party after yesterday’s national elections. The far-right party is estimated to have secured 56 seats out of the 183 up for grabs. All other traditional parties, however, have vowed not to work with the group and instead look to each other for creating an at least 92-seat majority. The People’s Party and the Social Democrats have been the default option, making up more than half of Austria’s governments since WWII. This time around, though, they won 93 seats, making it a very fragile coalition. They could include a third party, most likely the liberal NEOS (18 seats) but finding common ground won’t be easy. Austria already has a tradition for negotiations to take months and talks may stretch well into next year. The outgoing coalition (People’s Party and the Greens) continues to govern in the meantime.
Flanders has formed a government over the weekend, almost four months since the June 9 elections. Matthias Diependaele from the Flemish nationalists N-VA will lead a coalition government that also include Vooruit’s Socialists and the Christian-Democrats. All parties have greenlighted the coalition agreement in the meantime. Some of the most high-profile policy changes include lower taxes for first-home buyers and for small-to-medium sized inheritances, job placement reforms & an easing of the home energy efficiency renovation rules. In addition, the new Flemish government will introduce a traffic tax for EV’s while removing the subsidies for buying one. A previously made pledge to ban the sale of combustion engines by 2029 is scrapped. A whopping €1bn is rolled out for daycare and another €300mln for elder care. The Flemish government also announced an industrial strategy (R&D and innovation). The agreement on the Flemish level potentially strengthens the three-party bloc in the still-ongoing negotiations on a federal level.
Graphs
GE 10y yield
The ECB cut policy rates by 25 bps in June and in September. Stubborn inflation (core, services) make follow-up moves less evident. We expect the central bank to stick with the quarterly reduction pace. Disappointing US and unconvincing-to-outright-weak EMU activity data dragged the long end of the curve down. The move accelerated during the early August market meltdown.

US 10y yield
The Fed kicked off its easing cycle with a 50 bps move. It is headed towards a neutral stance now that inflation and employment risks are in balance. Conservative SEP unemployment forecasts risk being caught up by reality and with it the dot plot (50 bps more cuts in 2024). We hold our call for two more 50 bps cuts this year. Pressure on the front of the curve and weakening eco data keeps the long end in the defensive for now as well.
EUR/USD
EUR/USD moved above the 1.09 resistance area as the dollar lost interest rate support at stealth pace. US recession risks and bets on fast and large rate cuts trumped traditional safe haven flows into USD. An ailing euro(pean economy) only briefly offset some of the general USD weakness. EUR/USD’s dollar-driven ascent is nearing resistance around 1.12 again.
EUR/GBP
The BoE delivered a hawkish cut in August. Policy restrictiveness will be further unwound gradually on a pace determined by a broad range of data. The strategy similar to the ECB’s balances out EUR/GBP in a monetary perspective. But the economic picture is increasingly diverging to the benefit of sterling. EUR/GBP succumbed to horrible European September PMI’s. Support at 0.84 broke and brings the 2022 low (0.8203) on the radar.
More Stimulus Before Holiday
The week kicked off with another bull run in Chinese stocks on further stimulus news. This time, three major cities announced to ease homebuying rules to prop up their housing market. The Chinese Communications Constructions surged another 7% following a stellar week, the CSI 300 added another 6% and is up by 25% since the mid-September dip, and the HIS index gained another 3%. The Chinese will be going on national holiday in an excellent mood, and investors – though skeptical that the measures will help lifting the EM giant in the long run – could give some time to the measures to show in the economic data. But data-wise, we are not there just yet. The previous measures announced by the Chinese authorities have barely borne fruit. The Caixin manufacturing index for example unexpectedly shrank into the contraction zone in September, and the services PMI is on the edge, near the 50 level that differentiates expansion from contraction. The Chinese EV sales fell by 48% - and the EU hasn’t yet increased import tariffs on China-made EVs. But anyway, China and its investors are breathing a sigh of relief… the CSI 300 had its best week since 2008, after all. Iron ore is up by 25% since mid-September. And the good news from China and the rising iron ore prices give a decent support to the AUDUSD, preparing to test the 0.70 cents level as Australian stocks extend rally to fresh ATH.
Over in Europe, growth and China-sensitive European stocks are also having their share of the Chinese pie. The Stoxx 600 index closed the week at an ATH. LVMH gained 20% in just a week.
In separate news, inflation data from France and Spain came in lower than expected. Both data slipped below the European Central Bank’s (ECB) 2% policy target in September. German inflation numbers are due today and the Eurozone’s aggregate inflation update is due tomorrow. Softening inflation, combined with Europe’s gloomy economic outlook, has room to boost the ECB rate cut bets, and keep the EURUSD offered near the 1.12 level – even against a broadly softening US dollar.
Across the Channel, Cable consolidates a touch below the 1.34 level and the FTSE 100 is better bid. The Chinese stimulus news is good for the British mining stocks. Increased negative pressure on oil prices weighed on the index last week, after the news that Saudi Arabia was looking to change strategy and focus on increasing its market share rather than trying to prop up oil prices by restricting output. The good news is, even oil seems to be boosted by the Chinese stimulus news since last Friday. Support is building near the $67pb level in WTI.
In Japan, mood is totally different since last Friday. Last week’s elections in Japan resulted in a surprise win of Shigeru Ishiba, who is known for his preference for higher interest rates. The USDJPY tumbled from above 146 to around 142 last Friday and is consolidating gains near this level, the Nikkei index tumbled more than 5% on Friday, sank below its 200-DMA, tested the 50-DMA to the downside and is back to around the 200-DMA this Monday morning. The 3% slump in industrial production in August certainly helped taming the yen bulls, but the rest of the data was good enough to keep the downside pressure in the USDJPY intact; the 140 level is totally within the reach of the yen bulls, especially given the sustained selling pressure on the US dollar, worldwide.
In the US, the data released on Friday printed a set of soft inflation data. The core PCE index, the Federal Reserve’s (Fed) favourite gauge of inflation, came in line with expectations on a yearly basis, and slightly lower than expected, and softer than last month on a monthly basis. The latter reinforced the expectation that the Fed’s next move could be a second 50bp cut. That probability currently stands at 55%, the US 2-year yield remains under pressure, and the major stock indices consolidate near their ATH levels. Friday’s PCE data didn’t spark a fresh wave of buying in the S&P500, but the index renewed record a few times during the course of last week, and the Dow Jones pushed to a fresh high on Friday.
This week, the attention shifts to the US jobs data – expected to print another NFP figure near 140Ks, the unemployment rate is seen stable near the 4.2% while the average earnings may have eased significantly from 3.8% to 3.3% on a yearly basis. A soft set of jobs data should keep the Fed doves in charge of the market.
Elsewhere, the US ports along the East and Gulf coasts are about to go into a strike this Tuesday, as the unions demand higher pay. The market doesn’t seem much worried for now, as most goods are believed to be already in for the upcoming holiday shopping season, but a strike is never good news for supply chains and prices. An extended period of disruption in ports could boost the prices of goods that flow into the country from these ports and generate an upward pressure on inflation.
An Eventful Week Ahead
In focus today
Focus is on the German inflation data for September. Last week both the French and the Spanish inflation prints came in lower than expected and it will be very interesting to see if this is echoed in the German data.
Focus for the remainder of the week will primarily be on the euro area inflation data for September on Tuesday and the US September Jobs Report on Friday. Ahead of the labour market report, September ISM manufacturing and services indices together with August JOLTs data will also be due for release. The Polish Central Bank announces its base rate on Wednesday. Moreover, in China the National Day holiday starts on Tuesday and lasts for seven days.
Economic and market news
What happened overnight
In China, the private sector Caixin PMI indices declined in September, with the manufacturing gauge falling to 49.3 (August: 50.4), and the services leg edging down to 50.3 (August: 51.6). The official PMIs from NBS were also released, with the manufacturing PMI improving slightly in September to 49.8 (August: 49.1) - the highest print in five months. The non-manufacturing index dropped to 50.0 from 50.3 in August, while the composite measure increased to 50.4 from 50.1. While the readings were generally to the soft side, indicating a challenged economy, we see upside risks to our growth estimate of 4.8% this year and next, given the massive stimulus measures announced last week.
What happened since Friday
In the US, the PCE price index in August stood at 2.2% y/y (0.1% m/m SA), while the core measure was to the soft side at 0.1% m/m SA (cons: 0.2% m/m). The seasonally adjusted monthly core services PCE inflation remained steady and close to June-July pace (0.23% m/m, from 0.24%). On an annual basis, core services inflation picked up slightly to 3.8% (from 3.7%), which is still somewhat above average pre-pandemic pace (circa 2.5%). The downside surprise was mostly driven by the core goods component (-0.17% m/m SA), where deflation has been observed for quite a while now. Overall, a non-dramatic reading, with a muted market reaction as well.
Revised data from the University of Michigan showed consumer sentiment rising to 70.1 in September from 67.9 in August. Inflation expectations were slightly mixed, with the 1-year outlook ticking down to 2.7% in September (August: 2.8%) and the 5-year gauge increasing to 3.1% (August: 3.0%).
In the euro area, both French and Spanish inflation data for September were weaker than expected. French HICP inflation fell to 1.5% y/y from 2.2% y/y in August (cons: 2.0%), driven by lower energy prices due to base effects and monthly declines. Momentum in French services inflation is softening somewhat, though the decline relates to the high prices increases in August due to the Olympics. Spanish HICP inflation declined to 1.7% y/y from 2.4% y/y in August (cons: 1.9%). The soft country readings support the ECB's confidence in inflation returning to target.
In Norway, the seasonally adjusted NAV-unemployment rate rose to 2.1% in September, indicating that the labour market remains relatively tight despite some recent weakness in employment and unfilled vacancies. Retail sales for August grew 0.1% m/m but seem to be trending moderately downward after extreme summer volatility and a pick-up in real wage growth. We still expect private consumption to pick up going forward, but the figures at least show moderate risk of an immediate boom in consumption.
In Japan, Shigeru Ishiba won the LDP leadership election on his fifth attempt and will become Japan's next prime minister. Some of his pledges include of cleaning up the ruling party, revitalising the economy and addressing security threats from powerful neighbours. On Sunday, Ishiba said that "monetary policy must remain accommodative as a trend given current economic conditions", while noting that rate decisions rest with the Bank of Japan (BoJ), with which the government will cooperate. Ishiba has previously criticized the BoJ's aggressive monetary easing.
In Middle East, Israel's killing of Hezbollah leader Nasrallah marks a significant escalation in the ongoing conflict. For now, we think all the signals coming from Iran point towards them still being reluctant to escalate and we think that will be the case.
Equities: Global equities were higher on Friday, buoyed by a rally in Chinese stocks, while the US markets ended lower. Last week, global equities overall saw gains, with the Chinese markets experiencing their best week since 2008; a story in its own right. It was particularly interesting to see materials and consumer discretionary sectors outperforming, while defensives and minimum volatility categories struggled. The massive shift in focus last week from the US, services, AI, lower inflation, and softer monetary policy to a resurgence driven by the traditional Chinese property market growth inverted the familiar equity leadership we have observed for a couple of years.
As discussed last week, when markets become very stretched and oversold, and key fundamentals are changing, reversals can occur dramatically. This was evident last week and has continued this morning as policy measures are overshadowing the weak service and manufacturing Caixin PMI data. Chinese stocks are surging, with increases of 3-5%, continuing their ascent. Conversely, the rest of Asia is mostly lower, with Japanese stocks declining almost 5% following the surprising election of Shigeru Ishiba as new prime minister. US and European futures are very close to unchanged. However, it is clear that Europe is benefiting far more from the uplifted sentiment in China than the US.
FI: EUR rates fell across the curve on Friday morning, as French/Spanish inflation figures came out markedly softer than expected. Part of the initial move faded through the session, but EUR swap rates were nevertheless 5-6bp lower across tenors by the close. Markets now price in 20bp ahead of the October meeting, and we agree that the recent data (inflation/PMIs) have moved the balance of risk in favour of another 25bp. Hence, we have changed our ECB call, now expecting the ECB to cut in October and December, before resuming to quarterly cuts in 2025. Our new profile also includes a rate cut in December 2025, thus bringing the deposit rate to 2% then.
FX: Last week marked the 4th consecutive week of a weaker USD, although the second half of Friday's session saw some support to the USD which closed the day unchanged. The yen had a strong session with USD/JPY declining four figures as Ishiba's unexpected LDP presidency win is seen as hawkish for BoJ prospects. The NOK was as one of last week's underperformers whereas the SEK found support broadly, with EUR/SEK trading below 11.30 and USD/SEK briefly touching new YTD lows below 10.05.
EUR/USD Faces Key Hurdle: Will It Break Through and Climb?
Key Highlights
- EUR/USD started a consolidation phase below the 1.1200 resistance.
- A key bullish trend line is forming with support at 1.1145 on the 4-hour chart.
- Gold rallied to a new high near $2,685 before it faced resistance.
- Bitcoin extended gains and traded above the $65,000 level.
EUR/USD Technical Analysis
The Euro attempted an upside break above the 1.1200 level against the US Dollar. EUR/USD failed to continue higher and started a consolidation phase.
Looking at the 4-hour chart, the pair remained stable above the 1.1120 pivot level, the 100 simple moving average (red, 4-hour), and the 200 simple moving average (green, 4-hour).
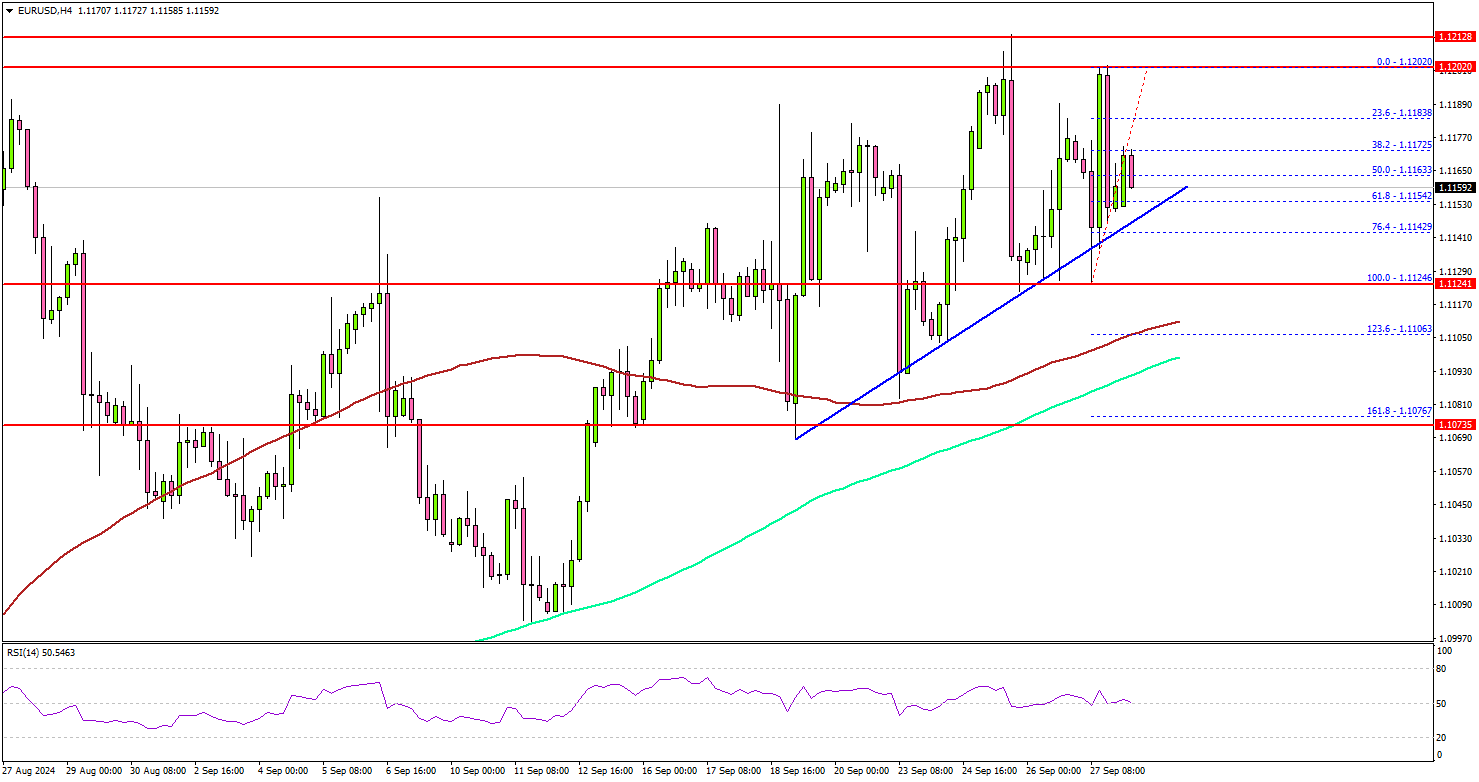
On the downside, immediate support sits near the 1.1140 level. There is also a key bullish trend line forming with support at 1.1145 on the same chart, below which the pair might test 1.1120. The next key support sits near the 1.1100 level and the 100 simple moving average (red, 4-hour).
Any more losses could send the pair toward the 1.1065 support zone. On the upside, the bears are active near the 1.1200 level. A close above the 1.1200 level could set the tone for another increase.
The next major resistance could be 1.1240. A clear move above the 1.1240 level might send EUR/USD toward 1.1320. Any more gains might call for a test of the 1.1350 zone.
Looking at Gold, the bulls remained in action and pushed the price to a new all-time high near $2,685 before bears appeared.
Upcoming Economic Events:
- Dallas Fed Manufacturing Business Index for Sep 2024 – Forecast -4.5, versus -9.7 previous.
- Chicago Purchasing Manager’s Index for Sep 2024 – Forecast 46.5, versus 46.1 previous.
EUR/JPY Daily Outlook
Daily Pivots: (S1) 157.07; (P) 160.28; (R1) 161.99; More....
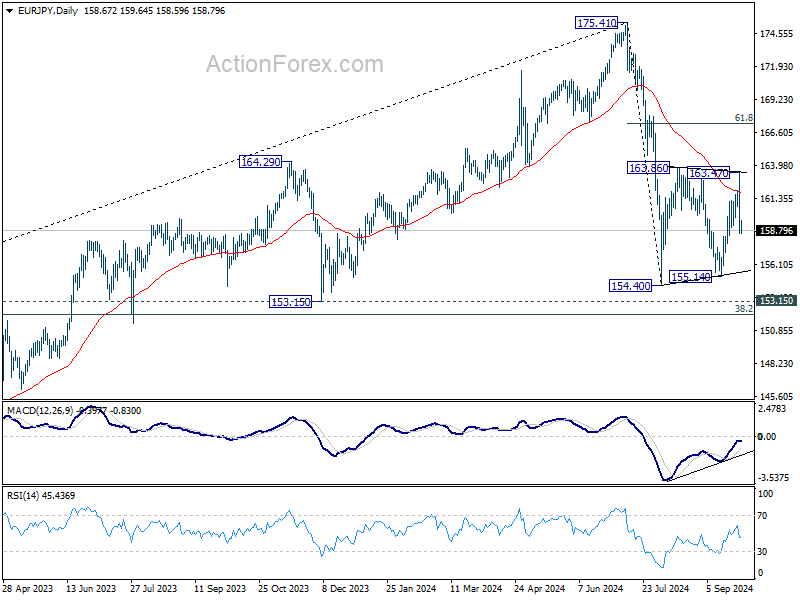
Intraday bias in EUR/JPY stays on the downside for the moment. Current development suggest that corrective pattern from 154.40 might have completed with three waves to 163.47 already. Deeper decline would be seen o retest 154.40/155.14 support zone. For now, risk will stay mildly on the downside as long as 163.47 resistance holds, in case of recovery.
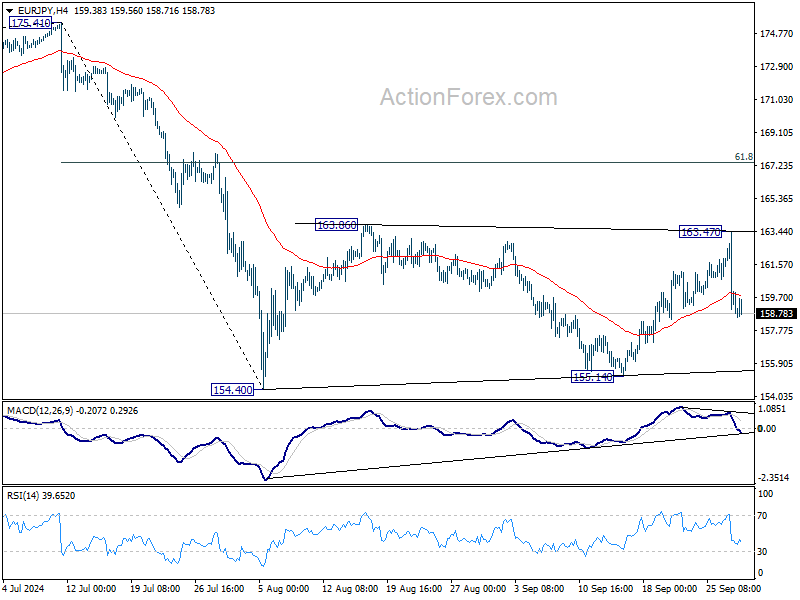
In the bigger picture, price actions from 175.41 are seen as correction to rally from 114.42 (2020 low). The range of consolidation should have been set between 38.2% retracement of 114.42 to 175.41 at 152.11 and 175.41 high. However, decisive break of 152.11 would argue that deeper correction is underway.
Diverging Trends in Asian Markets; EUR/USD Awaits Eurozone CPI and US NFP
Asian financial markets are displaying significant divergence today. Japan's Nikkei index has plummeted over -4%, reacting sharply to the ruling Liberal Democratic Party's election results from last Friday. Shigeru Ishiba, the newly elected LDP leader and Japan's incoming Prime Minister, attempted to soften his previously hawkish stance on the BoJ monetary policy during a interview on Sunday. Despite these efforts, investors remain concerned about the impact of further monetary tightening on the appreciation of Japanese Yen, and the subsequent effects on the nation's export-driven economy.
In stark contrast, stock markets in Hong Kong and mainland China are continuing their robust rally, bolstered by stimulus measures implemented last week. The market has largely ignored the disappointing PMI data released from China today. However, there is growing pressure for additional fiscal policies to supplement monetary efforts. Proposals include expanding the government's balance sheet to stimulate consumer spending and enhance social welfare programs. China's economy still faces challenges from subdued domestic demand and an increasingly adverse global trade environment.
Turning to the currency markets, Kiwi and Aussie are leading gains as the new week begins. Kiwi is particularly strong, underpinned by exceptionally positive business confidence data. Sterling is also performing well, ranking as the third strongest currency today so far. On the other end of the spectrum, Yen is the weakest performer, although this appears to be just consolidation following last week's gains, with prospects for further strengthening ahead. Swiss Franc and the Dollar are also showing weakness, while Euro and Loonie are trading in the middle.
Looking ahead, EUR/USD will be the main focus this week, with Eurozone inflation data and US non-farm payrolls being critical in shaping the next policy decisions from ECB and Fed.
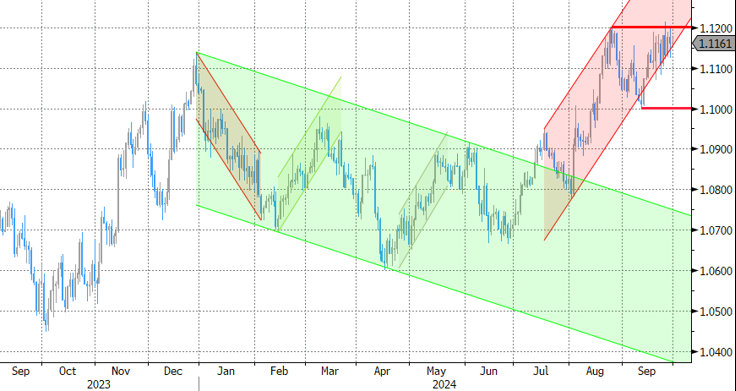
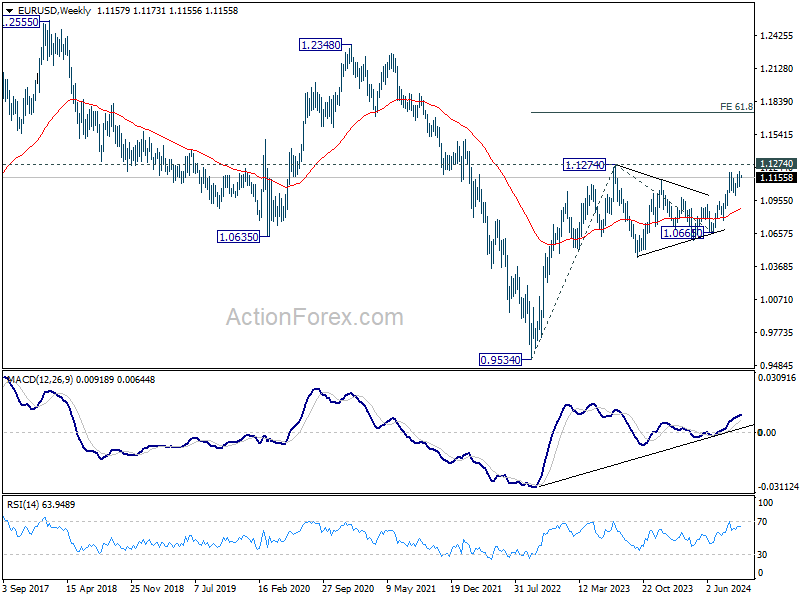
Technically, EUR/USD is so far struggling to build upside momentum to push through 1.1274 resistance (2023 high). However, strong break of this level will confirm resumption of the whole up trend from 0.9534 (2022 low). That would set the stage for further rally towards 61.8% projection of 0.9534 to 1.1274 from 1.0665 at 1.1740 in Q4 by the end of the year.
In Asia, at the time of writing, Nikkei is down -4.56%. Hong Kong HSI is up 3.01%. China Shanghai SSE is up 5.70%. Singapore Strait Times is up 0.20%. Japan 10-year JGB yield is up 0.0551 at 0.862.
Japan’s industrial output drops -3.3% mom in Aug, set for recovery in coming months
Japan's industrial production took a sharp hit in August, contracting by -3.3% mom, a significant miss compared to market expectations of -0.5% mom decline.
The seasonally adjusted production index for factories and mines stood at 99.7, based on the 2020 benchmark of 100. Among the 15 industrial sectors surveyed, 12 experienced a decrease in output, with motor vehicles leading the decline at -10.6% mom. This drop was largely attributed to operational disruptions at more than a dozen Toyota Motor Corp. plants, caused by Typhoon Shanshan.
Despite this steep decline, Japan's Ministry of Economy, Trade, and Industry maintained its assessment that industrial production remains "indecisive." Manufacturers polled by the ministry are forecasting a rebound, with output expected to grow by 2.0% mom in September and further rise by 6.1% mom in October.
On a brighter note, Japanese retail sales increased by 2.8% year-on-year yoy in August, surpassing median forecast of 2.6% yoy . Compared to the previous month, retail sales posted 0.8% mom increase, following 0.2% mom rise in July, indicating steady consumer demand.
China’s PMI data points to continued manufacturing contraction and weakening services sector
China’s economic data for September painted a mixed picture, with manufacturing remaining in contraction and services sector losing steam.
Official NBS Manufacturing PMI edged up slightly from 49.1 in August to 49.7, above expectations of 49.5 but still below the 50-mark, signaling contraction for the fifth consecutive month. Export orders continued to weaken, with the new manufacturing export order subindex dropping from 48.7 to 47.5.
Meanwhile, NBS Non-Manufacturing PMI fell from 50.3 to 50.0, marking the end of 20 straight months of expansion. Within the non-manufacturing sectors, construction showed a marginal improvement, with its subindex rising to 50.7, but services dipped into contraction territory, falling from 50.2 to 49.9.
NBS PMI Composite rose modestly from 50.1 to 50.4. According to the NBS, extreme weather events like typhoons and the conclusion of the summer travel season significantly impacted transport, culture, and entertainment sectors.
Caixin Manufacturing PMI told a similar story, dropping from 50.4 to 49.3, the lowest reading since July 2023, while Caixin Services PMI also underperformed, falling from 51.6 to 50.3, a 12-month low. Caixin's Composite PMI slipped from 51.2 to 50.3, reflecting broad weakness in both manufacturing and services.
Wang Zhe, senior economist at Caixin Insight Group, noted, "market conditions in the manufacturing sector worsened in September, marked by a limited expansion in supply and a significant contraction in demand.” Business confidence also fell to its "lowest level in recent years".
NZ ANZ business confidence soars to 60.9, raising concerns of overreaction to RBNZ rate cuts
New Zealand’s ANZ Business Confidence Index saw a significant rise in September, jumping from 50.6 to 60.9, reflecting growing optimism in the business sector.
Key components of the survey also painted a positive picture. The own activity outlook rose from 37.1 to 45.3, while profit expectations surged from 8.0 to 22.2, suggesting a more upbeat economic environment.
Although cost expectations fell slightly from 68.3 to 66.8, wage expectations edged up from 75.1 to 76.4. Pricing intentions also increased from 41.0 to 42.8, while inflation expectations remained unchanged at 2.92%, marking the second consecutive month below 3%.
ANZ highlighted that this survey underscores " the risk that the economy’s response to lower interest rates could be more vigorous than is generally expected."
Inflation remains a concern. Firms are planning to raise prices by an average of 1.6% over the next three months, a notable increase from the June low of 1.2%. While wage growth has moderated from 4% in April to 3% now, and cost expectations have eased to 2.4%, inflationary pressures still require careful monitoring by RBNZ to ensure price stability.
US NFP and Eurozone CPI to Steer Fed and ECB’s Upcoming Decisions
The upcoming week features a series of critical economic data releases are poised to shape monetary policy decisions by some major central banks.
In the US, the primary question is whether Fed will proceed with a consecutive 50 bps rate cut on November 1. Currently, fed fund futures reflect a 53.3% probability of such a move, indicating that the market is evenly split on the outcome.
Fed have clearly indicated that as disinflation efforts are progressing satisfactorily, there is a growing need to focus more on the labor market, another half of the dual-mandate. Consequently, the forthcoming September non-farm payroll report, due this Friday, will be of paramount importance. Among the labor statistics, headline job growth and the unemployment rate are expected to be the most influential factors in Fed's decision-making process. Wage growth, although still relevant, may receive slightly less emphasis given the current context.
In addition to employment data, ISM will release its manufacturing and services indexes, and they will be closely watched. Any unexpected deterioration in the services sector could dampen the current bullish sentiment in equity markets and rekindle fears of recession.
In the Eurozone, market sentiment has shifted sharply in favor of a 25bps rate cut by the ECB on October 17, with probability estimates soaring from 25% to 75% after dismal PMI readings. ECB officials have noted the lack of fresh economic data, but the anticipated release of both headline and core CPI for September may offer new insights that could sway the decision.
In Japan, the new LDP leader Shigeru Ishiba appeared to temper his support for an imminent BoJ rate hike. Over the weekend, he reiterated that monetary easing should continue, citing ongoing concerns over deflation. This could leave markets looking toward BoJ’s summary of opinions and the Tankan survey for further guidance. BoJ remains divided on the timing of future rate hikes, and this division may persist in the coming weeks.
This position of Ishiba suggests that the markets may need to recalibrate their expectations regarding BoJ policy moves. Focuses would be back on BoJ's forthcoming summary of opinions and the Tankan survey for guidance.
Elsewhere, Swiss CPI could reinforce that SNB is on course for another rate cut in December.
Here are some highlights for the week:
- Monday: Japan industrial production, retail sales, housing starts; New Zealand ANZ business confidence; Germany import prices, CPI flash; UK Q2 GDP final, current account, M4 monthly supply, mortgage approvals; Swiss KOF economic barometer; US Chicago PMI.
- Tuesday: New Zealand building permits; Japan unemployment rate, Tankan survey, PMI manufacturing final, BoJ summary of opinions; Australia retail sales, building approvals; Swiss retail sales, PMI manufacturing; Eurozone PMI manufacturing final, CPI flash; UK PMI manufacturing final; Canada PMI manufacturing; US ISM manufacturing, construction spending.
- Wednesday: Japan monetary base, consumer confidence; Eurozone unemployment rate; US ADP employment.
- Thursday: Australia goods trade balance; Swiss CPI; Eurozone PMI services final, PPI; UK PMI services final; US jobless claims, ISM services, factory orders.
- Friday: Swiss unemployment rate; France industrial production; UK PMI construction; US non-farm payrolls; Canada Ivey PMI.
EUR/JPY Daily Outlook
Daily Pivots: (S1) 157.07; (P) 160.28; (R1) 161.99; More....
Intraday bias in EUR/JPY stays on the downside for the moment. Current development suggest that corrective pattern from 154.40 might have completed with three waves to 163.47 already. Deeper decline would be seen o retest 154.40/155.14 support zone. For now, risk will stay mildly on the downside as long as 163.47 resistance holds, in case of recovery.
In the bigger picture, price actions from 175.41 are seen as correction to rally from 114.42 (2020 low). The range of consolidation should have been set between 38.2% retracement of 114.42 to 175.41 at 152.11 and 175.41 high. However, decisive break of 152.11 would argue that deeper correction is underway.
China’s PMI data points to continued manufacturing contraction and weakening services sector
China’s economic data for September painted a mixed picture, with manufacturing remaining in contraction and services sector losing steam.
Official NBS Manufacturing PMI edged up slightly from 49.1 in August to 49.7, above expectations of 49.5 but still below the 50-mark, signaling contraction for the fifth consecutive month. Export orders continued to weaken, with the new manufacturing export order subindex dropping from 48.7 to 47.5.
Meanwhile, NBS Non-Manufacturing PMI fell from 50.3 to 50.0, marking the end of 20 straight months of expansion. Within the non-manufacturing sectors, construction showed a marginal improvement, with its subindex rising to 50.7, but services dipped into contraction territory, falling from 50.2 to 49.9.
NBS PMI Composite rose modestly from 50.1 to 50.4. According to the NBS, extreme weather events like typhoons and the conclusion of the summer travel season significantly impacted transport, culture, and entertainment sectors.
Caixin Manufacturing PMI told a similar story, dropping from 50.4 to 49.3, the lowest reading since July 2023, while Caixin Services PMI also underperformed, falling from 51.6 to 50.3, a 12-month low. Caixin's Composite PMI slipped from 51.2 to 50.3, reflecting broad weakness in both manufacturing and services.
Wang Zhe, senior economist at Caixin Insight Group, noted, "market conditions in the manufacturing sector worsened in September, marked by a limited expansion in supply and a significant contraction in demand.” Business confidence also fell to its "lowest level in recent years".
Full Caixin PMI manufacturing and services release.