Sample Category Title
NZ ANZ business confidence soars to 60.9, raising concerns of overreaction to RBNZ rate cuts
New Zealand’s ANZ Business Confidence Index saw a significant rise in September, jumping from 50.6 to 60.9, reflecting growing optimism in the business sector.
Key components of the survey also painted a positive picture. The own activity outlook rose from 37.1 to 45.3, while profit expectations surged from 8.0 to 22.2, suggesting a more upbeat economic environment.
Although cost expectations fell slightly from 68.3 to 66.8, wage expectations edged up from 75.1 to 76.4. Pricing intentions also increased from 41.0 to 42.8, while inflation expectations remained unchanged at 2.92%, marking the second consecutive month below 3%.
ANZ highlighted that this survey underscores " the risk that the economy’s response to lower interest rates could be more vigorous than is generally expected."
Inflation remains a concern. Firms are planning to raise prices by an average of 1.6% over the next three months, a notable increase from the June low of 1.2%. While wage growth has moderated from 4% in April to 3% now, and cost expectations have eased to 2.4%, inflationary pressures still require careful monitoring by RBNZ to ensure price stability.
Japan’s industrial output drops -3.3% mom in Aug, set for recovery in coming months
Japan's industrial production took a sharp hit in August, contracting by -3.3% mom, a significant miss compared to market expectations of -0.5% mom decline.
The seasonally adjusted production index for factories and mines stood at 99.7, based on the 2020 benchmark of 100. Among the 15 industrial sectors surveyed, 12 experienced a decrease in output, with motor vehicles leading the decline at -10.6% MoM. This drop was largely attributed to operational disruptions at more than a dozen Toyota Motor Corp. plants, caused by Typhoon Shanshan.
Despite this steep decline, Japan's Ministry of Economy, Trade, and Industry maintained its assessment that industrial production remains "indecisive." Manufacturers polled by the ministry are forecasting a rebound, with output expected to grow by 2.0% mom in September and further rise by 6.1% mom in October.
On a brighter note, Japanese retail sales increased by 2.8% year-on-year yoy in August, surpassing median forecast of 2.6% yoy . Compared to the previous month, retail sales posted 0.8% mom increase, following 0.2% mom rise in July, indicating steady consumer demand.
NZ First Impressions: ANZ Business Confidence, September 2024
Business sentiment has continued to charge higher as interest rate pressures ease, but activity remains soft for now.
Key results (September 2024)
- Business confidence: 60.9 (Prev: 50.6)
- Expectations for own trading activity: 45.3 (Prev: 37.1)
- Activity vs same month one year ago: -18.5 (Prev: -23.1)
- Inflation expectations: 2.92% (Prev: 2.92%)
- Pricing intentions: 42.8 (Prev: 41.0)
September saw another sharp rise in headline business confidence. It’s now back at levels we last saw in 2014.
Businesses are also feeling more optimistic about their own prospects, with a net 45% expecting trading conditions will improve over the coming year. That’s also the highest it’s been since 2014.
The lift in business confidence follows the start of the RBNZ’s easing cycle in August, with interest rates expected to trend down over the coming year.
But while businesses are feeling more optimistic about the outlook, for now they continue to face weak trading conditions. There were more businesses who reported that sales fell over the past year than reported increases, and many have shed staff.
After trending down over the past year, gauges of inflation pressures have stabilised. While not low, they’re looking more consistent with the RBNZ’s goals than they have for a long time, with inflation expected to be at 2.9% this time next year (the same as in the previous survey).
Overall, today’s results probably broadly match the RBNZ’s expectations, and likely won’t have changed their thinking ahead of next week’s policy announcement: Activity remains soft; inflation pressures have stabilised and are well down on the elevated levels we saw in recent years; and signs of a firming in growth over 2025 are starting to emerge. Against that backdrop, we’re forecasting a 25bp cut in the OCR at next week’s RBNZ policy review. The last piece of key data before the RBNZ meets will be tomorrow’s Quarterly Survey of Business Opinion, which we expect will show similar trends to today’s ANZBO survey.
CADCHF Wave Analysis
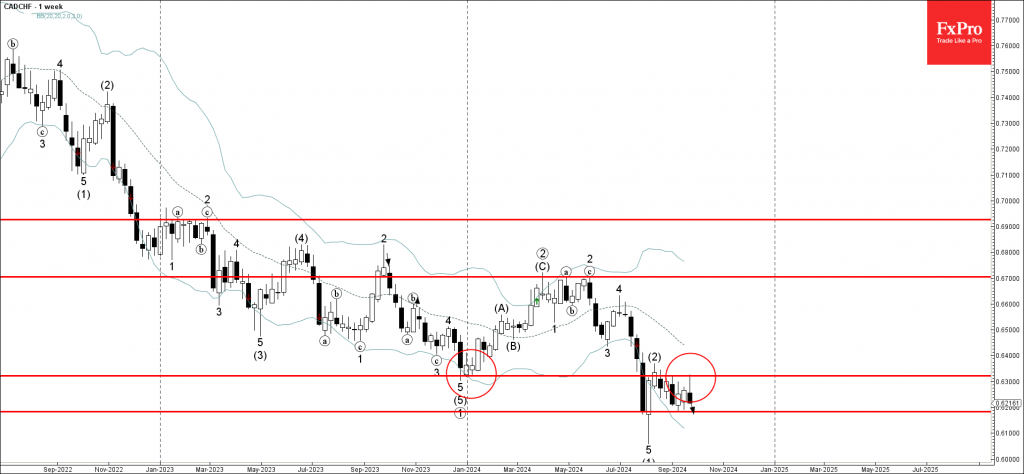
- CADCHF reversed from resistance level 0.6320
- Likely to fall to support level 0.6180
CADCHF currency pair recently reversed down from the resistance level 0.6320 (former strong support which stopped the weekly downtrend at the end of 2023).
The downward reversal from the resistance level 0.6320 continues the active weekly downward impulse wave (3) .
Given the clear weekly downtrend and the strongly bearish Canadian dollar sentiment, CADCHF currency pair can be expected to fall further to the next support level 0.6180.
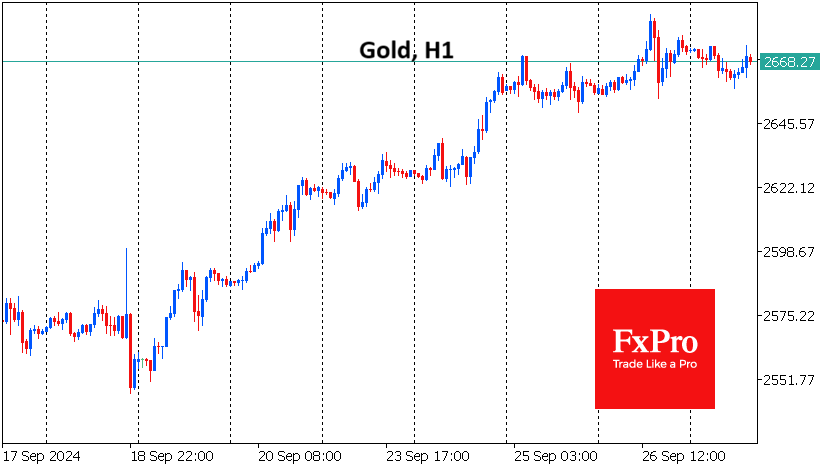
The Wild Part of the Gold Rally
Gold has hit all-time highs on each of the last six trading days. Thursday’s touch of $2685 followed the strongest selling momentum since 18th September, when initial profit-taking expanded following the release of strong GDP growth estimates.
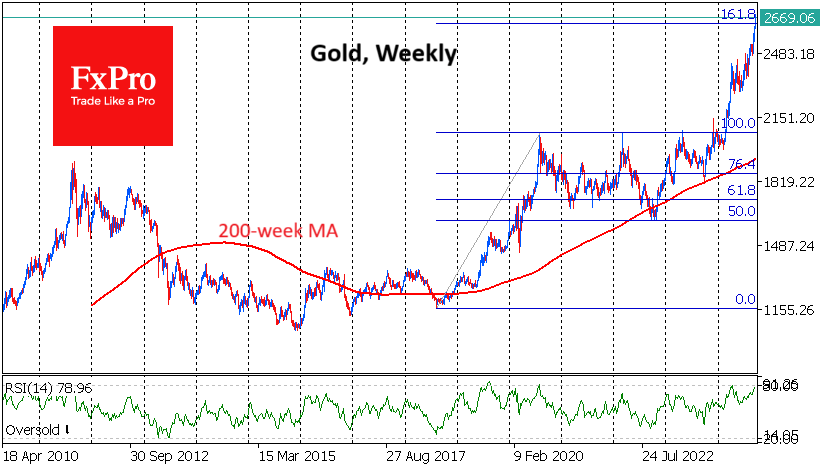
Short-term intraday profit-taking is both fuel for further gains and a sign of uncertainty at this stage of the market. Technically, gold has already crossed above the 161.8% level of the two-year rally since August 2018 – a typical rally extension pattern along Fibonacci levels. When the price has moved so far into the area of historical highs, it becomes more difficult to find new upside targets.
More attention is now being paid to looking for signs of overbought conditions. On the weekly timeframe, the RSI index is approaching the overbought level of 80. This is only the sixth time since 2008 that the index has entered this territory, with corrections of 6-20% following. The last percentage was 6% at the end of last year, but the others were much higher. In 2011, this overbought area locked in a price peak for the next nine years.
Gold’s strong rally over the past three weeks is the most dangerous part of the trend for short-term sell-side traders who get involved in selling without reliable signals. On a weekly timeframe, such a signal would be a negative weekly close. We will get this signal next Friday at the earliest. The publication of monthly data on the US labour market will reinforce its importance for the markets.
Stimulus and Political Surprise in Asia Drive Market Sentiment
Unexpected developments from Asia significantly influenced global financial markets last week. China's surprise stimulus measures invigorated investor sentiment, leading to substantial gains in Chinese and Hong Kong equities, as well as strengthening Chinese Yuan. This positive shift boosted commodity-linked currencies, with New Zealand Dollar and Australian Dollar emerging as the top performers for the week.
Adding to the drama in Asia, the unforeseen outcome of the Liberal Democratic Party leadership election in Japan resulted in sharp appreciation of Japanese Yen, making it the third-best performing currency. Markets quickly began speculating on whether his government would support more rate hikes from BoJ, further fueling Yen strength.
In contrast, Europe’s economic struggles were highlighted by disappointing PMI data, which reignited expectations of an ECB rate cut in October. As a result, Euro tumbled, marking it as the worst-performing major currency for the week. Across the Atlantic, Dollar also lost ground, weighed down by inflation data that cemented expectations for additional policy easing by Fed. Additionally, the record-breaking performance of DOW weighed on the greenback. Meanwhile, British Pound, Swiss Franc, and Canadian Dollar showed mixed performances.
Chinese stocks surge on bold stimulus oves, FOMO drives market momentum
China surprisingly took center stage in the global financial markets last week, unleashing a series of long-awaited monetary stimulus measures that ignited investor optimism. The 24-member Politburo reinforced this momentum by pledging to boost fiscal spending and, for the first time, committing to halt the decline in property prices. Additionally, the leadership unveiled a renewed focus on stimulating consumption to address public concerns. These decisive actions propelled stock markets in China and Hong Kong to their best weekly performance since 2008. Notably, the Hong Kong HSI surged on Friday with a record turnover of HKD 445B, a clear indicator of heightened investor enthusiasm .
This moment is viewed as a critical juncture for China's economy and equity markets. Politically, it signifies President Xi Jinping's turn from the shift from ideologies to recognition of the need for a stable growth baseline to maintain social harmony, enhance global influence, and achieve national revitalization goals. The timing is particularly advantageous, coinciding with global monetary easing efforts, including those by Fed, which is expected to bolster consumer spending—a positive development for China's export-driven economy. The overwhelming market momentum suggests that fear of missing out is currently overshadowing any skepticism regarding the effectiveness of China's policy measures.
China's Shanghai SSE Composite ended the week gaining 12.81%, and closed above the psychologically important 3000 handle. Technically, the key hurdle ahead is 3174.26 cluster resistance, with 50% retracement of 3731.68 (2021 high) to 2635.09 (2024 low) at 3183.39.
Strong resistance could be seen from 3714/83 to limit upside, at least on first attempt. If happens, the pullback from this level could be steep given the speed of the rally from 2689.70. But downside should be contained well above 55 D EMA (now at 3865.18).
Decisive break of 3714/83 should confirm that the SSE is already reversing the whole down from from 3731.68, and target 61.8% retracement at 3312.78 next, with prospect of revisiting 3731.68 in medium term.
The Hong Kong HSI powered through 19706.12 resistance to resume the rally from 14794.16. Near term outlook will stay bullish as long as 19072.72 support holds. Next target is 100% projection of 14794.16 to 19706.12 from 16964.28 at 21876.24.
The major question now is whether HSI could eventually break through key resistance zone between 22700.85 (2023 high) and 50% retracement of 33484.08 (2018 high) to 14597.31 (2022 low) at 24040.70 to add to the case of long term reversal.
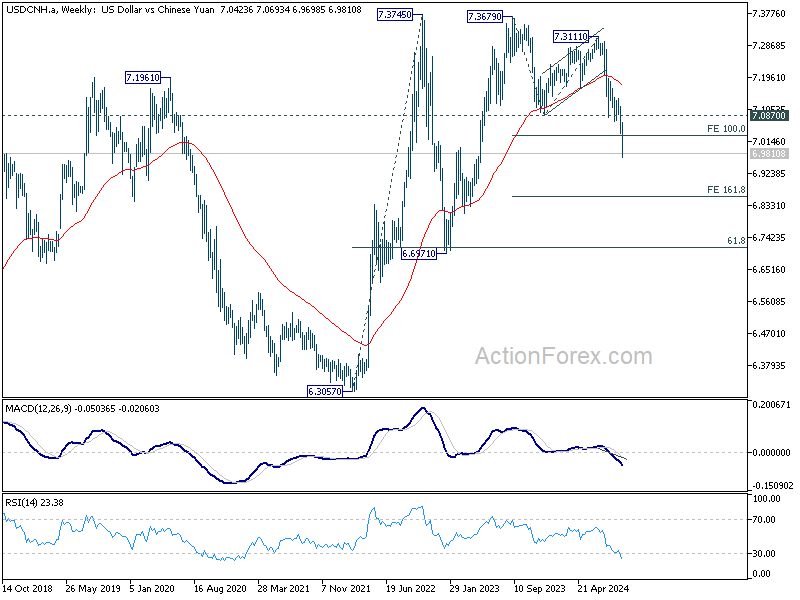
USD/CNH accelerated lower and broke through 100% projection of 7.3679 to 7.0870 from 7.3111 at7.0302 and the psychologically important 7 handle. Near term outlook will stay bearish as long as 7.0870 support turned resistance holds, for 161.8% projection at 6.8566.
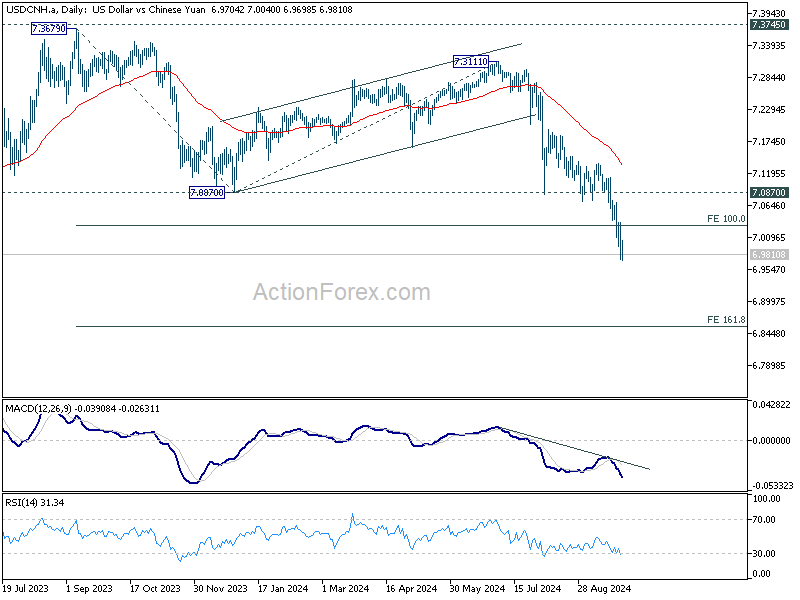
It's still early to assess the chance, but there is prospect for USD/CNH to fall further to 6.6971 cluster support (61.8% retracement of 6.3057 (2022 low) to 7.3746 (2022 high) at 6.7140) before bottoming.
Ishiba's Surprise LDP Leadership Victory Rattles Japanese Markets
The unexpected result of Japan’s LDP leadership contest last week also caught the markets off guard. Markets had been apparently positioned for reflationist Sanae Takaichi to win, but Ishiba's triumph has dramatically shifted expectations. Yen surged in response to the news, reflecting investor sentiment toward Ishiba's critical view of BoJ's past monetary stimulus. Ishiba has openly supported the central bank's current rate hikes, reigniting speculation that BoJ may raise interest rates again in December.
The immediate market reaction was pronounced. Japanese Yen surged against major currencies, reflecting investor expectations of tighter monetary policy ahead. However, concerns have emerged that Ishiba's hawkish stance could pose challenges for equity markets. There is apprehension that aggressive rate hikes might create headwinds for stocks and lead to increased Yen volatility.
Nikkei futures tumbled more than 2,000 points following the news, and the cash index is expected to open sharply lower on Monday.
It's still early to call for reversal of Nikkei's whole rebound from 31156.11. But some consolidations is likely in the near term, with risk of dipping through 55 D EMA (now at 37786.39). Yet, downside should be contained by 35253.43 support to bring rebound. In case of another rise, upside potential should be limited by 61.8% projection of 31156.11 to 39080.64 from 35253.43 at 40150.78.
So in short, Nikkei is expected to trade within the 35k to 40k range until there is greater clarity on Japan's political situation. Investors are closely watching to see if Ishiba will call a snap general election to secure his mandate and reveal more details about his economic and foreign policy agendas.
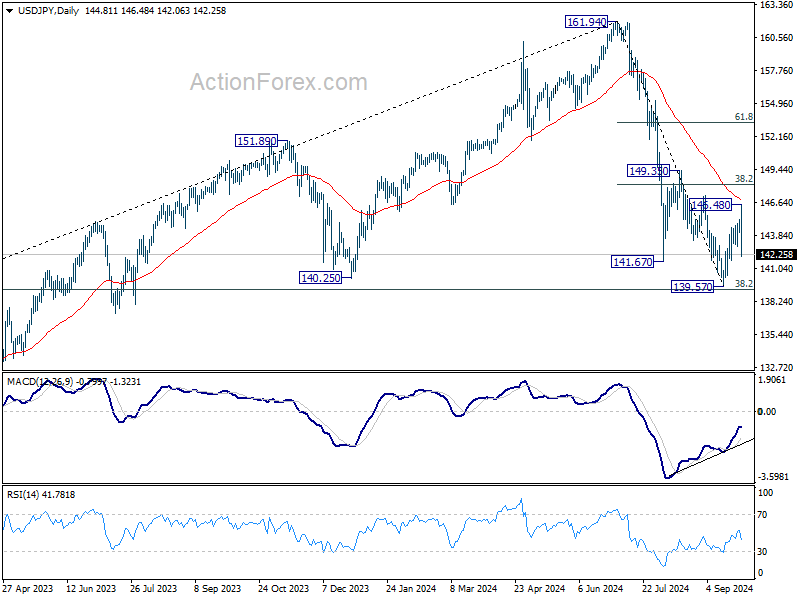
USD/JPY's steep decline on Friday suggests that rebound from 139.57 has completed at 146.48, ahead of falling 55 D EMA. While the development is keeping outlook bearish and favors deeper fall, strong support is still expected at around 38.2% retracement of 102.58 to 161.94 at 139.26 to bring another rebound. However, sustained break of 139.26 would open up deeper medium term decline to 61.8% retracement at 125.25 in the medium term.
Record-Breaking DOW Rally May Start to Lose Steam
DOW surged to a new all-time high on Friday, fueled by optimism over continued disinflation as the PCE inflation data showed further progress. Major US indexes extended their gains for the third consecutive week, with DOW and S&P 500 each rising about 0.6% for the week, while NASDAQ posted a solid 1% gain.
The positive inflation data strengthened the view that Fed could afford to shift its focus toward the labor market. This rate-cutting bias is seen as a significant tailwind for stock markets. With inflation seemingly under control, consumers sensitive to higher interest rates might finally see some relief too.
Technically, however, DOW might start to lose momentum at around 61.8% projection of 32327.20 to 39889.05 from 38000.96 at 42674.18. Break of 41859.73 support will indicate short term topping, and bring pullback to 55 D EMA (now at 40819.85), before continuing the long term up trend. Nevertheless sustained break of 42674.18 will pave the way to 100% projection at 45562.81 next.
Dollar Index gyrated lower last week, with week momentum as seen in D MACD. While further decline is in favor as long as 101.91 resistance holds, strong support might emerge at 99.57 (2023 low) to contain downside at first attempt. Break of 101.91 resistance will bring stronger rebound.
AUD/USD Weekly Report
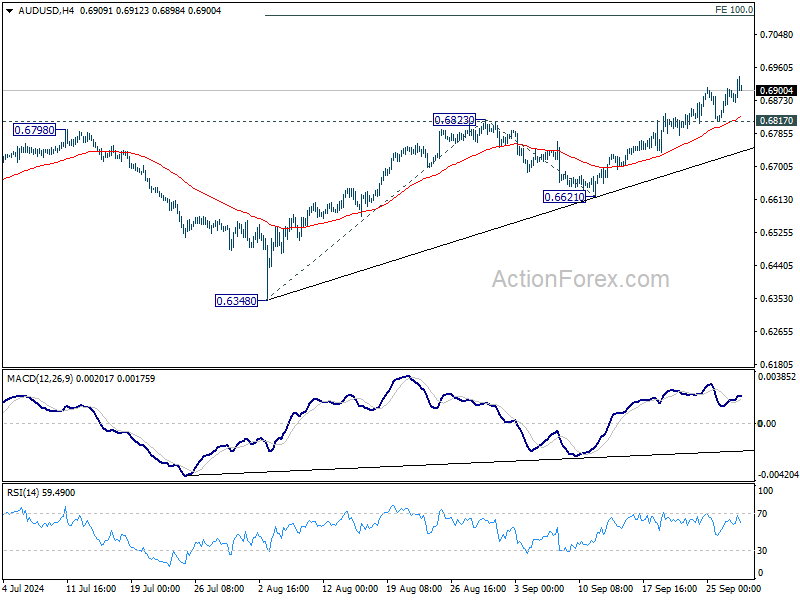
AUD/USD's rally contained last week and hit as high as 0.6936. Initial bias is on the upside this week. Firm break of 0.6941 will pave the way to 100% projection of 0.6348 to 0.6823 from 0.6621 at 0.7096. On the downside, below 0.6817 support will turn intraday bias neutral first.
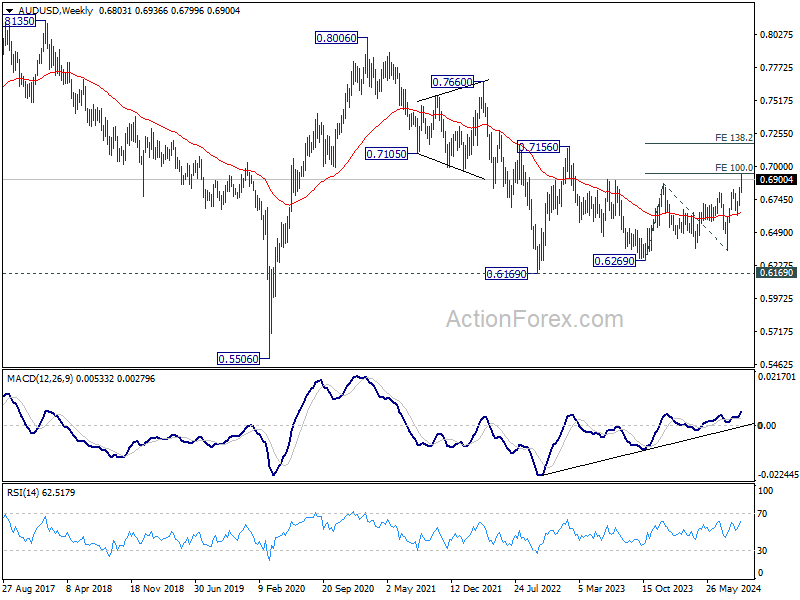
In the bigger picture, overall, price actions from 0.6169 (2022 low) are seen as a medium term corrective pattern, with rise from 0.6269 as the third leg. Firm break of 0.6870 resistance will target 100% projection of 0.6269 to 0.6870 from 0.6340 at 0.6941, and then 138.2% projection at 0.7179. This will now remain the favored case as long as 0.6621 support holds.
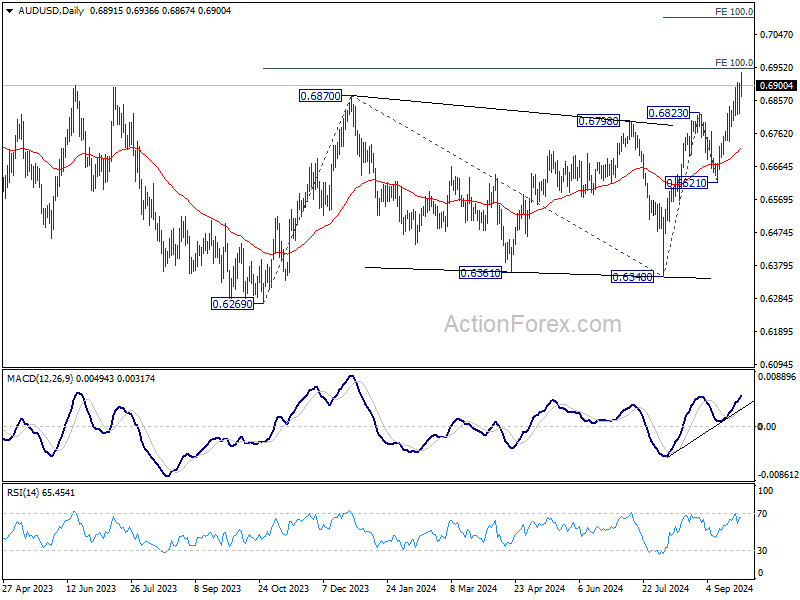
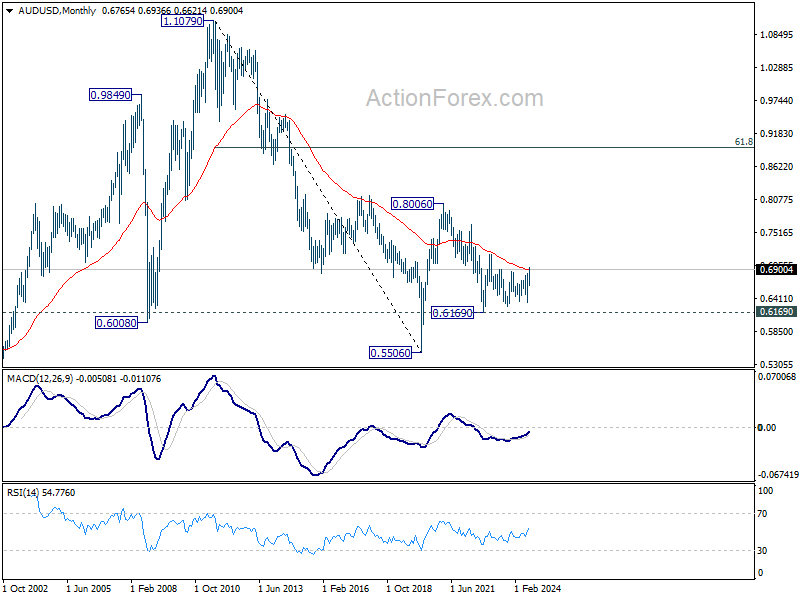
In the long term picture, the down trend from 1.1079 (2011 high) should have completed at 0.5506 (2020 low) already. It's unsure yet whether price actions from 0.5506 are developing into a corrective pattern, or trend reversal. But in either case, fall from 0.8006 is seen as the second leg of the pattern. Firm of 0.7156 resistance will argue that the third leg has already started towards 0.8006.
EUR/USD Weekly Outlook
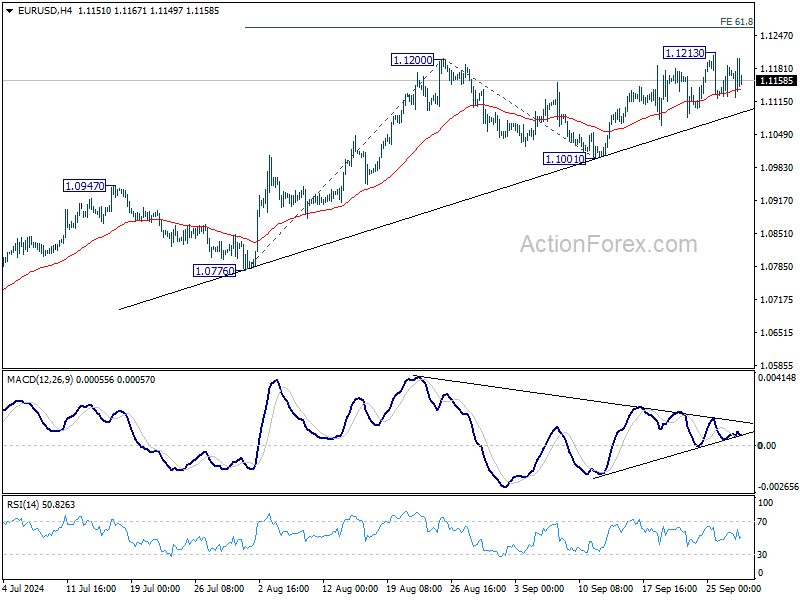
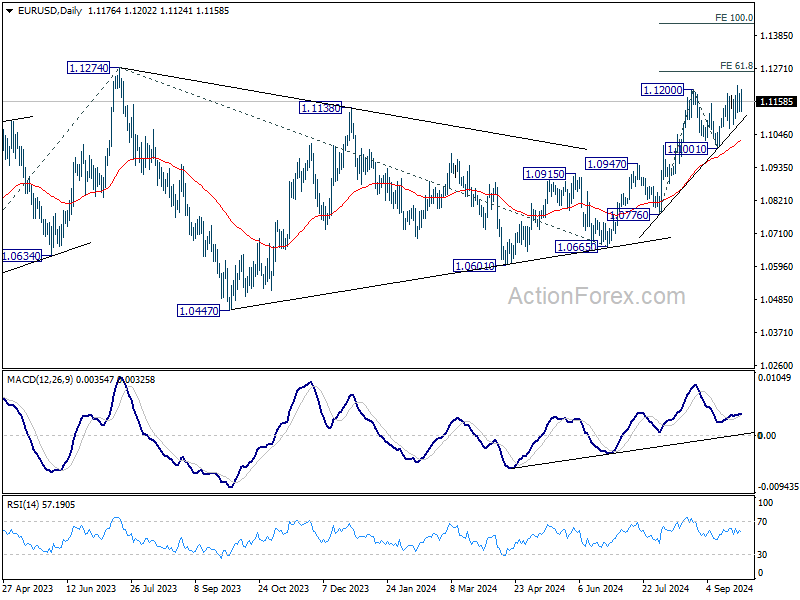
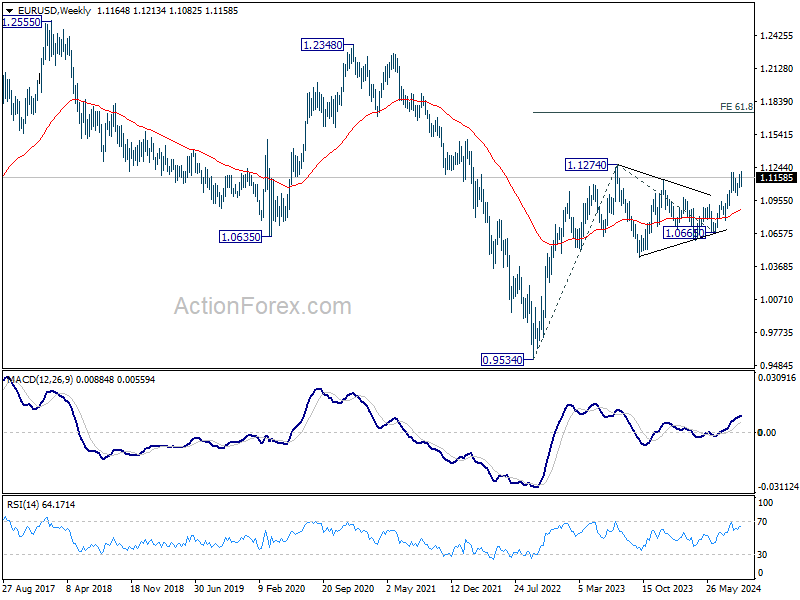
EUR/USD edged higher to 1.1213 last week but quickly settled back in range. Initial bias remains neutral this week first. Further rally is expected as long as 1.1001 support holds. Above 1.1213 will resume the rise from 1.0665 to 1.1274 high. Firm break there will resume larger up trend. Next near term target will be 100% projection of 1.0776 to 1.1200 from 1.1001 at 1.1425.
In the bigger picture, corrective pattern from 1.1274 should have completed at 1.0665 already. Decisive break of 1.1274 (2023 high) will confirm resumption of whole up trend from 0.9534 (2022 low). Next target will be 61.8% projection of 0.9534 to 1.1274 from 1.0665 at 1.1740. This will now be the favored case as long as 1.1001 support holds.
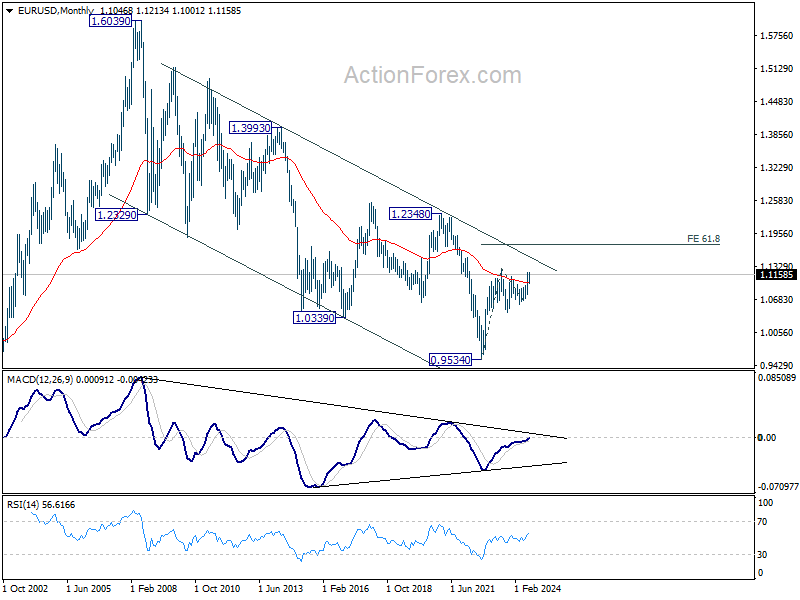
In the long term picture, a long term bottom is in place at 0.9534 (2022 low). The strong break of 55 M EMA (now at 1.1018) is taken as the first sign of bullish trend reversal. But still, firm break of 1.2348 structural resistance is needed to confirm. Otherwise, price actions from 0.9534 could still develop into a consolidation pattern.
USD/JPY Weekly Outlook
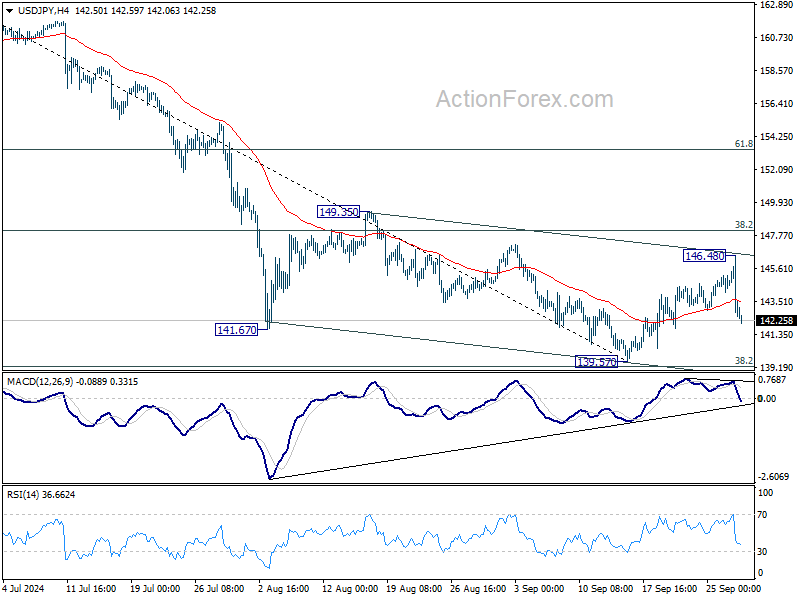
USD/JPY reversed after edging higher to 146.48 last week. Initial bias now back on the downside this week for retesting 139.57. But strong support could be seen again from 139.26 fibonacci level to bring rebound. However, firm break of 139.26 will carry larger bearish implications.
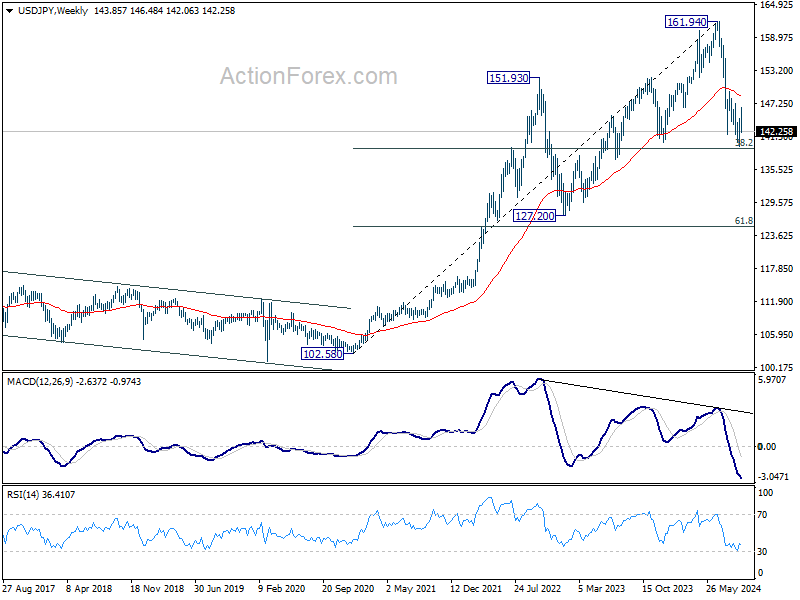
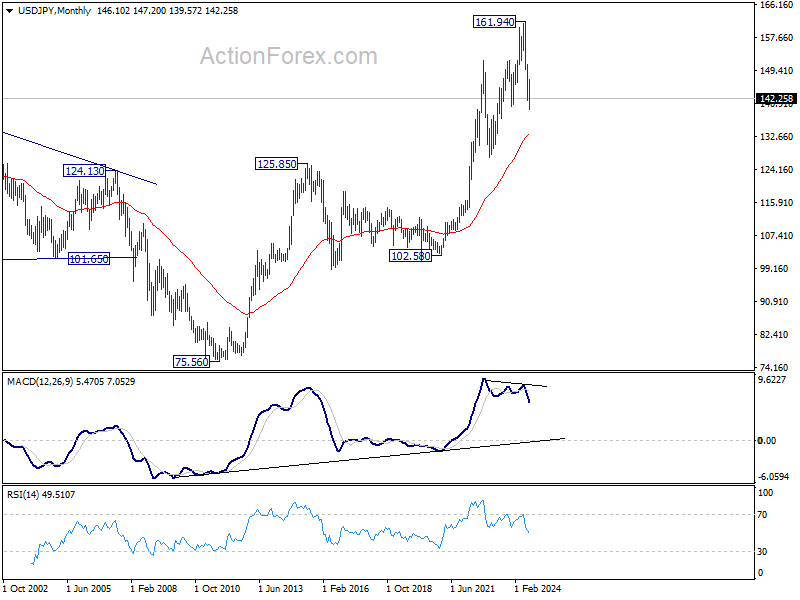
In the bigger picture, fall from 161.94 medium term top is seen as correcting whole up trend from 102.58 (2021 low). Strong support could be seen from 38.2% retracement of 102.58 to 161.94 at 139.26 to contain downside, at least on first attempt. But in any case, risk will stay on the downside as long as 149.35 resistance holds. Sustained break of 139.26 would open up deeper medium term decline to 61.8% retracement at 125.25.
In the long term picture, it's still early to conclude that up trend from 75.56 (2011 low) has completed. However, a medium term corrective phase should have commenced, with risk of deep correction towards 55 M EMA (now at 133.19).
GBP/USD Weekly Outlook
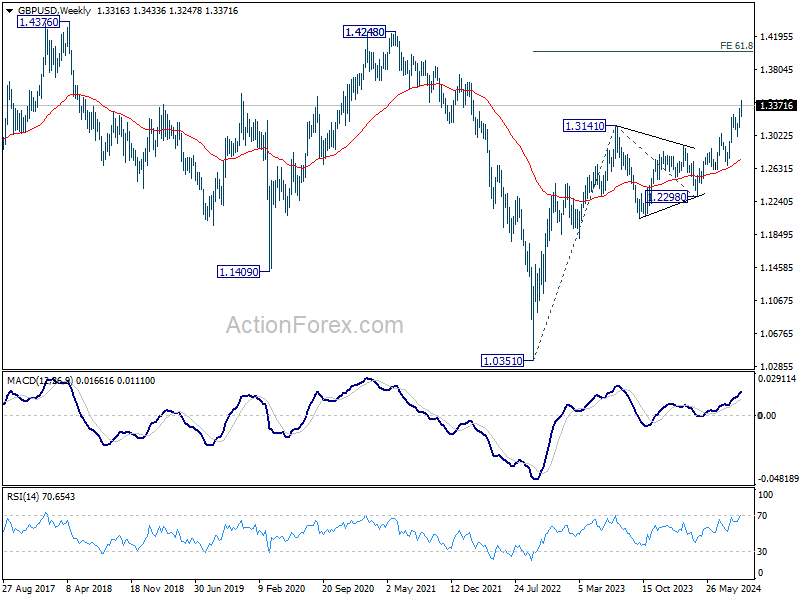
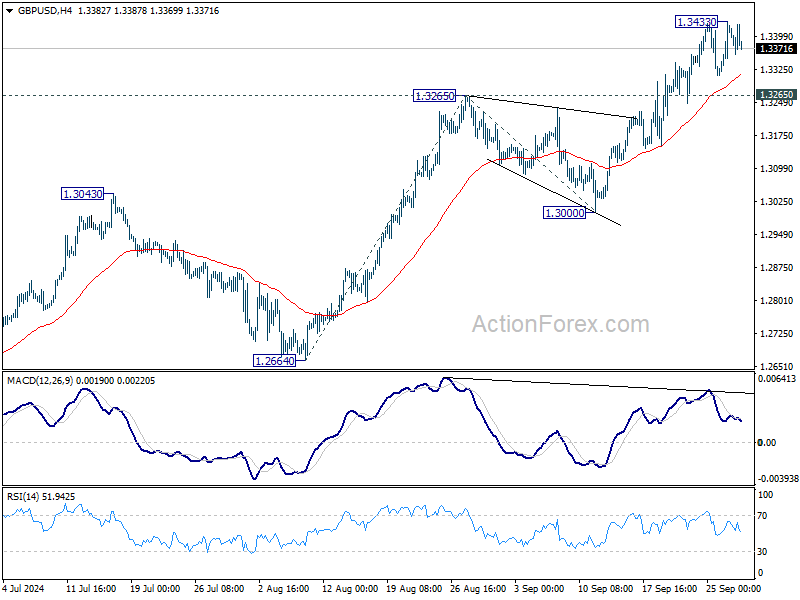
GBP/USD rose further to 1.3433 last week but turned sideway since then. Initial bias remains neutral this week for some more consolidations. But further rally is expected as long as 1.3265 resistance turned support holds. Above 1.3433 will resume larger rise to 100% projection of 1.2664 to 1.3265 from 1.3000 at 1.3601 next. Nevertheless, considering bearish divergence condition in 4H MACD, firm break of 1.3265 will indicate short term topping and turn bias back to the downside for 1.3000 support instead.
In the bigger picture, up trend from 1.0351 (2022 low) is in progress. Next target is 61.8% projection of 1.0351 to 1.3141 from 1.2298 at 1.4022. For now, outlook will stay bullish as long as 1.3000 support holds, even in case of deep pullback.
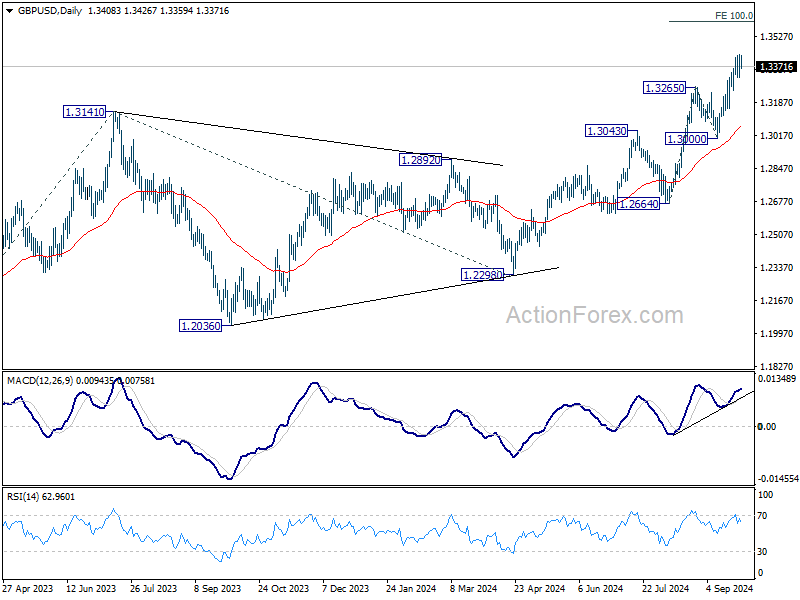
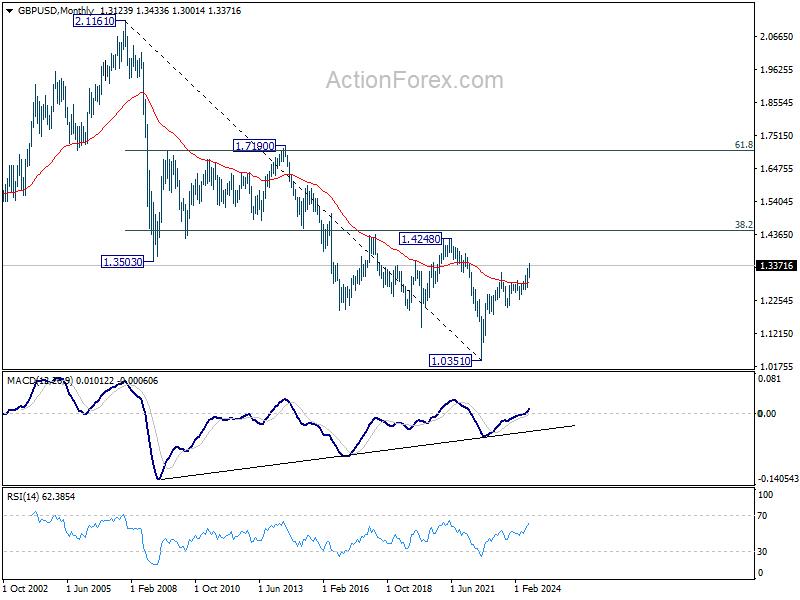
In the long term picture, as long as 1.2298 support holds, rise from 1.0351 long term bottom is expected to continue. The strong break of 55 M EMA (now at 1.2811) is a sign of bullish trend reversal. Yet, break of 1.4248 structural resistance is needed confirm. Otherwise, price actions from 1.0351 could just be part of a consolidation pattern.