

Sample Category Title
GBP/USD Daily Outlook
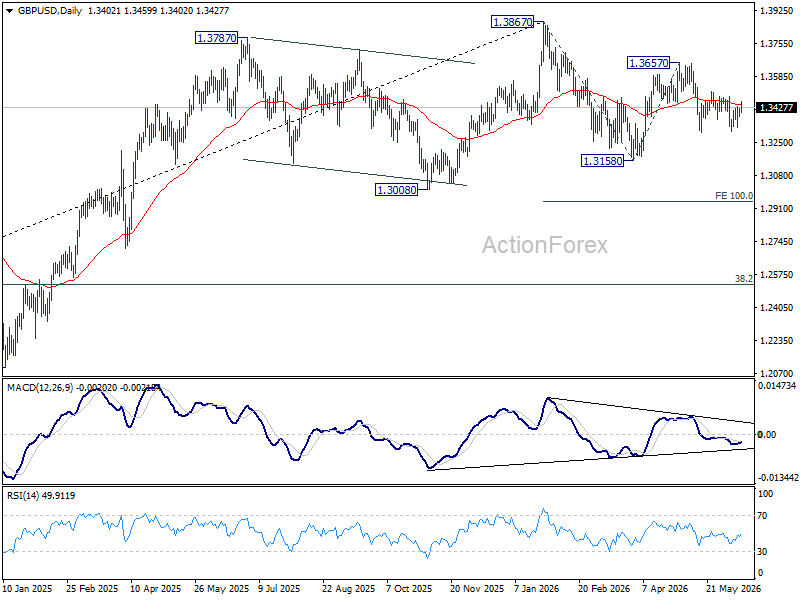
Range trading continues in GBP/USD and intraday bias remains neutral. Risk will stay mildly on the downside as long as 1.3508 resistance holds. Firm break of 1.3300 will resume the decline from 1.3657 to 1.3158 support next. However, break of 1.3508 will turn bias back to the upside for retesting 1.3657 instead.
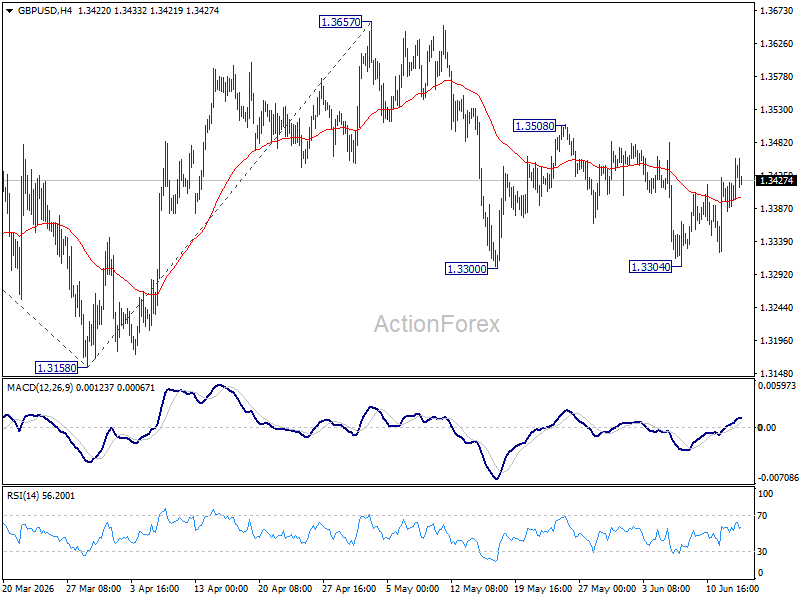
In the bigger picture, price actions from 1.3867 are a corrective pattern within the broader up trend from 1.0351 (2022 low). With 1.3008 support intact, medium term bullishness is maintained and break of 1.3867 is in favor for a later stage, towards 1.4248 key resistance (2021 high). However, firm break of 1.3008 will at least bring deeper fall to 38.2% retracement of 1.0351 to 1.3867 at 1.2524, with increased risk of bearish reversal.
USD/CHF Daily Outlook
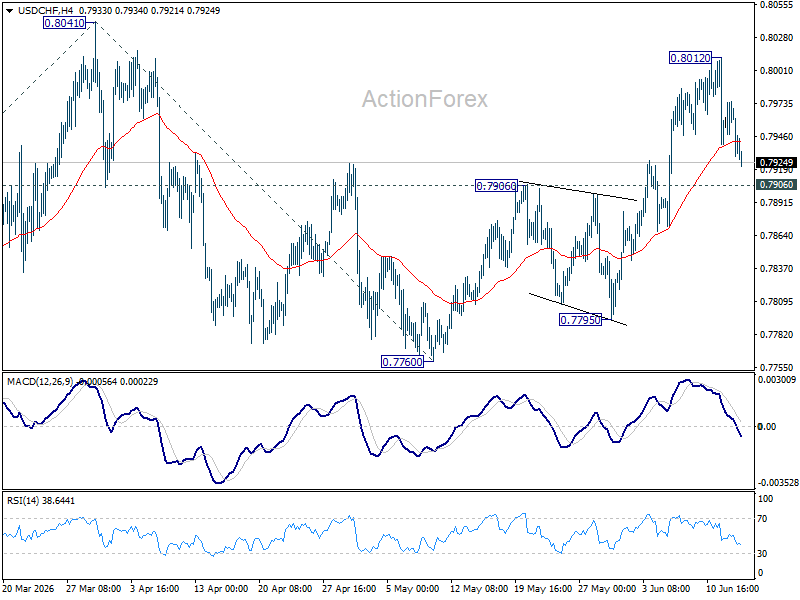
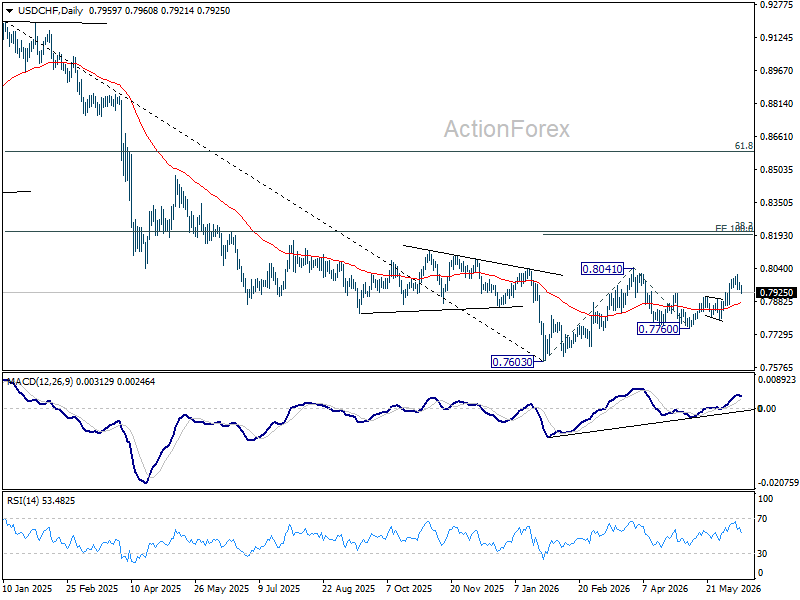
USD/CHF's retreat from 0.8012 extends lower today, but downside is supported above 0.7906 resistance turned support. Intraday bias remains neutral and further rise is expected. Above 0.8012 will bring retest 0f 0.8041 high. Firm break there will resume the rise from 0.7603 and target 100% projection 0.7603 to 0.841 from 0.7600 at 0.8198 next. However, sustained break break of 0.7906 will turn bias back to the downside for 0.7795 support instead.
In the bigger picture, while a medium term bottom was formed at 0.7603, it's still early to call for bullish trend reversal. As long as 38.2% retracement of 0.9200 (2025 high) to 0.7603 at 0.8213 holds, the larger down trend could still continue through 0.7603 at a later stage. However, firm break of 0.7603 will argue that the trend has reversed and turn focus to 0.8332 support turned resistance (2023 low) for confirmation.
AUD/USD Daily Report
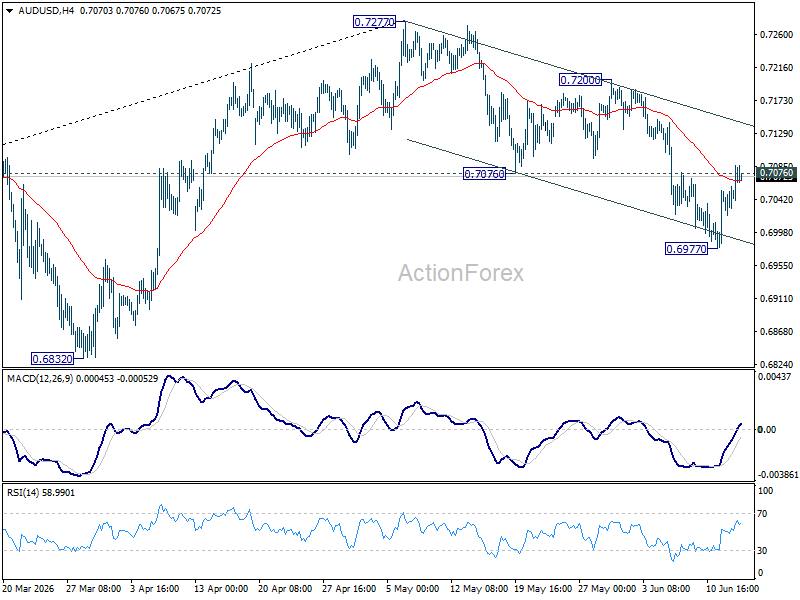
AUD/USD's break of 0.7076 support turned resistance argues that fall from 0.7277 might have completed as as three wave correction at 0.6977. Intraday bias is back on the upside for 0.7200 resistance. On the downside, though, break of 0.6977 will resume the fall towards 0.6832 support.
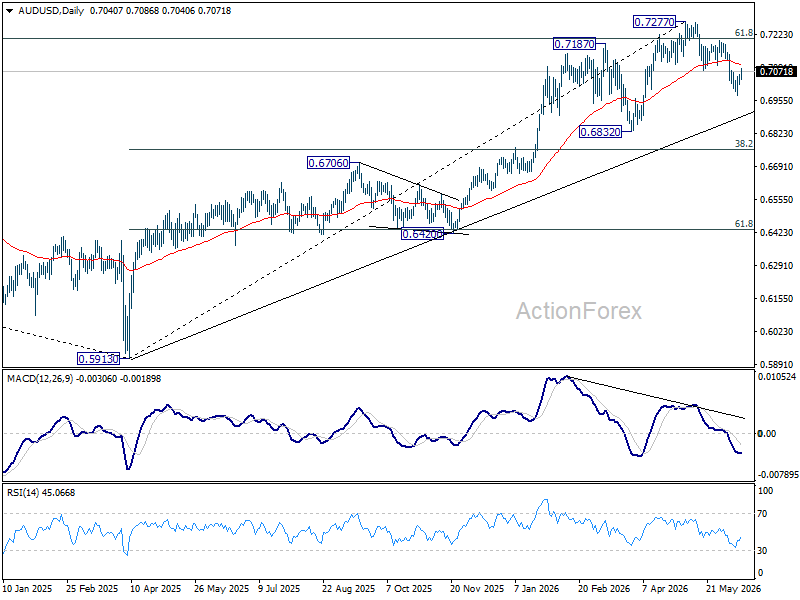
In the bigger picture, considering bearish divergence condition in D MACD, a medium term top could be formed at 0.7277 after failing to sustain above 61.8% retracement of 0.8006 (2021 high) to 0.5913 (2024 low) at 0.7206). Deeper fall could be seen to 38.2% retracement of 5913 to 0.7277 at 0.6756 as a correction. But strong support should be seen there to bring rebound. Consolidations would continue below 0.7277 for a while.
USD/CAD Daily Outlook
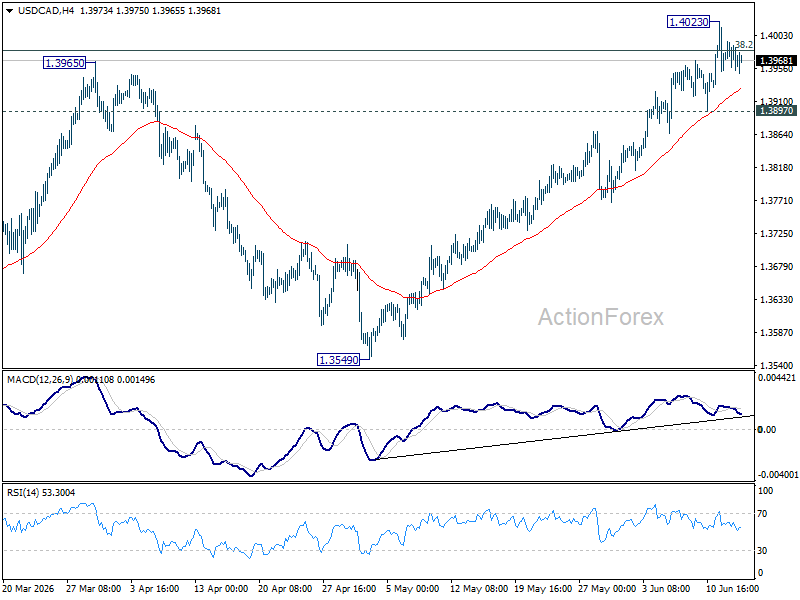
Intraday bias in USD/CAD is turned neutral first with current retreat. Further rise is expected as long as 1.3897 support holds. On the upside, sustained break of 38.2% retracement of 1.4791 to 1.3480 at 1.3981. Decisive break there will carry larger bullish implications and target 61.8% retracement at 1.4290 next. However, firm break of 1.3897 will turn bias back to the downside for deeper pullback.
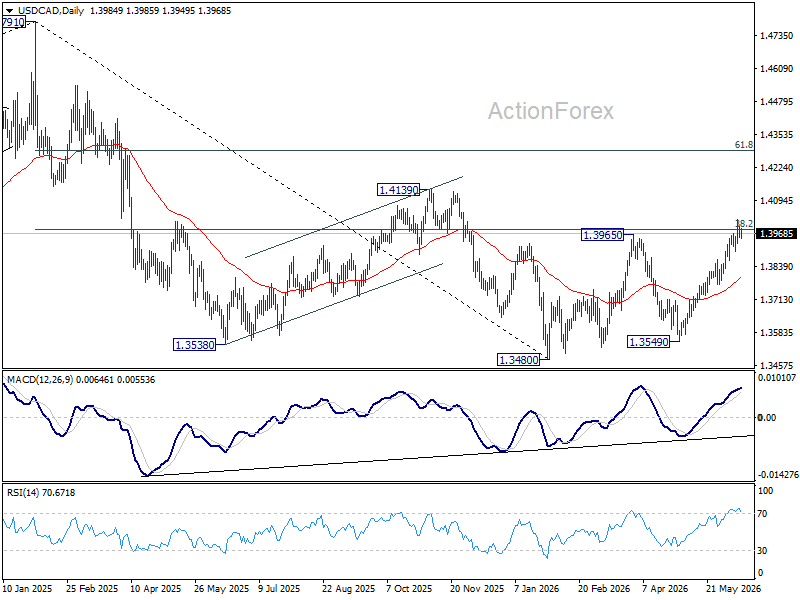
In the bigger picture, price actions from 1.4791 are seen as a corrective pattern to the whole up trend from 1.2005 (2021 low). Rejection by 38.2% retracement of 1.4791 to 1.3480 at 1.3981 will keep the decline intact, and bring another fall through 1.3480 at a later stage. However, firm break of 1.3981 will argue that the decline has completed, and set up further rise back to retest 1.4791 instead.
GBP/JPY Daily Outlook
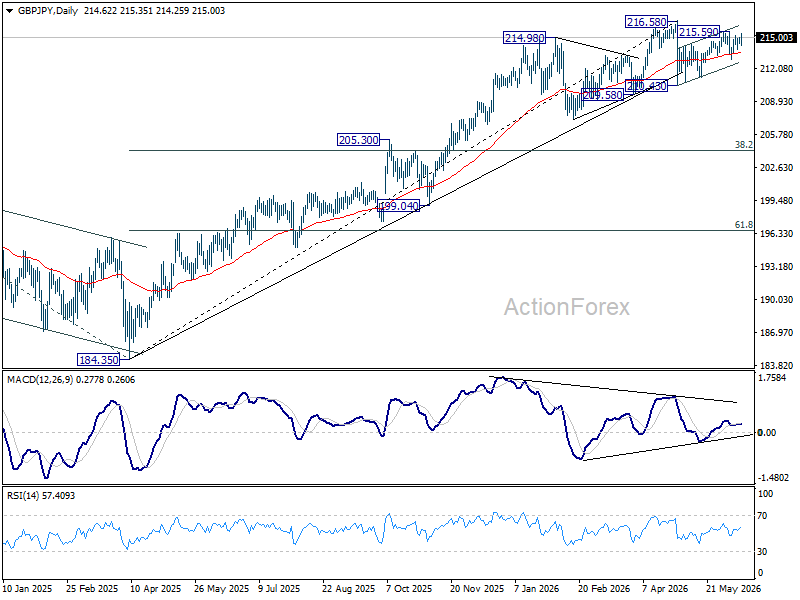
GBP/JPY is still bounded in range of 212.90/215.59 at this point, and intraday bias remains neutral. On the upside, above 215.59 will resume the rise from 210.43 to retest 216.58 high. On the downside, break of 212.90 will resume the fall from 215.59 to 211.23 support first.
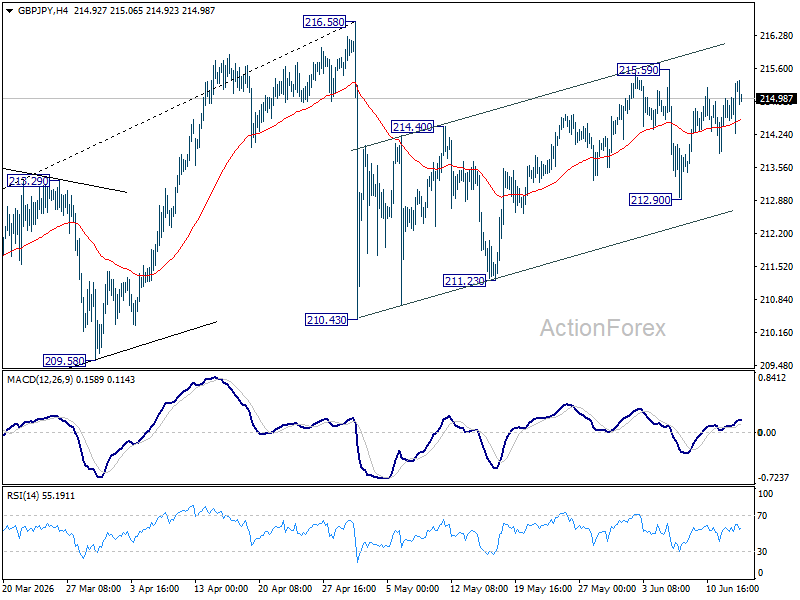
In the bigger picture, there is no clear sign of trend reversal yet. The long term up trend could still extend to 61.8% projection of 148.93 (2022 low) to 208.09 (2024 high) from 184.35 at 220.90 on resumption. However, sustained break of 55 W EMA (now at 207.11) will argue that it's already in medium term down trend for 184.35 support.
EUR/JPY Daily Outlook
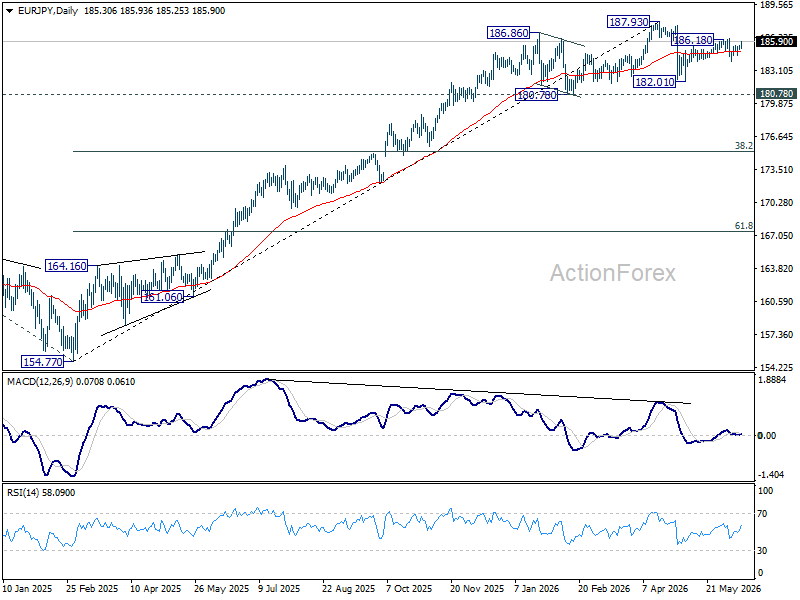
EUR/JPY is still bounded in range of 183.95/186.18 despite the current rebound. Intraday bias stays neutral at this point. On the upside, firm break of 186.18 will resume the rebound from 182.01 to retest 187.93 high. On the downside, break of 183.95 will resume the fall from 186.18 to 182.01 support and below.
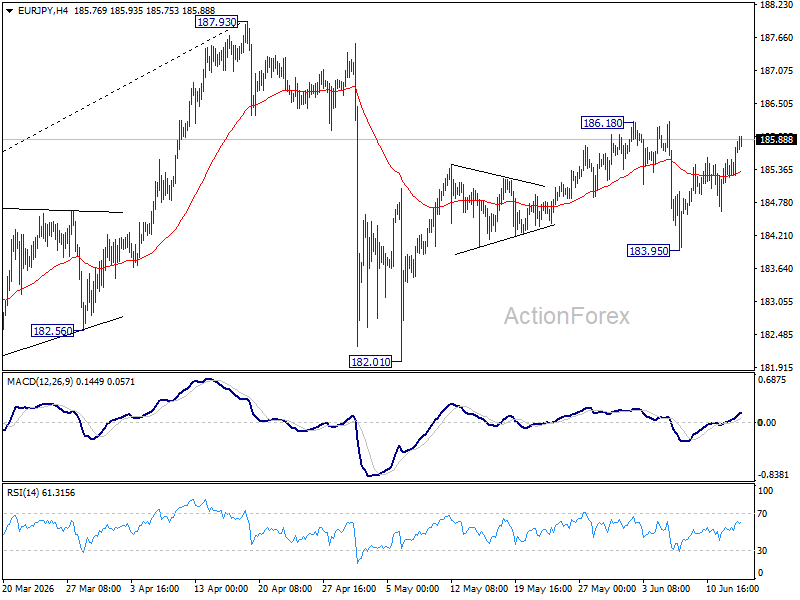
In the bigger picture, there is no sign of reversal yet. Uptrend from 114.42 (2020 low) is still expected to resume at a later stage to 78.6% projection of 124.37 (2022 low) to 175.41 (2025 high) from 154.77 at 194.88. However, sustained break of 55 W EMA (now at 179.23) will argue that it's already in a medium term down trend to 175.41 resistance turned support and below.
EUR/GBP Daily Outlook
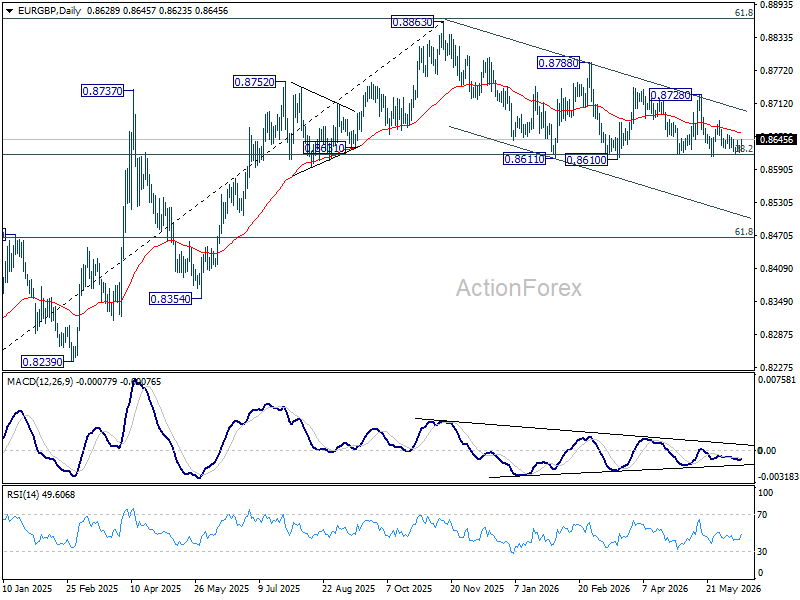
Intraday bias in EUR/GBP remains neutral as range trading continues. On the downside, decisive break of 0.8610 support will revive the case of bearish trend reversal. However, on the upside, break of 0.8680 resistance will bring stronger rebound back to 0.8728 instead.
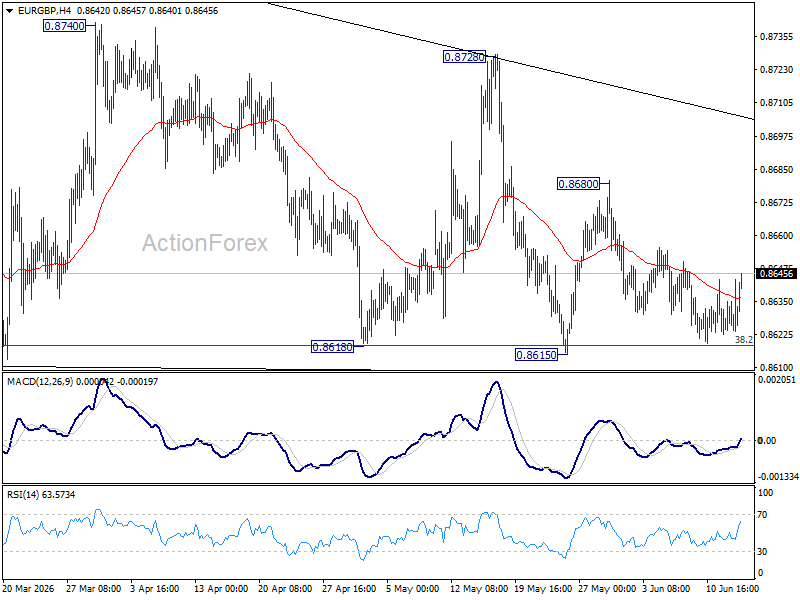
In the bigger picture, focus is staying on 38.2% retracement of 0.8821 to 0.8863 at 0.8618. Strong rebound from there will retain medium term bullishness. Rise from 0.8221 should resume through 0.8863 at a later stage. Nevertheless, sustained break of 0.8618 will confirm that whole rise from 0.8221 has completed at 0.8863. Deeper decline should then be seen to 61.8% retracement at 0.8466 at least.
EUR/AUD Daily Outlook
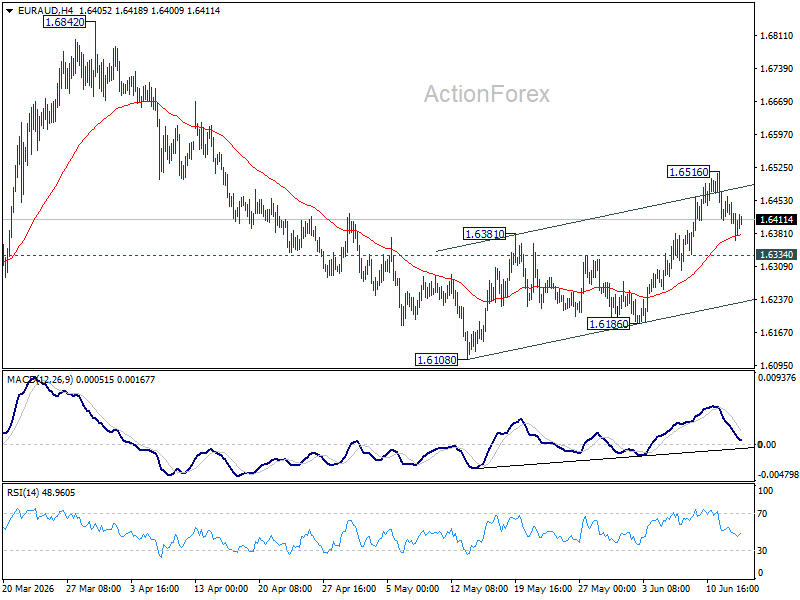
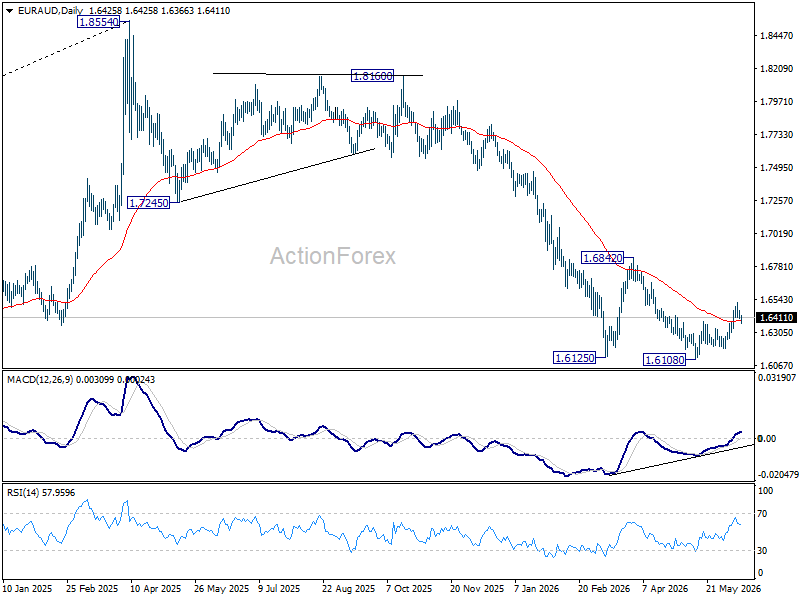
Intraday bias in EUR/AUD remains neutral for consolidations below 1.6156. Further rise will remain in favor as long as 1.6334 minor support holds. Above 1.6516 will resume the rebound from 1.6108, and target 1.6842 resistance. However, firm break of 1.6334 will turn bias back to the downside for 1.6108/6186 support zone instead.
In the bigger picture, outlook will stay bearish as long as 1.6842 resistance holds. Fall from 1.8554 (2025 high) is expected to continue to 61.8% retracement of 1.4281 to 1.8554 at 1.5913. Decisive break there will pave the way back to 1.4281 (2022 low). However, firm break of 1.6842 should confirm medium term bottoming, and bring stronger rally.
EUR/CHF Daily Outlook
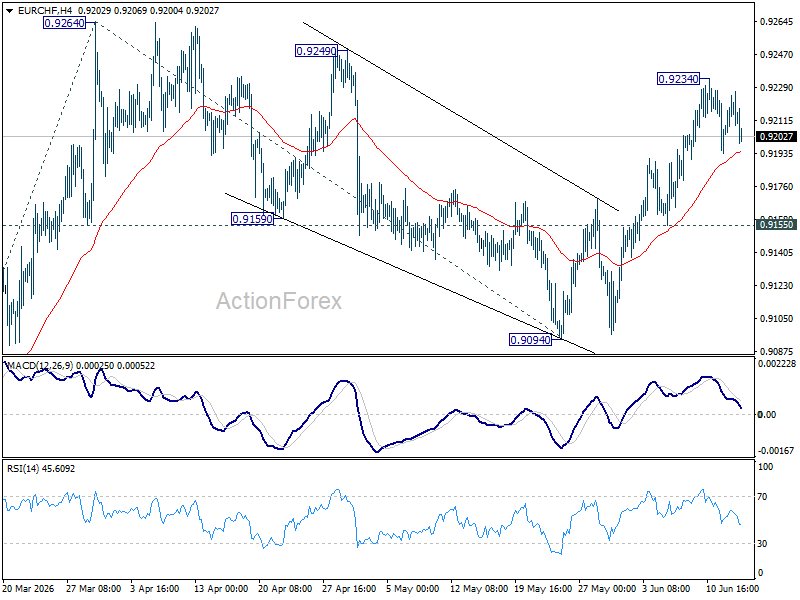
EUR/CHF is staying in consolidations below 0.9234 and intraday bias remains neutral. Outlook is unchanged that corrective fall from 0.9264 should have completed at 0.9094. Above 0.9234 will bring retest of 0.9264 first. Firm break there will resume the rally from 0.8979 to 100% projection of 0.8979 to 0.9264 from 0.9094 at 0.9379. Risk will now stay on the upside as long as 0.9155 support holds.
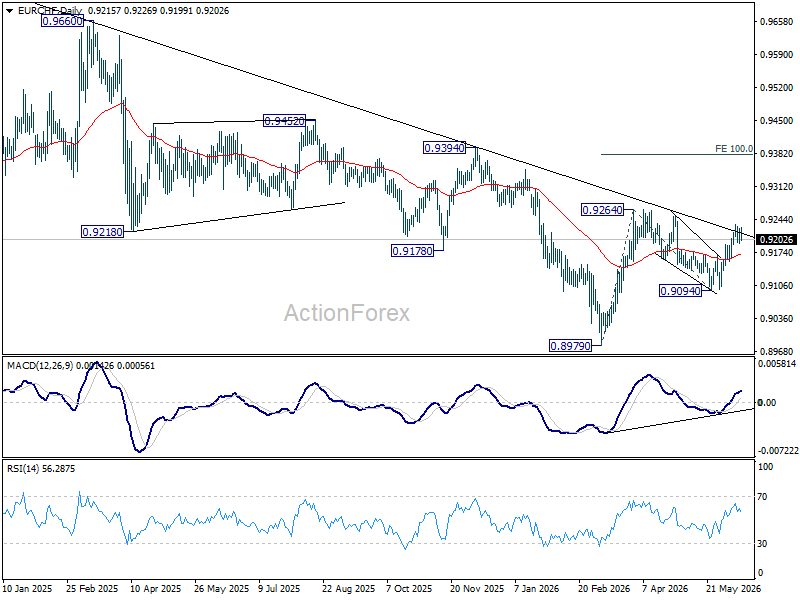
In the bigger picture, as long as 0.9394 resistance holds, down trend from 0.9928 (2024 high) could still be in progress. Firm break of 0.8979 will confirm down trend resumption. However, decisive break of 0.9394 will be an important sign of medium term bullish reversal.
Risk-On “Taco” Redux: Intraday Outlook on NASDAQ 100, Djia, AUD/USD and Gold
Key takeaways
- A surprise US-Iran interim agreement has triggered a powerful risk-on rally, with Nasdaq 100 futures surging 3% and S&P 500 futures gaining 2% as traders aggressively unwind geopolitical risk premiums tied to the Strait of Hormuz disruption.
- Nasdaq 100, Dow Jones, AUD/USD, and Gold have all posted bullish gap-ups, but their advances remain vulnerable to reversal if key support levels fail, particularly given the absence of a signed agreement and published deal details.
- Several hidden risks remain unresolved, including sanctions relief terms, Iran’s proposed transit fees for Hormuz shipping, and the possibility of unilateral Israeli military actions that could rapidly derail the current optimism and trigger renewed market volatility.
A remarkable turn of events, the announcement of an interim agreement between the US and Iran in today’s early Asia session (Monday, 15 June) to end hostilities and reopen the vital energy chokepoint, the Strait of Hormuz, triggered a massive spark of risk-on behaviour in global markets.
US President Trump has already posted “teasers” on his social media since last Friday, 12 June, despite Iran not confirming that an imminent deal will be signed on Sunday. Interestingly, this interim deal materialised after Trump backed down on his “harsh threat” to attack Iran on the last Thursday, giving rise to the “Trump always chickens out-TACO” trade narrative.
The E-mini futures of the S&P 500 and Nasdaq 100 staged a tremendous gap up today, rallying by 2% and 3%, respectively, and almost erased 90% of the losses inflicted by the prior 2-week minor corrective decline from their respective all-time highs printed at the start of June 2026 to the 11 June 2026 low.
Let’s look at the intraday technical charts of several key instruments that benefit from this raging near-term bullish sentiment before we tackle the “hidden risks”.
Nasdaq 100 – Gap up above 20-day moving average
Fig. 1: US Nasdaq CFD minor trend as of 15 Jun 2026 (Source: TradingView). The information presented is historical information, and past performance is not indicative of future performance.
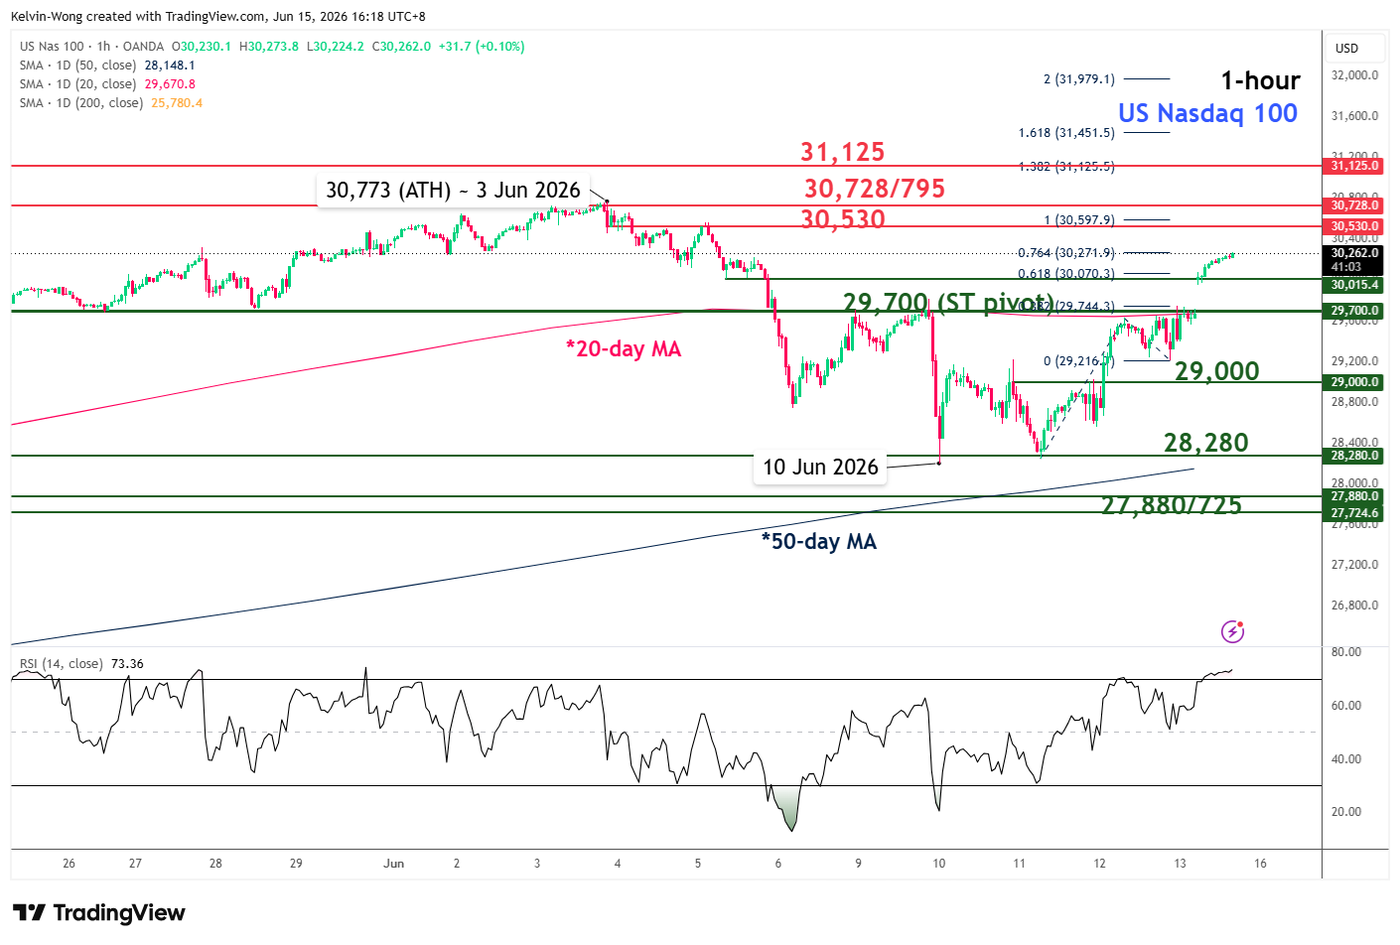
The price action of the US Nasdaq 100 CFD (a proxy of the Nasdaq 100 E-mini futures) has staged a bullish gap up in today’s opening session and reintegrated back above the 20-day moving average, which suggests the emergence of a minor bullish trend from the 10 June 2026 low (see Fig. 1).
Watch the 29,700 key short-term pivotal support (also the 20-day moving average) for a further potential push up towards 30,530 and the current all-time high area of 30,728/795. A clearance above 30,795 points to the next intermediate resistance at 31,125 (Fibonacci extension).
On the other hand, a break with an hourly close below 29,700 invalidates the bullish tone, and a bull trap is likely to materialise, leading to a drop back towards 29,000 and even 28,280 (also the 50-day moving average).
Dow Jones (DJIA) – Oscillating within a minor ascending channel
Fig. 2: US Wall Street 30 CFD minor trend as of 15 Jun 2026 (Source: TradingView). The information presented is historical information, and past performance is not indicative of future performance.
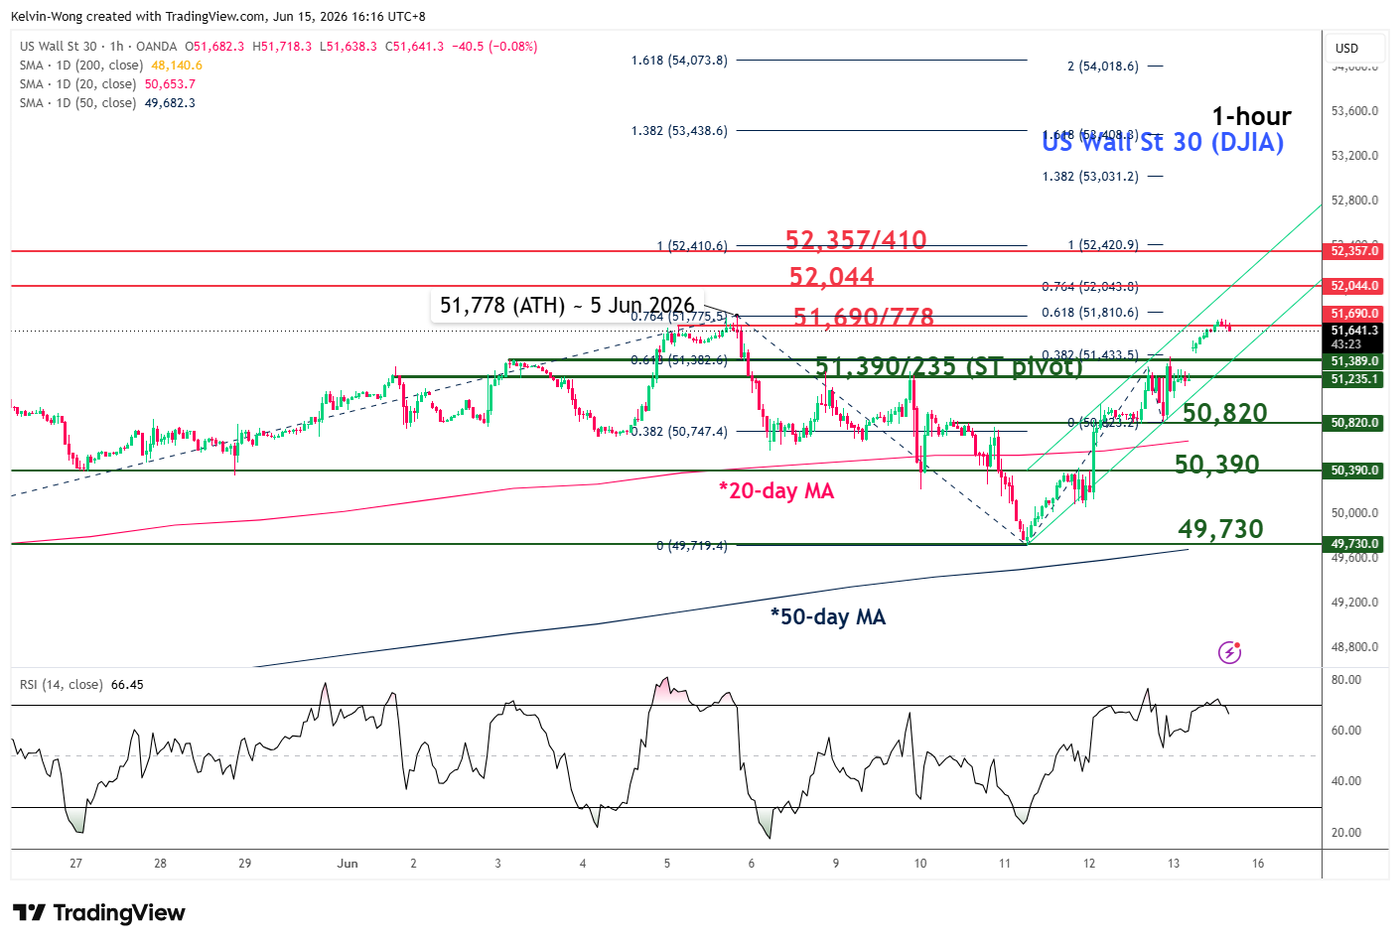
The price action of the US Wall Street 30 CFD (a proxy for the Dow Jones Industrial Average E-mini futures) has traded back above the 20-day moving average since last Friday, 12 June.
Today’s Asia opening session, bullish gap-up, has reinforced an ongoing minor bullish trend launched from the recent 11 June 2026 low.
Watch the 51,390/235 key short-term pivotal support, and a clearance above the current all-time high of 51,778 targets the next intermediate resistances at 52,044, followed by 52,357/410 (Fibonacci extension cluster) (see Fig. 2).
However, a breakdown with an hourly close below 51,235 negates the bullish tone for a drop to retest the next intermediate support at 50,820 (also close to the 20-day moving average).
AUD/USD – Corrective rebound towards 20-day and 50-day moving averages
Fig. 3: AUD/USD minor trend as of 15 Jun 2026 (Source: TradingView). The information presented is historical information, and past performance is not indicative of future performance.
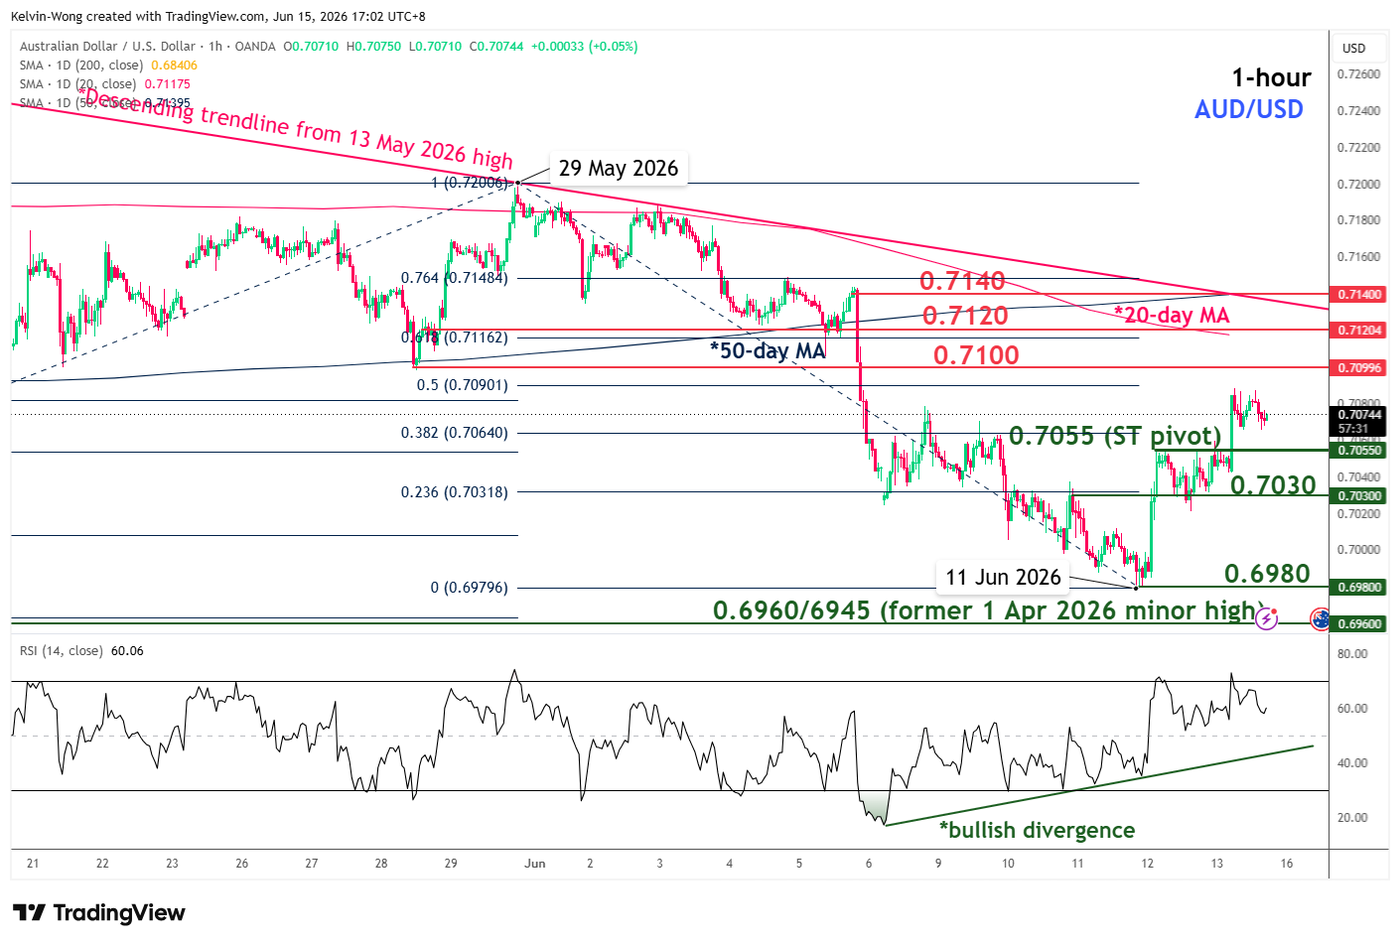
The risk-on proxy, the Aussie dollar, has benefited from the intraday recovery in global stock markets today.
The AUD/USD has been oscillating within a potential medium-term downtrend since the 13 May 2026 high, as price action continues to trade below the 20-day and 50-day moving averages.
However, today’s intraday bullish price action and the bullish momentum conditions seen on the hourly RSI (a series of higher lows after a bullish divergence condition on last Wednesday, 10 June) have kick-started a potential minor corrective rebound sequence for the AUD/USD (see Fig. 3).
Watch the 0.7055 key short-term pivotal support for a further potential push-up towards the next intermediate resistances at 0.7100 and 0.7120/7140 (also the 61.8%/76.4% Fibonacci retracement of the prior decline from the 29 May 2026 high to 11 June 2026 low).
On the flip side, a break and an hourly close below 0.7055 invalidates the corrective rebound sequence and puts the onus back on the bears to retest 0.7030 and 0.6980.
Gold (XAU/USD) – Extension of minor corrective rebound to retest 200-day MA
Fig. 4: Gold (XAU/USD) minor trend as of 15 Jun 2026 (Source: TradingView). The information presented is historical information, and past performance is not indicative of future performance.
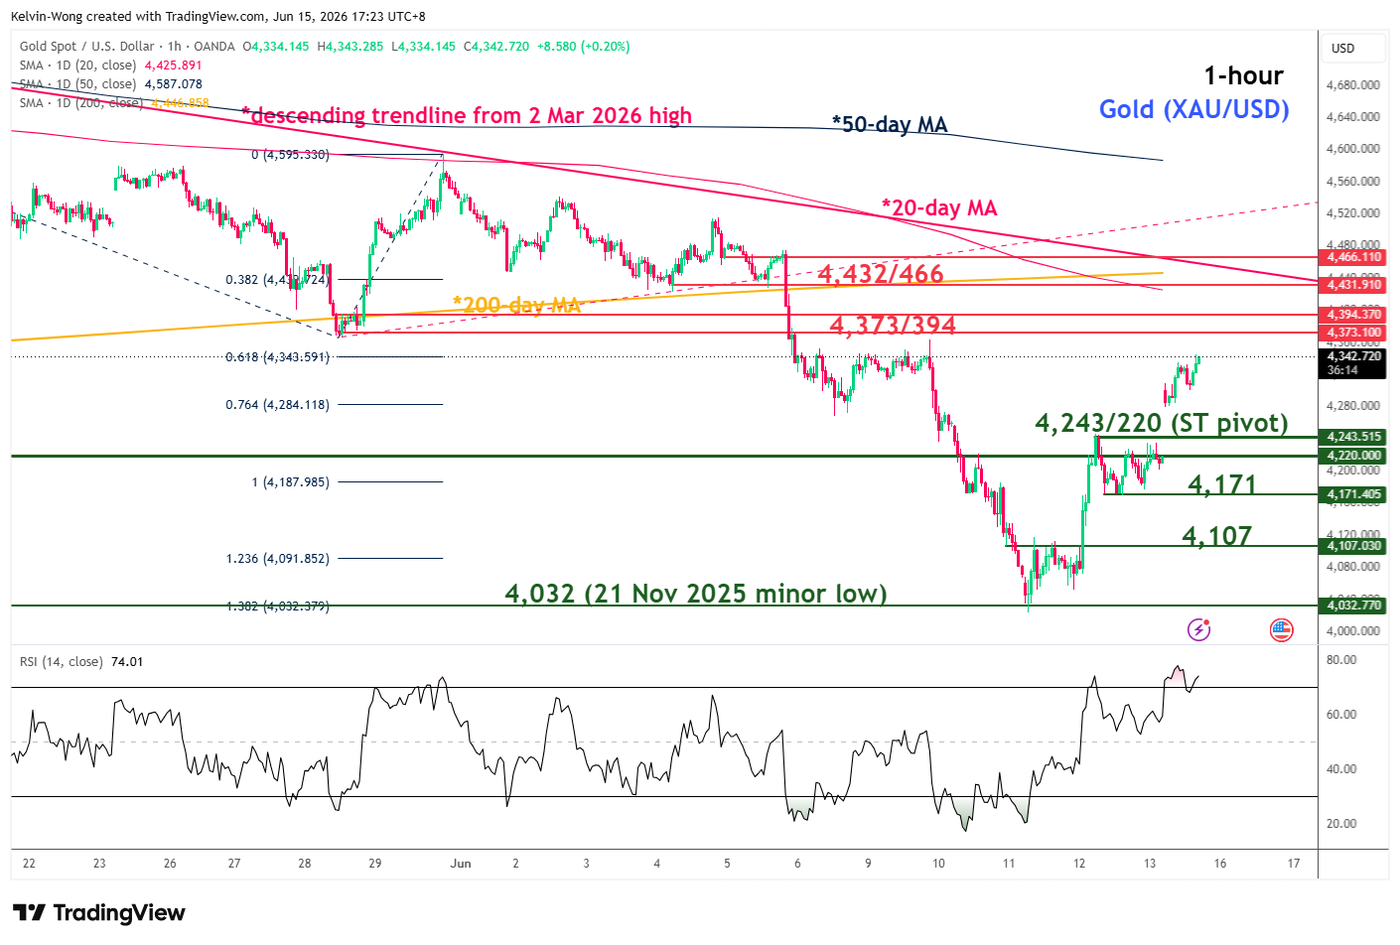
The medium-term downtrend in Gold (XAU/USD) has been in place since the all-time high on 29 January 2026 and remains intact.
Price actions continue to trade below the 20-day, 50-day and 200-day moving averages. The current bullish move is likely to be an extension of the minor correction rebound from the recent 11 June 2026 low at 4,024 (see Fig. 4).
Watch the 4,243/220 short-term pivotal support (today’s Asia opening session gap up) to maintain the corrective rebound sequence to seek out the next intermediate resistance at 4,373/394 before 4,432/466 (also the key 200-day moving average).
On the other hand, a breakdown and an hourly close below 4,220 invalidate the minor corrective rebound sequence, turning the focus back to the bears for a drop to retest 4,171 and 4,107 in the first step.
Now, here are the hidden risks that can derail the current bout of risk-on behaviour.
What we do not know (the opaque details and hidden risks)
No released text: The single biggest warning flag is that no official text has been released. Iran maintains that nothing will be published until the ink dries on Friday, 19 June, which is supposed to be the official signing of the interim peace-deal agreement in Switzerland.
The Toll dispute: There is a blatant public mismatch in rhetoric. Trump forcefully stated on social media and to The New York Times that the Strait of Hormuz will be a “toll-free" opening. Simultaneously, Iranian Foreign Minister Abbas Araghchi and state media have indicated that, while they support the opening, Iran still intends to charge service and transit fees to vessels.
Sanctions specifics: We don’t know the exact scope of the sanctions’ relief. Is the US allowing unrestricted crude flows, or is it a tightly capped waiver system subject to good behaviour during the 60-day nuclear talks?
The Israel wildcard: Hours before the peace-deal announcement, Israel launched highly disruptive airstrikes on Beirut. Far-right members of Isreal PM Netanyahu’s cabinet have already openly slammed the US-Iran deal. Because Israel is not a signatory to this MOU, it retains total operational freedom. A unilateral Israeli strike on Iranian domestic assets or a refusal to halt the Lebanon campaign would instantly trigger a collapse of the permanent ceasefire.