Sample Category Title
US initial jobless claims fall to 218k, vs exp 226k
US initial jobless claims fell -4k to 218k in the week ending September 21, below expectation of 226k. Four-week moving average of initial claims fell -3.5k to 225k.
Continuing claims rose 13k to 1834k in the week ending September 14. Four-week moving average of continuing claims fell -6.5k to 1836k.
US durable goods orders flat in Aug ex-transport rises 0.5% mom
US durable goods orders rose 0.0% mom to USD 289.7B in August, much better than expectation of -2.8% mom decline. Ex-transport orders rose 0.5% mom to USD 188.5B, above expectation of 0.1% mom. Ex-defense orders fell -0.2% mom to USD 271.0B. Electrical equipment, appliances, and components, up two of the last three months, drove the increase, USD 0.3 billion or 1.9% mom to USD 14.4B.
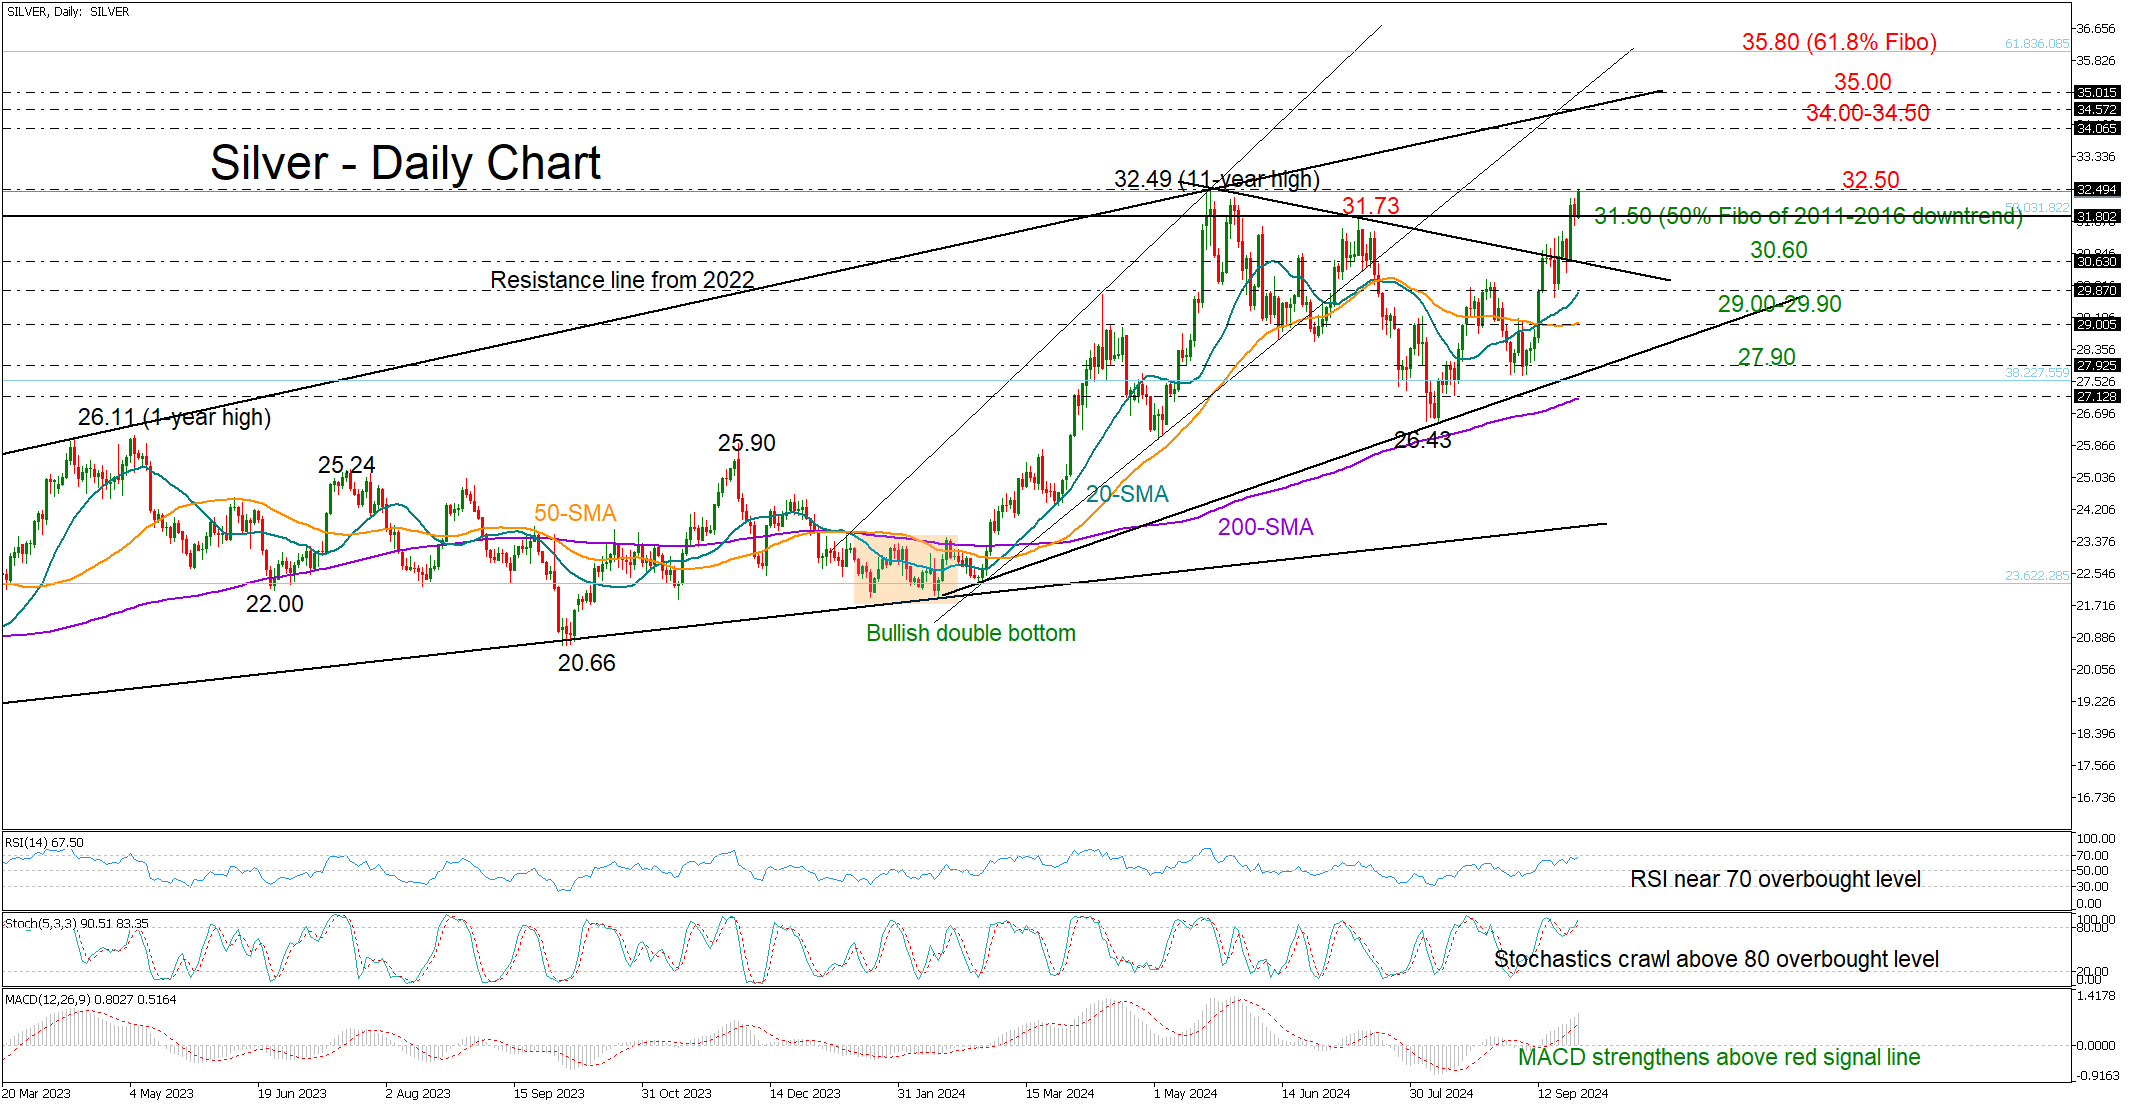
Silver on the Verge of a Major Bullish Trend Reversal
- Silver bulls roar back; make efforts to resume long-term uptrend above 32.49
- Price hovers near overbought zone; trend signals remain encouraging above 31.50
Silver made a comeback on Thursday after a temporary pause, with scope to challenge May’s eleven-year high of 32.49, which it didn’t reach in July.
The rebound near the broken resistance line at 30.60 indicated a bullish trend reversal recently, and although the RSI and stochastic oscillator are near overbought levels, they haven’t peaked yet, reflecting persisting buying interest. Note that the MACD is also on the rise above its red signal line and beneath its April-May peak area.
A breakthrough above 32.49 could propel the bulls towards the psychological level of 34.00 and the critical resistance line from December 2022 at 34.50. Crawling above 35.00, the price may next target the 61.8% Fibonacci level of the 2011-2016 downtrend at 35.80.
A pullback below 31.50 may stall instantly near the former resistance trendline at 30.60. The 20- and 50-day simple moving averages (SMAs) could next come to the rescue at 29.90 and 29.00 respectively. If not, the decline could continue towards the tentative 2024 support trendline at 27.90. and the 200-day SMA at 27.12.
To recap, silver is making a push towards its May peak of 32.49, having already eliminated half of the downtrend it experienced between 2011 and 2016. A successful penetration higher could unleash a new bullish wave to 34.00-34.50.
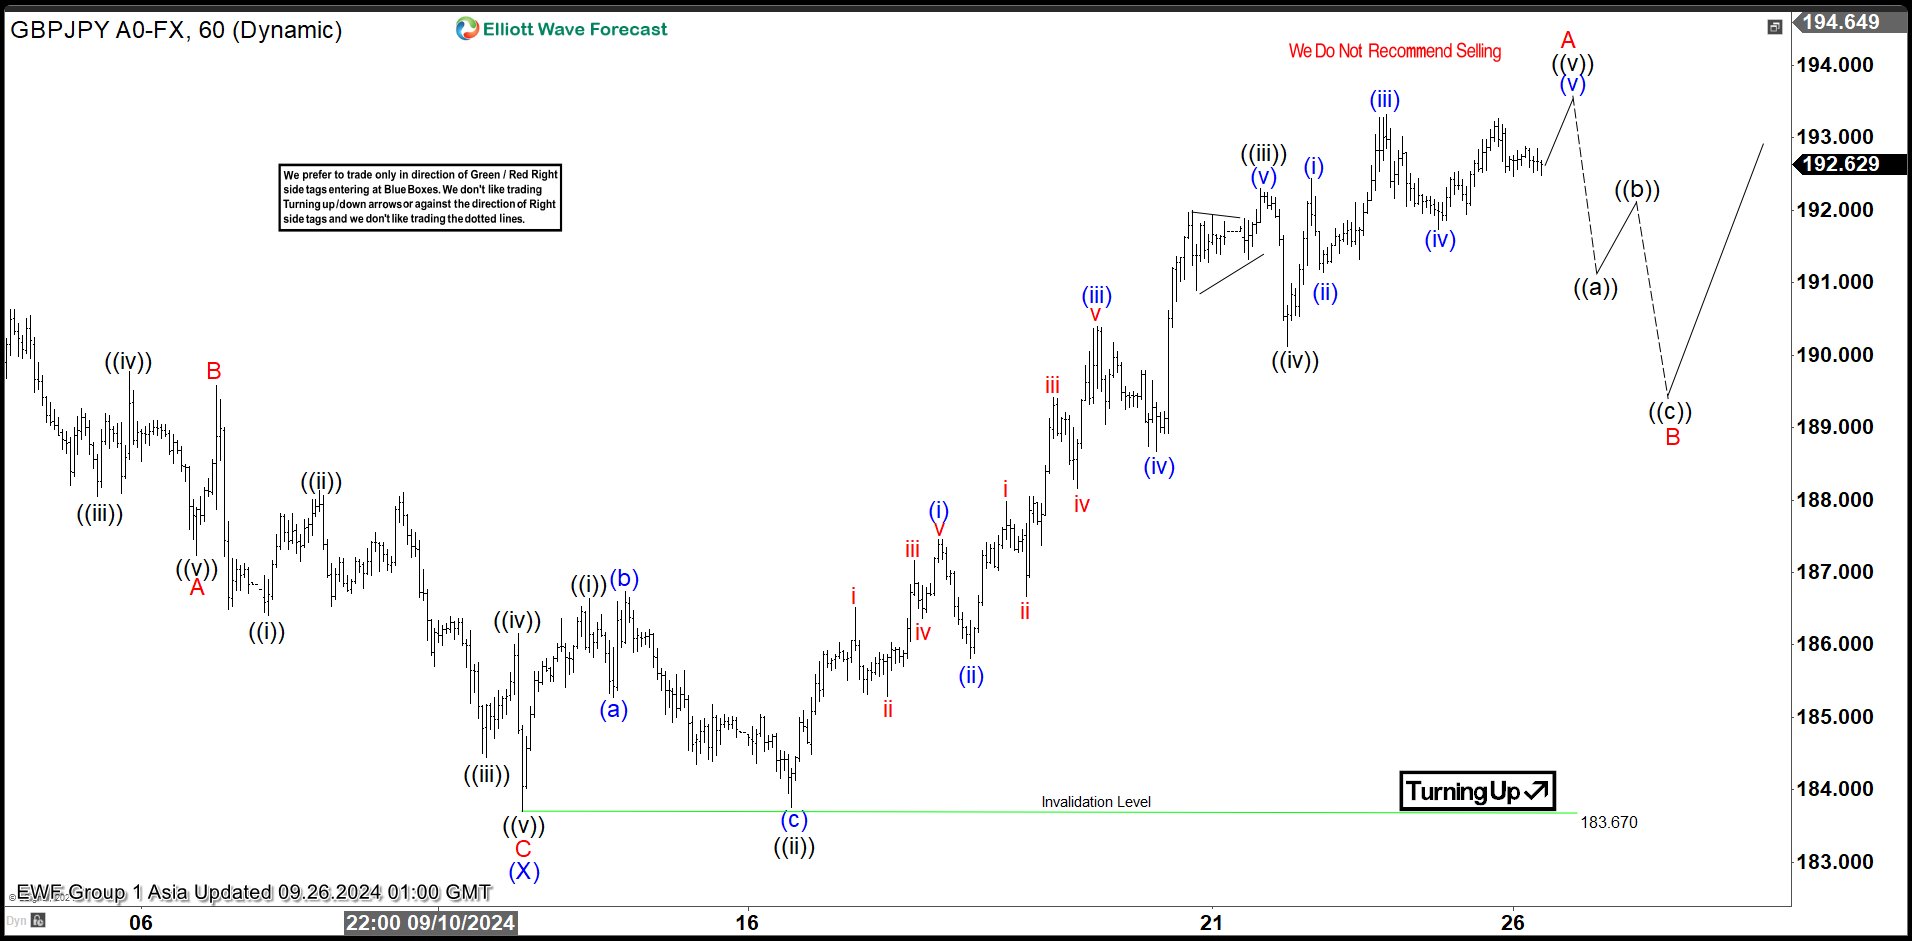
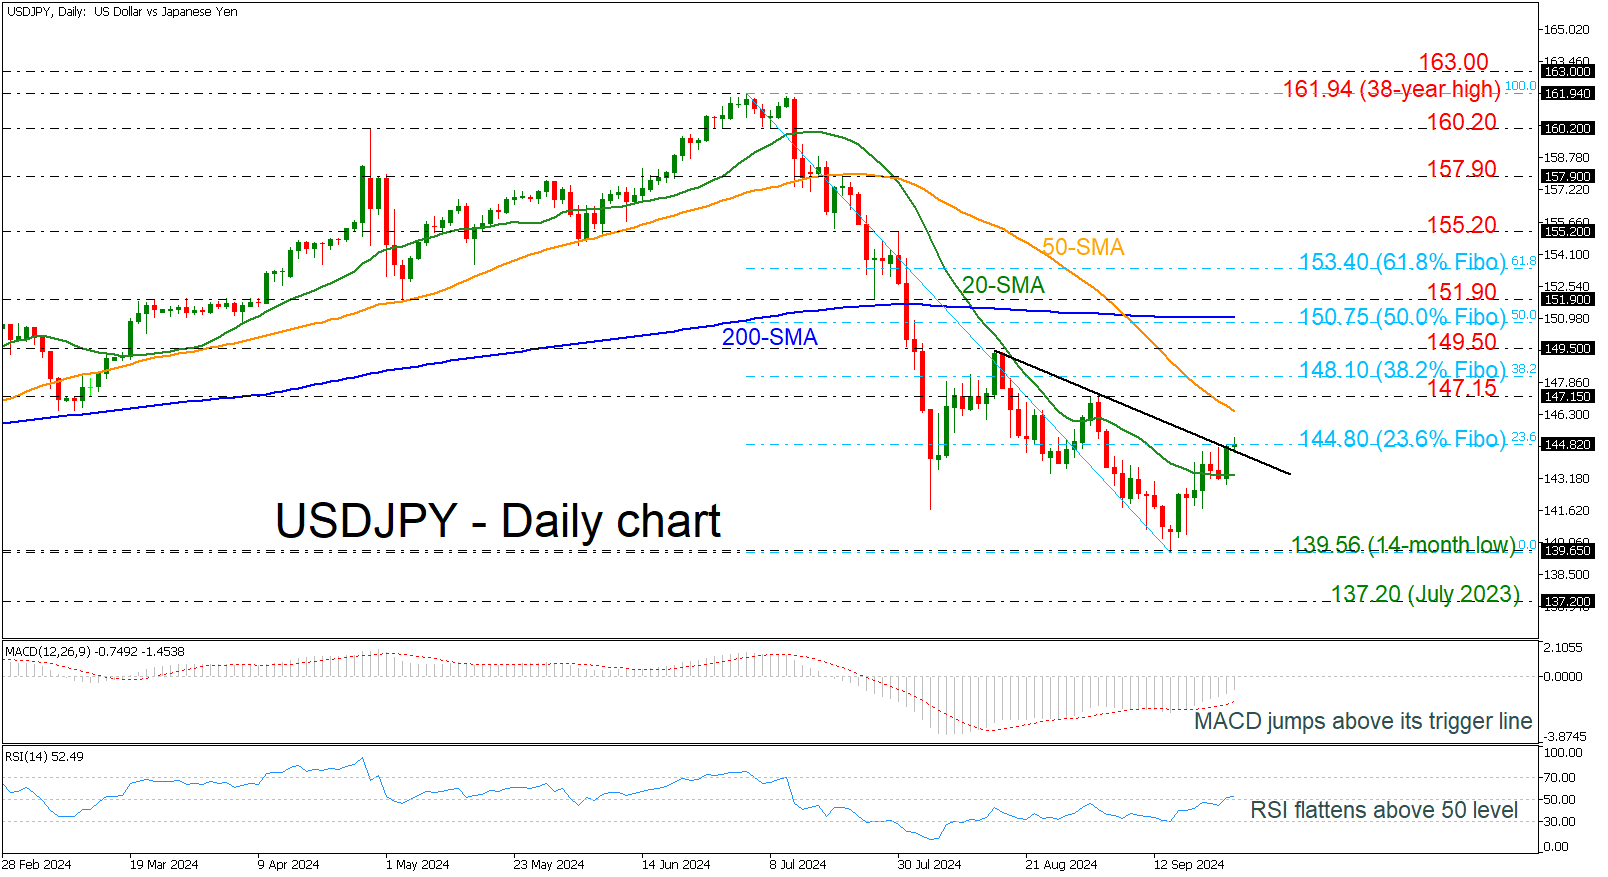
USDJPY Flirts With Short-Term Diagonal Line
- USDJPY tries to surpass the 23.6% Fibonacci
- MACD and RSI gain momentum
USDJPY is challenging the 23.6% Fibonacci retracement level of the down leg from 161.94 to 139.56 at 144.80, as well as the very short-term downtrend line, creating a bullish correction from the 14-month low of 139.56.
The technical oscillators are currently mirroring the market's latest upside movement. The MACD is rising above its trigger line beneath the zero level, while the RSI crossed above the neutral threshold of 50.
More upside pressure could open the door for a test of the 50-day simple moving average (SMA) at 146.50, ahead of the 147.15 barrier. If the bulls overcome these lines, they could meet the 38.2% Fibonacci of 148.10.
Alternatively, if the pair dives below the 20-day SMA of 143.20, it could return to the 14-month low of 139.56 before touching the July 2023 high at 137.20.
Since July, the USDJPY has been trending bearish, and only a rally above the 200-day SMA could shift the bias to neutral.
Swiss Franc Edges Lower After Swiss Central Bank Cuts Rates
The Swiss franc is showing limited movement on Thursday. USD/CHF is trading at 0.8483, down 0.24% on the day. In the US, it’s a busy day with US GDP, unemployment claims and durable goods orders. As well, Federal Reserve Chair Powell and several FOMC members will deliver remarks.
Swiss National Bank lowers rates to 1%
The Swiss National Bank lowered its cash rate by 25 basis points to 1%, its third straight reduction. The cash rate is now at its lowest level since early 2023. The move was not a surprise and the Swiss franc has showed a limited reaction to the rate announcement.
The SNB statement noted that inflation has “decreased significantly”, in part due to the appreciation of the Swiss franc and that inflation, which has fallen to 1.1%, was lower than expected. The statement added that further rate cuts “may become necessary” to ensure price stability.
The stronger Swiss franc has raised the possibility of a currency intervention by the SNB and investors were on the look-out for any hints from the SNB at today’s meeting. The statement didn’t point to any intervention plans, noting that the central bank “remains willing to be active in the foreign exchange market as necessary.” The Swiss franc’s safe haven status has made it an attractive asset at a time of market volatility but this is hurting the critical export sector. The SNB could step in if the Swiss franc continues to appreciate.
The SNB has become a frontrunner among central banks in cutting interest rates, a result of its success in taming inflation. Other major banks have also lowered rates but are still concerned about the upside risk of inflation and have not chopped rates as aggressively as the SNB.
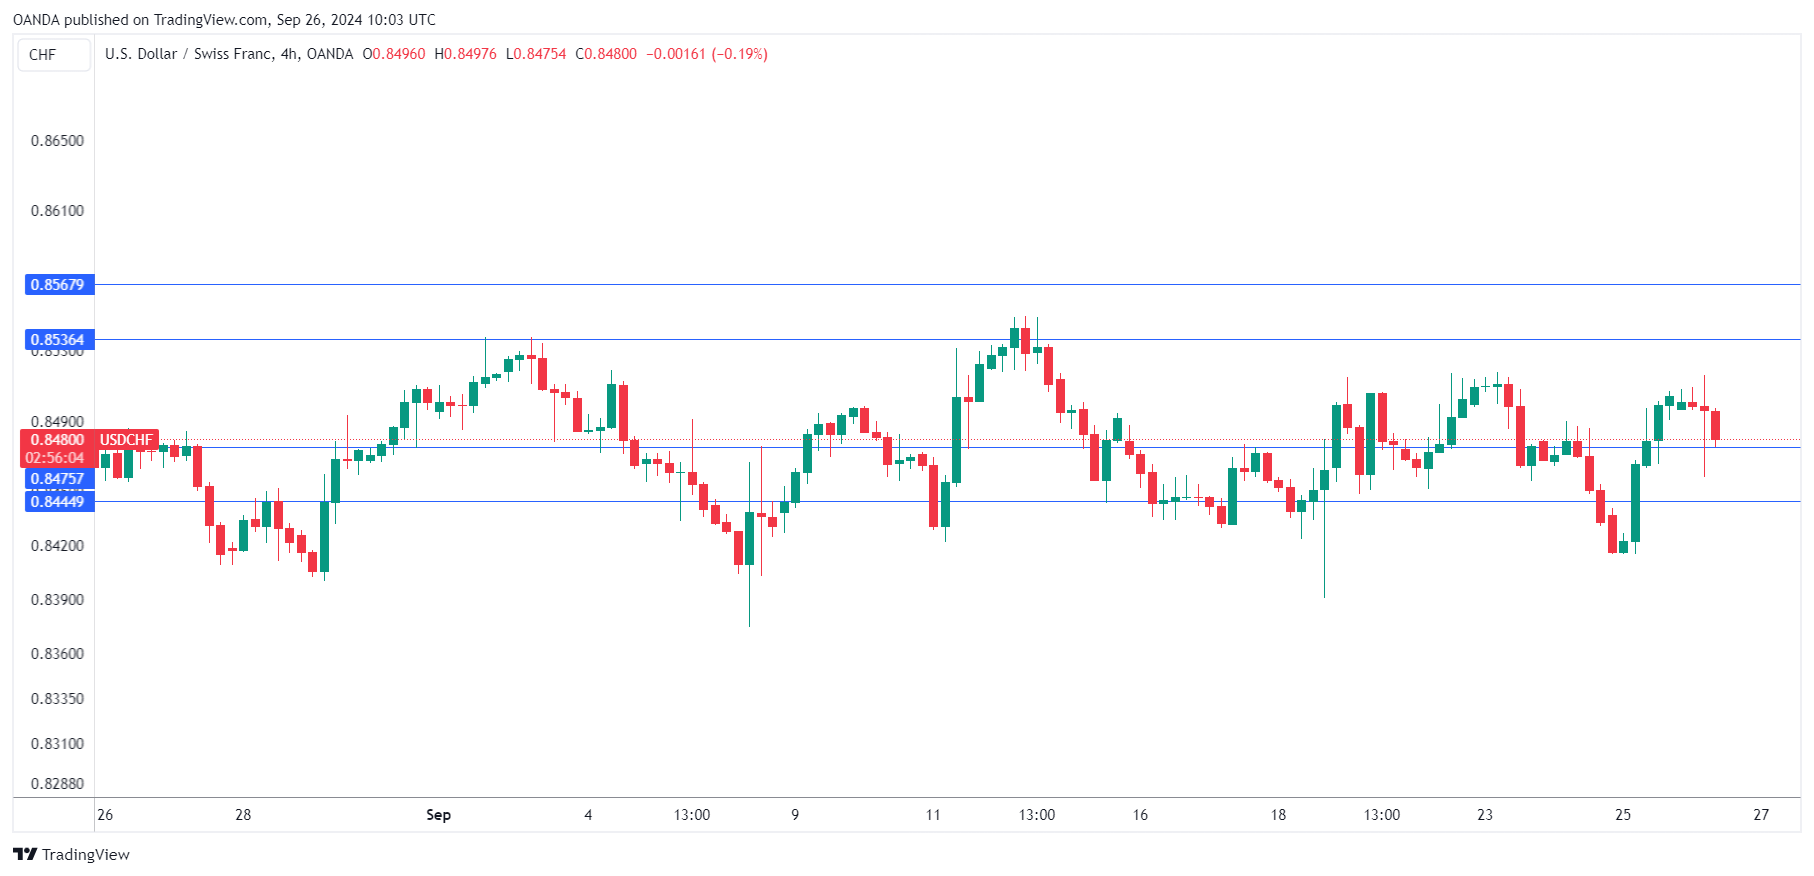
USD/CHF Technical
- USD/CHF is testing support at 0.8475. Below, there is support at 0.8444
- 0.8536 and 0.8567 are the next resistance lines
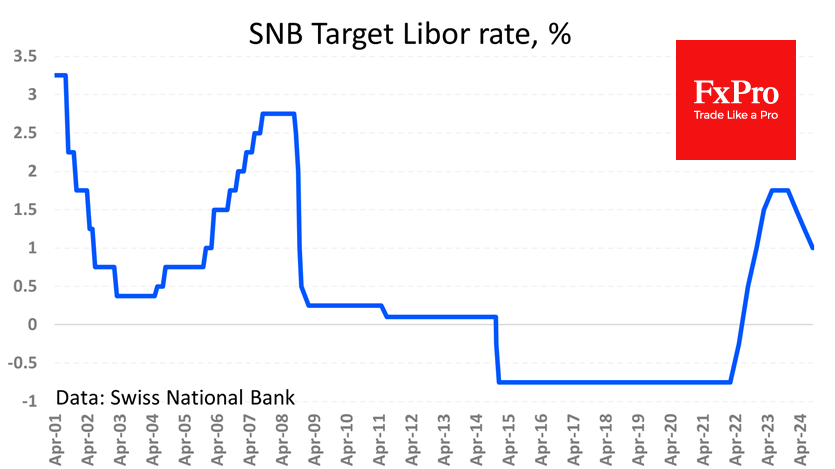
SNB Failed to Surprise With Rate Cut and Unlikely to Weaken Franc
The Swiss National Bank met expectations by cutting its key interest rate by 0.25 percentage points to 1.0%, slowing the pace of the move to normalisation after two cuts of 0.50 percentage points each in March and June. The central bank warned of further rate cuts in the coming quarters. In a commentary, the SNB noted a further marked slowdown in inflation and lowered its end-2024 forecast from 1.4% to 1.0%.
The bank cited the expensive franc as an important reason for the rate cut and inflation, which signals to FX market participants that the current situation is not comfortable. Previously, watchmakers had indicated that the strong franc was hurting sales. On Wednesday, the UBS economic expectations index fell to its lowest level since January at -8.8 from -3.4, against expectations for an increase to 2.7. The trade surplus has also been shrinking for two months. It remains high by historical standards but has been flat for more than a year and has failed to meet expectations against a multi-year rising trend.
It seems that some market participants were prepared for a sharper contraction, as the current decision caused the franc to strengthen by more than 0.6% across the market. The USDCHF pair has been trading in a range of less than 1.5% for the past month, following a 7% decline since the beginning of July. If this was an attempt by the SNB to reverse the trend and begin to weaken the franc, it was rather weak and unimpressive.

Although the Swiss central bank started before the Fed, its 25-point policy easing a week after the FOMC’s 50-point cut looks rather faded. This means that a period of currency market stabilisation could be followed by a new wave of Swiss franc appreciation if the SNB does not act as decisively as the Fed, or even more so.
Natural Gas Price Hits 3-Month High
According to today's XNG/USD chart, the price of natural gas:
→ has risen by approximately 30% since the beginning of September;
→ is currently around the 2.95 level – the last time the price was at this level was at the end of June this year.
Bullish sentiment is supported by:
→ forecasts of a warmer autumn, which is increasing demand for natural gas to power air conditioning systems;
→ concerns related to Hurricane Helen in the US Gulf of Mexico. According to the EIA, 5% of total US dry natural gas production comes from the Gulf of Mexico, and 51% of the total capacity of US natural gas processing plants is located along the US Gulf Coast.
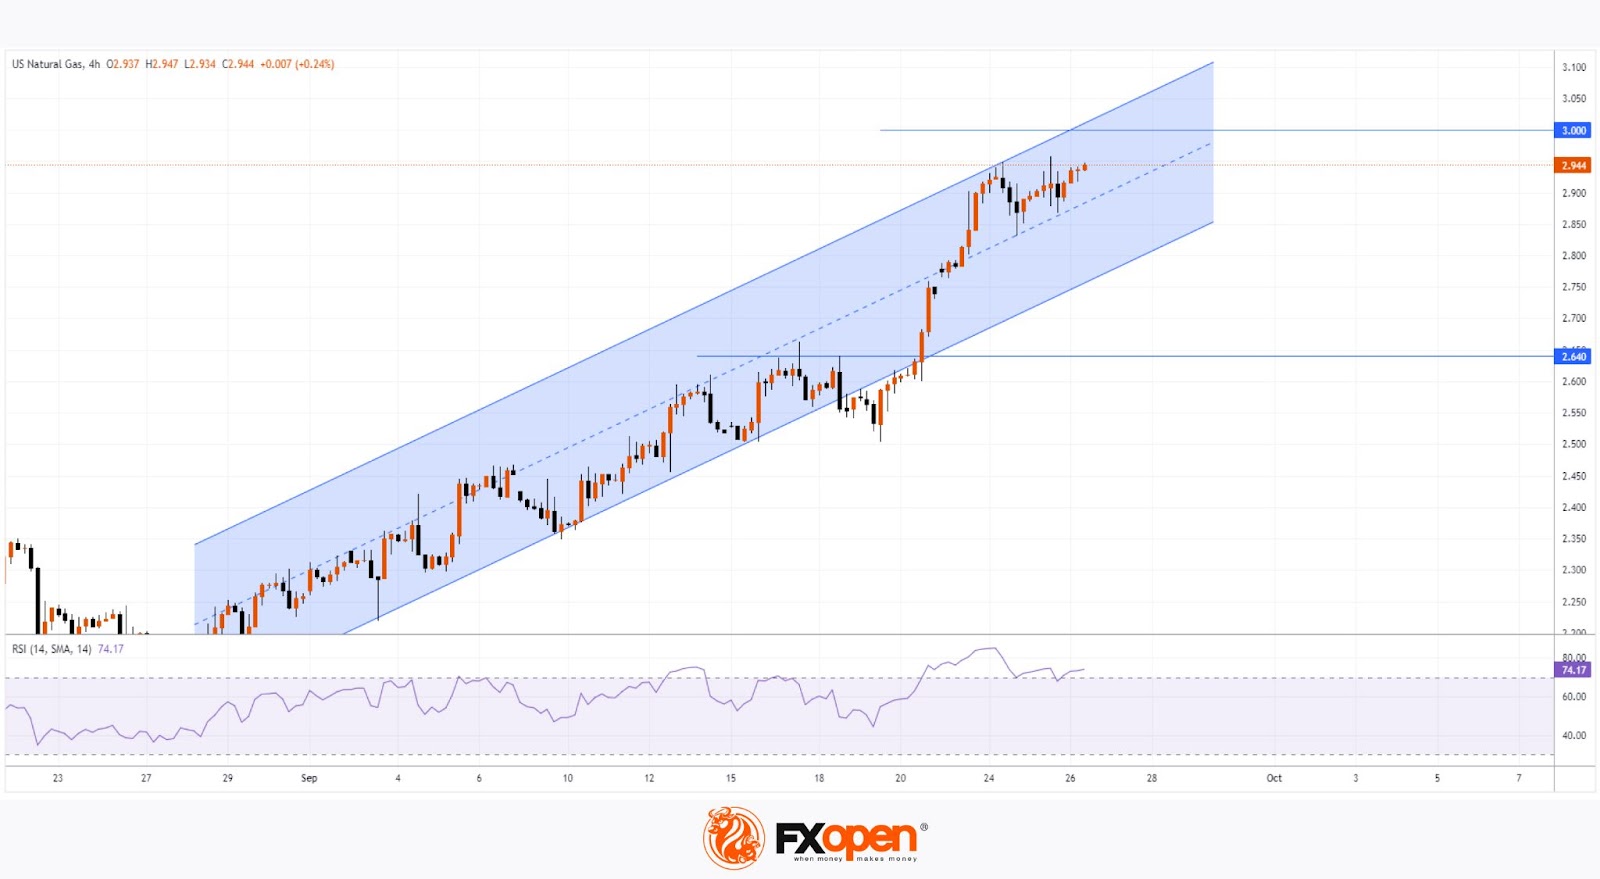
Technical analysis of the XNG/USD chart shows that in September, the price has been moving within an ascending channel (marked in blue).
It is noticeable that from the 20th onwards, demand forces have intensified, leading to the following:
→ the price broke through the 2.64 resistance level;
→ the price moved to the upper half of the ascending channel, after which its median line began to show signs of support;
→ the RSI indicator reached overbought territory.
Currently, there are no signs on the XNG/USD chart of bears attempting to seize control, while the bulls may be "gathering strength" for a possible attempt to break through the psychological level of 3.00. If this happens and is successful, it could pave the way towards the yearly high in the 3.20 region
Start trading commodity CFDs with tight spreads. Open your trading account now or learn more about trading commodity CFDs with FXOpen.
This article represents the opinion of the Companies operating under the FXOpen brand only. It is not to be construed as an offer, solicitation, or recommendation with respect to products and services provided by the Companies operating under the FXOpen brand, nor is it to be considered financial advice.
German economy set for 2nd year of contraction amid structural challenges
Germany's economic prospects have deteriorated further as the Joint Economic Forecast Project Group revised its GDP forecasts downward. The group now expects the German economy to contract by -0.1% in 2024, a downgrade from the previously anticipated 0.1% growth.
This adjustment implies that Germany will face two consecutive years of economic contraction, following a projected decline of -0.3% in 2023.
The forecast for 2025 has also been lowered, with GDP growth now expected at 0.8%, down from the earlier estimate of 1.4%. However, a modest recovery is anticipated in 2026, with growth projected to pick up to 1.3%.
Inflation is expected to decline, offering some relief to the economy. After reaching 5.9% last year, inflation is projected to slow to 2.2% this year and stabilize at 2% in both 2025 and 2026.
Geraldine Dany-Knedlik, head of forecasting and economic policy at DIW Berlin, highlighted the challenges facing Germany. She noted that "structural change" is compounding the economic downturn.
Key factors such as decarbonization, digitalization, and demographic shifts, along with intensified competition from Chinese companies, are initiating "structural adjustment processes." These developments are "dampening the long-term growth prospects" of the German economy, noted Dany-Knedlik.
Dollar Index Outlook: Remains Firm Ahead of US Economic Data and Speeches from Top Fed Officials
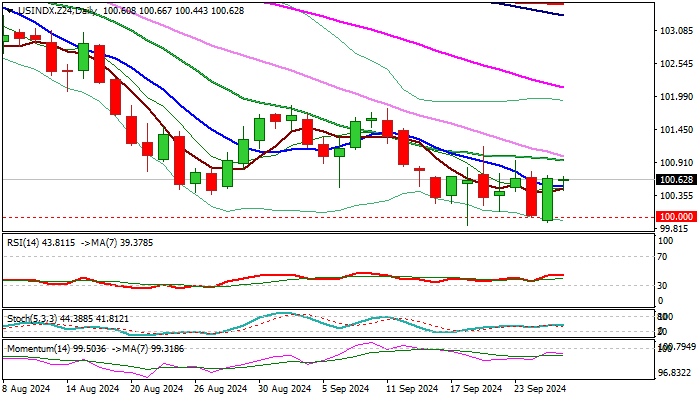
The Dollar Index keeps firm tone early Thursday following 0.7% bounce previous day, on another failure to sustain break below psychological 100 support.
The greenback was lifted by headwinds from 100 zone and improving sentiment, as traders’ view on Fed rate outlook turned hawkish despite dissonant tones from the latest speeches of Fed officials.
The policymakers are divided regarding the central bank’s next steps, as some support stronger policy easing while others are more cautious and point to still elevated inflation as a major threat.
Investors bet for another 50 basis points cut in November, while economists see 25 basis points cuts more likely, contributing to unclear picture about the magnitude and pace of easing in coming months.
All eyes are on speeches of Fed Chair Powell and other central bank officials, due later today, in expectations for clearer signals about Fed’s action.
Releases of US weekly jobless claims and Q2 GDP will be also in focus today.
Technical picture on daily chart has slightly improved but it is bearish overall and warns of persisting downside risks as long as the price stays below pivotal 101.00 resistance zone (converging falling 20/30 DMA’s).
Sustained break here to ease downside pressure and allow for further recovery and attack at next pivots at 101.80 zone lower platform, violation of which to generate reversal signal.
Conversely, repeated attacks at 100 pivot would be likely near-term scenario.
Res: 100.91; 101.00; 101.33; 101.79.
Sup: 100.50; 100.00; 99.86; 99.20.
Elliott Wave forecast for EUR/USD: Bullish Momentum Decreasing in Fifth Wave
EUR/USD came higher during summer, possibly breaking out of a triangle on higher time frame charts, as the market breaks above 1.1140, so it seems that some big moves can be coming. In fact, there was a three wave retracement from recent high on 4h time frame; a contra-trend movement with price turning up from 1.10 support as shown on the updated count. So we were looking for a move up to 1.12, which was tested yesterday so ideally thats the fifth wave, but possibly the final leg of an impulse if we consider that price is quite choppy and slow up here. It looks like pair can be losing some bullish momentum, thus we should be aware of potential limited gain. Maybe around 1.1250/80 area, at around 2023 highs. A drop below 1.1083 can put pair into a more complex correction or even bearish; temporarily.